Category: Aerospace & Defence

  • Mazagon Dock Shipbuilders: Strong Q3 FY25 Performance Signals Robust Long-Term Growth Trajectory

    Executive Summary

    Mazagon Dock Shipbuilders Limited (MAZDOCK), a Navratna Defense Public Sector Undertaking with an established reputation in constructing submarines, destroyers, and frigates, has delivered impressive Q3 FY25 results. The company demonstrated solid operational metrics and indicated promising long-term growth potential supported by a secure order book, substantial backlog, and strategic capital expenditure plans aimed at expanding capacity and upgrading technology.

    Key Company Metrics

    Q3 FY25 Results & Performance Analysis

    Revenue & Earnings Growth

    The Q3 FY25 figures demonstrate robust top-line execution with revenue growth consistent with Mazagon Dock’s historical performance. The company maintained focus on order execution with significant contributions from completed projects, particularly Project 15 Bravo. Notable reversals of D-448 liabilities have additionally boosted profitability during this quarter.

    Margin Performance

    While current profit before tax (PBT) margins exceed industry-normalized ranges, management has provided guidance that over the medium term, normalized margins are expected to settle in the 12-15% range (PBT basis). This adjustment is anticipated as legacy high-margin orders are gradually phased out and new orders come into the pipeline.

    Expense Analysis
    Expense Management

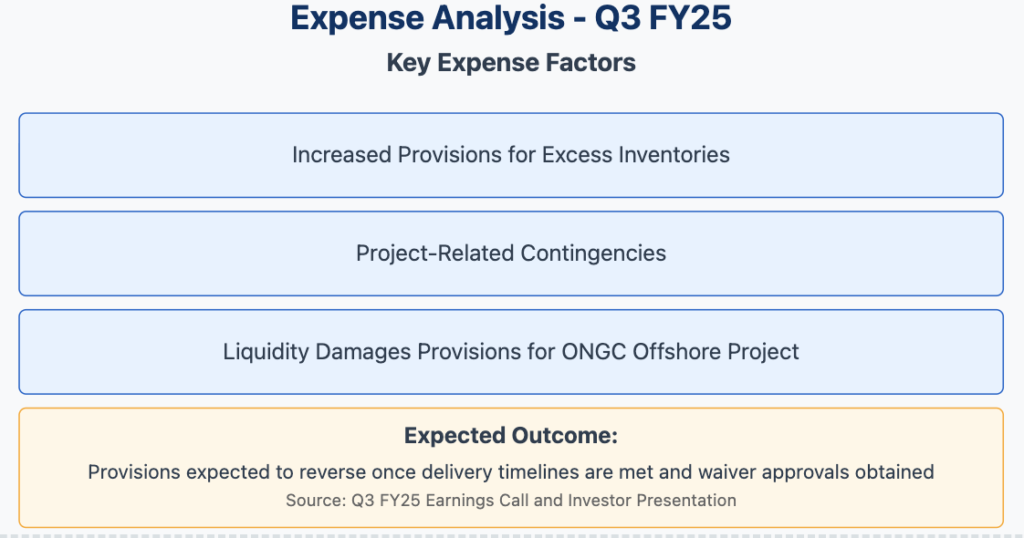
    The company reported increased provisions during the quarter, primarily related to:

    • Excess inventories
    • Project-related contingencies
    • Liquidity damages provisions for the ONGC offshore project

    Management indicated that these provisions are expected to reverse once delivery timelines are met and necessary waiver approvals are obtained, potentially boosting future profitability.

    Future Growth Plans & Expansion Strategy

    CAPEX & Growth Strategy
    CAPEX & Infrastructure Upgrades

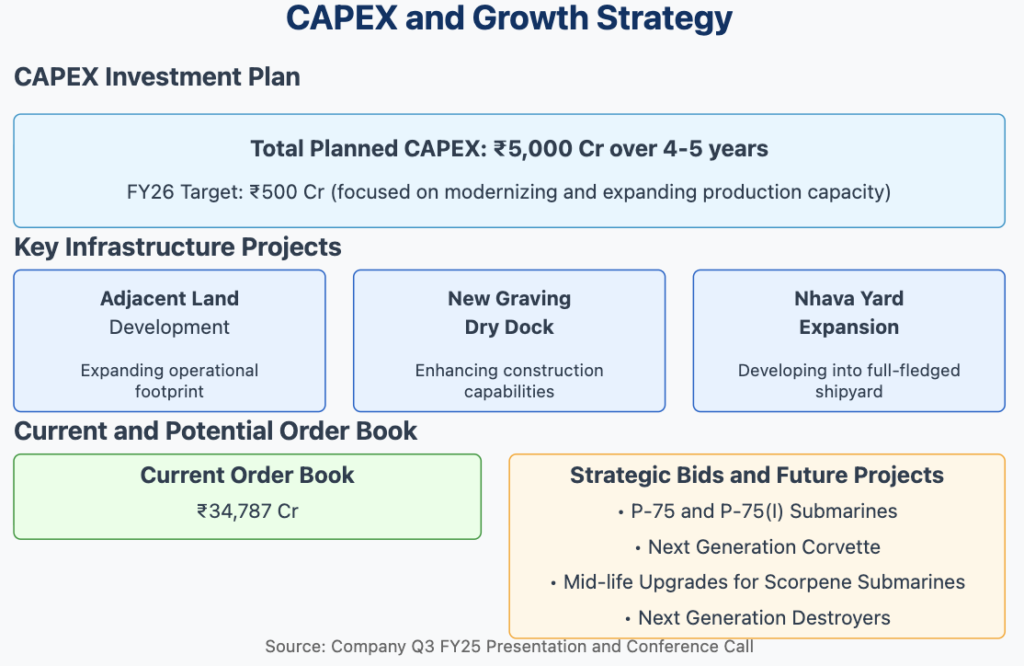
    Mazagon Dock has outlined an ambitious capital expenditure program of approximately ₹5,000 Cr spread over the next 4-5 years. This significant investment is strategically directed toward:

    1. Development of adjacent land assets to expand operational footprint
    2. Construction of a new graving dry dock to enhance shipbuilding capabilities
    3. Expansion of the Nhava Yard into a full-fledged shipyard to increase capacity

    Near-term CAPEX is projected at ₹500 Cr for FY26, with primary focus on modernizing and expanding production capacity to meet future order requirements.

    Order Book & New Projects

    The company maintains a robust order book valued at approximately ₹34,787 Cr, which includes all current projects. Management has indicated promising prospects for upcoming orders in critical segments including:

    • P-75 and P-75(I) submarine programs
    • Additional submarine orders
    • Next-generation destroyers
    • Next Generation Corvette program
    • Mid-life upgrades for Scorpene submarines

    The company is also exploring export potential, with preliminary exports such as support for Malaysian submarines suggesting broader international opportunities on the horizon.

    Long-Term Financial Projections & Return Outlook

    Long-Term Financial Projections
    5-Year Outlook

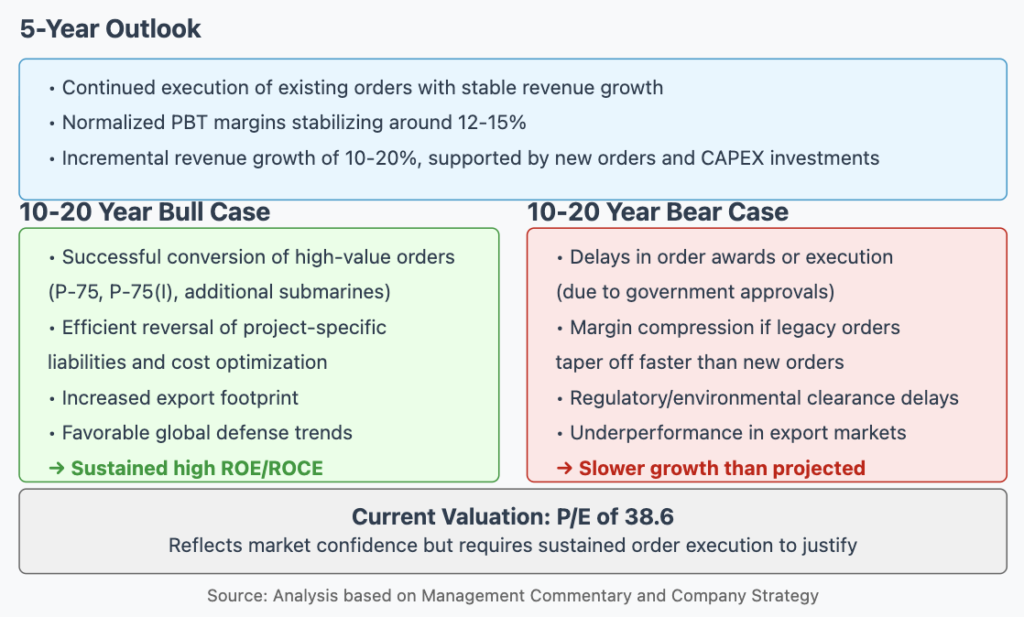
    Over the next five years, Mazagon Dock is expected to focus on:

    • Continued execution of existing orders with stable revenue growth
    • Normalized PBT margins stabilizing around the industry average of 12-15%
    • Incremental revenue growth in the range of 10-20%, supported by new orders and ongoing CAPEX investments

    10-20 Year Outlook

    Bull Case Scenario

    • Successful conversion of high-value orders including P-75, P-75(I), additional submarines, destroyers, and frigate programs
    • Efficient reversal of project-specific liabilities and implementation of cost optimization measures
    • Expanded export footprint and favorable global defense trends boosting revenues and margins
    • Long-term returns benefiting from sustained high ROE/ROCE (currently at 44.2% and 35.2% respectively)
    • Continuation of strong dividend distribution track record, albeit with a modest yield of 0.52%

    Bear Case Scenario

    • Delays in order awards or execution due to government approvals or technical challenges
    • Margin compression if legacy high-margin orders taper off faster than new orders are secured
    • Regulatory or environmental clearance delays impacting CAPEX projects and expansion plans
    • Underperformance in export markets leading to slower growth than projected

    Valuation Perspective

    The current premium valuation (P/E of 38.6) reflects market confidence in Mazagon Dock’s strategic positioning and operational efficiencies. However, this high valuation multiple requires sustained order execution and effective implementation of CAPEX plans to justify future returns for investors.

    Credit Ratings & Financial Health

    Financial Health & Dividend History
    Credit Profile

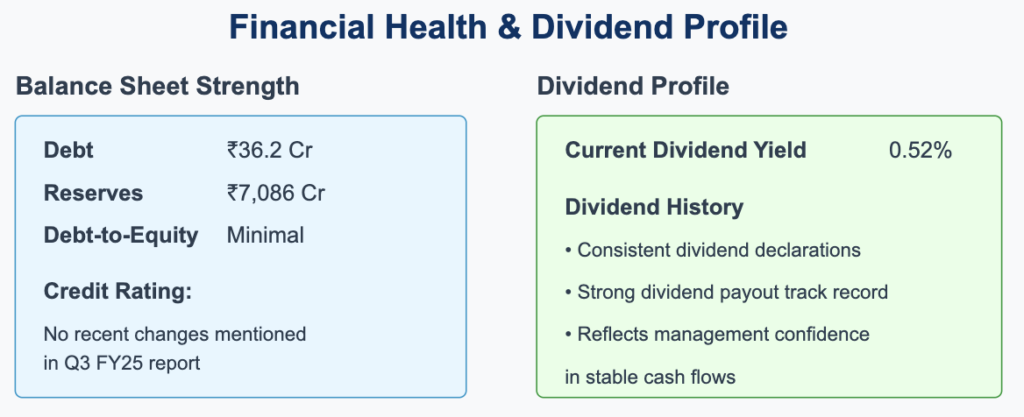
    While the Q3 FY25 report and investor presentation did not explicitly mention any recent changes in credit agency ratings, Mazagon Dock’s financial health remains exceptionally strong. The company’s balance sheet features:

    • Minimal debt of just ₹36.2 Cr
    • Substantial reserves of ₹7,086 Cr
    • Very low debt-to-equity ratio
    • Strong cash position

    This robust financial position underscores the company’s creditworthiness and provides significant headroom for future capital expenditure plans without incurring excessive leverage.

    Dividend Policy

    Mazagon Dock Shipbuilders has maintained a consistent dividend distribution history with a current yield of 0.52%. The company’s strong dividend payout track record reflects management’s confidence in stable cash flows despite the modest current yield. This dividend policy is particularly notable given the substantial capital expenditure plans, indicating management’s balanced approach to shareholder returns while investing for future growth.

    Investment Considerations

    Investment Strengths and Risks
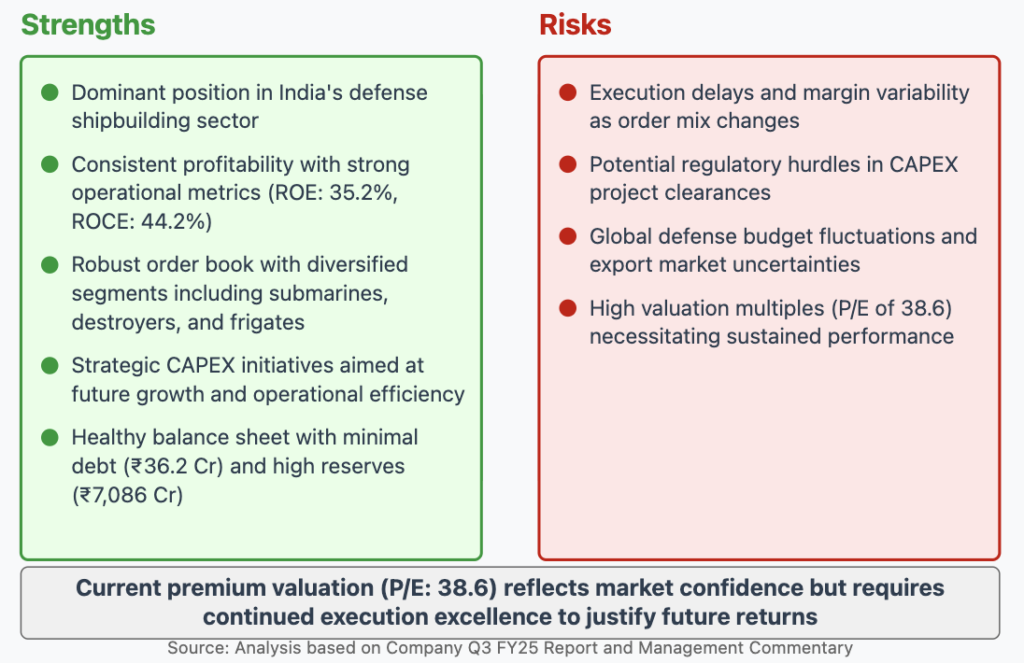
    Strengths

    1. Dominant Market Position: Mazagon Dock maintains a leadership position in India’s defense shipbuilding sector, particularly in constructing submarines, destroyers, and frigates.
    2. Consistent Profitability: The company has demonstrated strong operational metrics with high ROE (35.2%) and ROCE (44.2%) figures, along with impressive 3-year sales and profit growth of approximately 33% and 47% respectively.
    3. Robust Order Book: The current order book of ₹34,787 Cr provides revenue visibility across diversified segments including submarines, destroyers, and frigates.
    4. Strategic CAPEX Initiatives: The planned ₹5,000 Cr CAPEX program over 4-5 years targets future growth and operational efficiency through infrastructure expansion and technology upgradation.
    5. Healthy Balance Sheet: The company maintains minimal debt (₹36.2 Cr) against substantial reserves (₹7,086 Cr), providing significant financial flexibility for future growth plans.

    Risks

    1. Execution Delays: Potential delays in project execution and margin variability as the order mix changes from legacy high-margin orders to newer contracts.
    2. Regulatory Hurdles: Possible challenges in securing regulatory and environmental clearances for planned CAPEX projects.
    3. Defense Budget Fluctuations: Exposure to global defense budget dynamics and uncertainties in export markets could impact future order inflows.
    4. Premium Valuation: The current high P/E multiple of 38.6 requires sustained performance excellence to justify future returns for investors.

    Conclusion

    Investment Outlook Summary
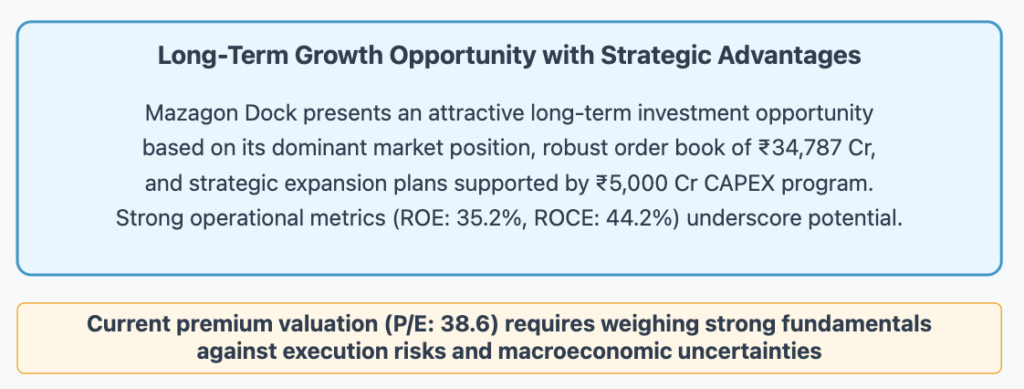
    Mazagon Dock Shipbuilders Limited presents an attractive long-term investment opportunity based on its dominant market position in India’s defense shipbuilding sector, robust order book of ₹34,787 Cr, and strategic expansion plans supported by a comprehensive ₹5,000 Cr CAPEX program spread over the next 4-5 years.

    The company’s Q3 FY25 results demonstrate solid operational execution with strong financial metrics, including impressive ROE of 35.2% and ROCE of 44.2%. With minimal debt of just ₹36.2 Cr against substantial reserves of ₹7,086 Cr, the company maintains significant financial flexibility to fund its expansion plans while continuing its consistent dividend distribution policy.

    While the current premium valuation (P/E of 38.6) reflects market confidence in the company’s long-term prospects, investors should carefully weigh the strong fundamentals and growth potential against execution risks, potential regulatory hurdles, and macroeconomic uncertainties before making investment decisions.

    The company’s ability to secure and execute future high-value orders in submarine programs (P-75, P-75(I)), next-generation destroyers, and potential export opportunities will be crucial in determining whether it can maintain its strong growth trajectory over the 5-20 year horizon that would justify its current valuation multiples.

    Disclaimer

    This report is for informational purposes only and does not constitute investment advice. Investors should conduct their own research or consult a financial advisor before making any investment decisions.

  • MTAR Technologies: Precision Engineering Powerhouse

    MTAR Technologies Ltd – Full Q3 FY2025 Results Financial Report

    MTAR Technologies Ltd

    Full Q3 FY2025 Financial Report

    1. Executive Summary

    MTAR Technologies Ltd, established in 1970, is a leading supplier of high-precision components and equipment across defense, aerospace, nuclear, and clean energy sectors. With a current market capitalization of approximately ₹4,673 Cr and a diversified product portfolio, the company is well-positioned to capitalize on both domestic and export opportunities. Recent Q3 FY2025 performance shows solid profitability amid strategic CAPEX plans and continued order inflows, despite challenges in margins and evolving market dynamics.

    2. Q3 FY2025 Performance Highlights

    Revenue & Profitability

    • Sales: ₹636 Cr
    • Net Profit: ₹44.7 Cr
    • Earnings Per Share (EPS): ₹5.31
    • Operating Margin (OPM): 16-19%

    Quarterly Variation

    • Quarter Sales Variation: 47.6%
    • Operating Margin: Approximately 16.4%
    • Secured Orders: Approximately ₹200 Cr
    • Indicative of strong seasonal or order book-driven dynamics

    3. Future Growth Plans & Planned Expansions

    Expansion Initiatives

    MTAR plans to scale its manufacturing capacity with significant CAPEX investments targeting modernization of production units and automation upgrades. This will enhance both volume output and quality, reducing per-unit costs over time.

    Product Diversification & R&D

    The company is extending its footprint into nuclear and clean energy sectors. Continued R&D is set to drive innovations in core products such as ball screws and electro-mechanical actuation systems, ensuring competitiveness in a technology-driven market.

    Order Book & Market Penetration

    With a healthy inflow of orders from government and export contracts, MTAR expects sustained double-digit revenue growth. Expansion into emerging sectors, combined with existing defense and aerospace expertise, creates multiple growth avenues.

    4. Products, CAPEX & Strategic Rationale

    Product Portfolio

    MTAR’s range of engineered components is used in critical applications for defense, aerospace, and nuclear energy. Its ability to serve niche, high-specification segments is a key differentiator.

    Capital Expenditure

    Planned investments focus on increasing manufacturing capacity and upgrading technological capabilities. The rationale is to meet rising demand, improve efficiency, and capture larger orders from both government and private sector contracts.

    Strategic Rationale

    By reinvesting earnings into CAPEX and R&D, MTAR aims to sustain competitive advantages, support margin improvement, and ensure long-term revenue growth despite a cyclically challenging operating environment.

    5. Competitive Landscape & Inherent Risks

    Competitive Environment

    MTAR operates in a specialized market with competitors targeting defense and aerospace sectors. Its long history, technological expertise, and established customer relationships (both domestic and international) position it well despite stiff competition.

    Key Risks

    • Execution Risk: Potential delays or cost overruns in CAPEX projects
    • Order Concentration: Dependency on government and defense orders
    • Technological Obsolescence: Requires continuous R&D investment
    • Supply Chain Vulnerabilities: Raw material cost fluctuations

    6. Valuation Estimate & Investment Thesis

    Valuation Estimate

    Based on the current trading price of around ₹1,519, a forward P/E of 104, and a robust order book, analysts expect a target price in the range of ₹1,800–₹2,000, contingent on effective CAPEX execution and margin improvement.

    Investment Thesis

    Strengths:

    Diversified, technology-driven product portfolio with deep penetration in defense, aerospace, and clean energy segments; strong order book; disciplined CAPEX and R&D investments.

    Catalysts:
    • Expansion into new segments
    • Successful CAPEX execution
    • Securing additional large government/export orders

    7. Key Fundamental Metrics

    Company Metrics

    • Market Cap: ₹4,673 Cr
    • Current Price: ₹1,519
    • High/Low: ₹2,200 / ₹1,470
    • Stock P/E: 104
    • Book Value: ₹228
    • Dividend Yield: 0.00%

    Performance Metrics

    • ROCE: 11.4%
    • ROE: 8.37%
    • Sales: ₹636 Cr
    • Operating Margin: 16.4%
    • Sales Growth (Recent): 0.37%
    • Profit Growth (Recent): -45.4%

    Ownership & Structure

    • Promoter Holding: 31.4%
    • Change in Promoter Holding (3-Year): -18.8%
    • No. of Equity Shares: 3.08 Cr
    • Face Value: ₹10.0
    • Debt: ₹184 Cr
    • Reserves: ₹670 Cr

    8. Conclusion & Disclaimer

    Conclusion

    MTAR Technologies Ltd’s Q3 FY2025 results underscore a stable profitability profile supported by ongoing CAPEX and product innovation. The strategic expansion into high-growth sectors, along with a healthy order book, makes the company an attractive long-term proposition despite near-term execution risks and valuation pressures.

    Disclaimer

    This report is for informational purposes only and does not constitute investment advice. Investors should conduct their own research and consider their risk tolerance before making any investment decisions.

    © 2025 Financial Report Analysis – MTAR Technologies Ltd

  • GRSE Q3 FY2025: Defense Shipbuilder Multibagger

    GRSE (Garden Reach Shipbuilders) Q3 FY2025 Results

    Garden Reach Shipbuilders & Engineers Ltd. (GRSE) – Q3 FY2025

    Value Pick Multibagger Stock to buy

    1. Company Overview

    Garden Reach Shipbuilders & Engineers Ltd. (GRSE) is one of India’s premier defense public sector shipyards under the Ministry of Defence. With a legacy of over six decades, GRSE has built over 100 warships and numerous commercial vessels. The company is a key supplier to the Indian Navy, Indian Coast Guard, and foreign naval forces. GRSE also manufactures deck machinery, engineering equipment, and pre-fabricated bridges.

    2. Q3 FY2025 Financial Performance

    Metric Q3 FY2025 Q3 FY2024 YoY Growth
    Revenue from Operations (₹ Cr.) 1,271.00 923.09 +37.7%
    Total Income (₹ Cr.) 1,343.12 1,004.61 +33.7%
    EBITDA (₹ Cr.) 151.02 126.47 +19.4%
    EBITDA Margin (%) 11.9% 12.6% -70 bps
    Profit Before Tax (₹ Cr.) 133.76 118.67 +12.7%
    Profit After Tax (₹ Cr.) 98.18 88.25 +11.3%
    EPS (₹) 8.57 7.70 +11.3%

    Revenue Growth: The revenue jump is attributed to the strong execution of defense shipbuilding contracts.

    Profitability: Despite a 37.7% YoY sales growth, net profit grew only 11.3%, indicating margin pressure due to increased raw material costs and subcontracting expenses.

    3. Key Financial Ratios

    Metric Value Industry Average
    ROCE 27.4% 18-20%
    ROE 22.2% 15-17%
    Debt/Equity Ratio 0.004 0.2-0.5
    Net Profit Margin 8.25% 10-12%
    Current Ratio 1.16 1.3-1.5
    Key Takeaway: GRSE’s high ROCE and ROE reflect its capital efficiency, but margins are under slight pressure.

    4. Future Growth Plans & Expansion Strategy

    1. Order Book Strength & New Contracts

    GRSE’s current order book stands at ₹25,000+ Cr., providing multi-year revenue visibility.

    Major Projects Include:

    • Frigate and Corvette projects for the Indian Navy
    • Survey vessels and landing craft utility ships for the Indian Coast Guard
    • Potential exports to friendly nations under the “Make in India” initiative

    2. Expansion of Shipbuilding Capabilities

    Capex Plan: ₹500-600 Cr. over the next three years to expand capacity and improve efficiency.

    Strategic Objectives:

    • Automation of shipbuilding yards to reduce construction time
    • Enhanced R&D investments to develop indigenous ship designs
    • Green Energy Initiatives in manufacturing to improve sustainability

    3. Focus on Non-Defense Business

    GRSE is diversifying into commercial shipbuilding to reduce reliance on defense contracts. Targets include inland water transport vessels, tugs, and ferries for global markets.

    5. Capital Expenditure & Strategic Rationale

    Capex Component Investment (₹ Cr.) Expected Benefit
    Modernization of shipyards 350 Faster shipbuilding
    Automation & AI integration 150 Reduce costs
    R&D & indigenous ship design 100 Competitive edge
    Why It Matters: This expansion will increase shipbuilding efficiency, reduce dependency on imported components, and support future defense contracts.

    6. Competitive Landscape

    Company Market Cap (₹ Cr.) P/E ROCE ROE Dividend Yield
    Garden Reach Shipbuilders 17,268 43.7 27.4% 22.2% 0.62%
    Cochin Shipyard 27,542 35.3 22.5% 18.7% 1.1%
    Mazagon Dock Shipbuilders 59,000 28.2 34.5% 26.8% 0.5%

    Takeaway:

    • GRSE has a strong ROCE and ROE, but trades at a premium valuation compared to peers like Cochin Shipyard
    • Mazagon Dock has a larger market share but GRSE is catching up with strong revenue growth

    7. Risk Assessment

    Execution Delays Potential cost overruns in large projects
    Raw Material Costs Higher steel and component prices may squeeze margins
    Geopolitical Risks Dependence on government contracts makes it vulnerable to policy shifts
    Mitigation: GRSE’s diversification and capex in efficiency improvements should reduce cost risks.

    8. Valuation Analysis

    Market Cap (₹ Cr.) 17,268
    Current Price (₹) 1,508
    52W High / Low (₹) 2,835 / 673
    P/E Ratio 43.7
    Book Value (₹) 161
    ROCE 27.4%
    ROE 22.2%
    Debt ₹9.59 Cr.
    Dividend Yield (%) 0.62%

    The current P/E of 43.7x is higher than industry peers, suggesting the stock is priced for strong future growth.

    If we assume a 25% earnings CAGR for the next 2 years, a fair forward P/E of 35x indicates potential for continued valuation support.

    Investment Thesis

    ✅ Strong Order Book & Execution Capabilities

    ✅ Debt-Free & High ROCE/ROE Metrics

    ✅ Robust Capex Plan for Future Growth

    🚨 Recommended: Accumulate on Market Dips

    9. Conclusion

    Near-Term View

    The stock is trading at a high valuation, making it vulnerable to short-term corrections. Best accumulated on market dips.

    Long-Term View

    With a strong order book and expansion strategy, GRSE is a solid long-term play on India’s naval defense modernization.

    Disclaimer: This report is for informational purposes only and does not constitute investment advice. Please consult a financial advisor before making investment decisions.

Value Picks fin.ctoi.in
Value Picks

Dont Miss our Value picks

SUBSCRIBE TO OUR NEWSLETTER to Get short term, long term and multi-bagger

We don’t spam! Read our privacy policy for more info.