EV: Expanded iQube line (2.2 kWh, 3.4 kWh, 5.1 kWh batteries) across key markets; King EV Max (179 km range, 2h15m fast-charge, SmartXonnect) launched.
Premium: Continued global roll-out of Norton Motorcycles (fresh models in ’25–’27).
Geographical Expansions
Exports: Sharpened focus on LatAm (including Brazil), North Africa (Morocco), Southeast Asia; Africa market share momentum.
Strategic JV: Micro-mobility tie-up with Hyundai at Bharat Mobility Global Expo.
Aftermarket & Financial Services
TVS Credit: Book size ₹ 27,190 Cr (+7% y-o-y); PBT ₹ 321 Cr (+40%) with 3 million new customers .
Diversification into used-vehicle loans and unsecured lending via data analytics.
4. CAPEX & Growth Strategy
FY 25 Capex: ₹ 1,300 Cr focused on capacity expansion, R&D (software/EV), digitalization and global footprint.
PLI: Full-year Production-Linked Incentive (PLI) benefit recognized in Q4, to accrue quarterly from FY 26 onward.
Execution: EV charging infrastructure roll-out pace.
Disclaimer This report is for informational purposes only and does not constitute investment advice. Investors should conduct their own due diligence and consult with a qualified financial advisor before making any investment decisions.
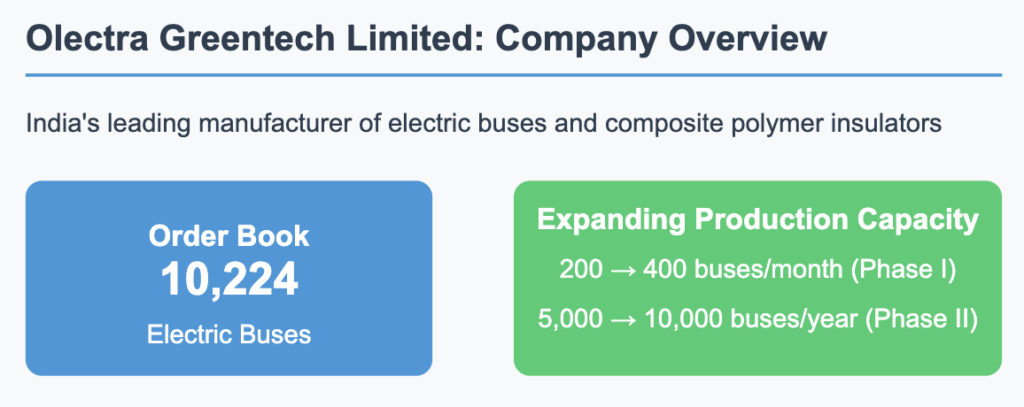
Olectra Greentech Limited stands at the forefront of India’s electric vehicle revolution as the country’s leading manufacturer of electric buses and composite polymer insulators. With a robust order book of 10,224 electric buses and aggressive capacity expansion plans, Olectra is strategically positioned to capitalize on India’s growing commitment to sustainable transportation solutions. This report analyzes the company’s Q3 FY2025 performance, growth trajectory, and long-term investment potential.
Q3 FY2025 Financial Performance
Q3 FY2025 Financial Performance
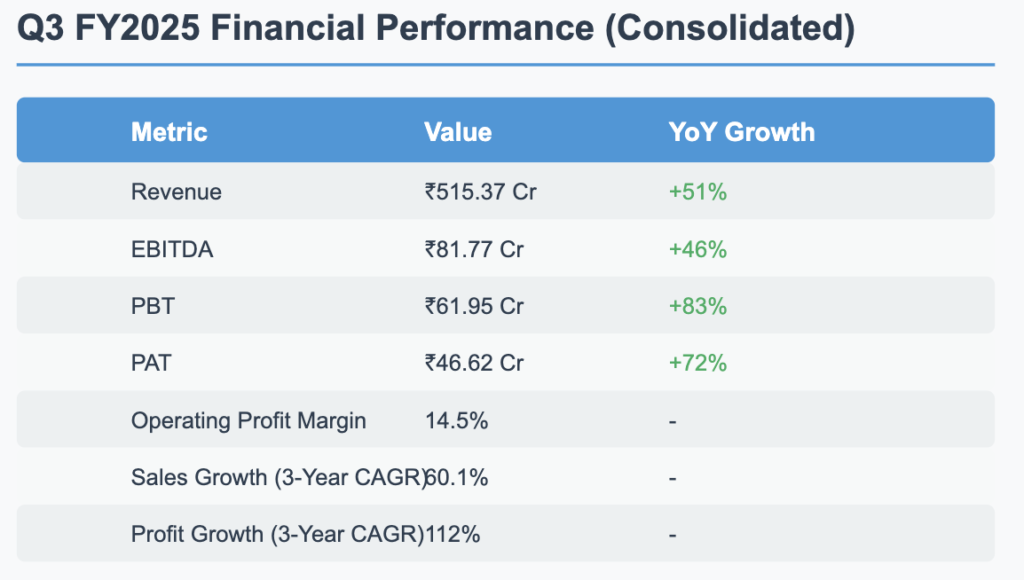
Olectra Greentech delivered an exceptional financial performance in Q3 FY2025, demonstrating the company’s strong growth momentum and increasing market dominance in the electric bus segment. The company reported consolidated revenue of ₹515.37 crore, representing a robust year-over-year growth of 51%. This performance was primarily driven by increased deliveries in the EV division, which contributed ₹459.78 crore to the total revenue, while the Insulator division added ₹4.7 crore.
Profitability metrics showed significant improvement, with EBITDA reaching ₹81.77 crore (+46% YoY) and PAT soaring to ₹46.62 crore (+72% YoY). The company maintained a healthy operating profit margin of 14.5%, indicating efficient cost management despite rapid expansion. The impressive three-year CAGR of 60.1% for sales and 112% for profits underscores Olectra’s consistent execution and growing market acceptance of its products.
Growth Plans & Expansion
Growth Plans & Expansion
Capacity Expansion
Olectra Greentech is embarking on an ambitious capacity expansion program to meet the growing demand for electric buses in India. The expansion is structured in two phases:
Phase-I: Increasing production capacity from 200 to 400 buses per month
Phase-II: Enabling production of 5,000 buses annually, with plans to further scale up to 10,000 buses per year
To fund this expansion, the company is investing ₹750 crore in capital expenditure, financed through a combination of ₹500 crore in debt and internal accruals. This strategic investment will significantly enhance Olectra’s manufacturing capabilities, allowing it to efficiently execute its growing order book.
Technology Innovation
Olectra is not just expanding capacity but also investing in cutting-edge technology to maintain its competitive edge:
Blade Battery Technology: The company has introduced this advanced battery technology to improve energy efficiency, safety features, and charging speed of its electric buses.
Battery Energy Storage Systems (BESS): Exploring investments in BESS represents a forward-looking approach to diversify its product portfolio and address the broader energy storage market.
Order Book & Execution Strategy
Order Book & Execution Strategy
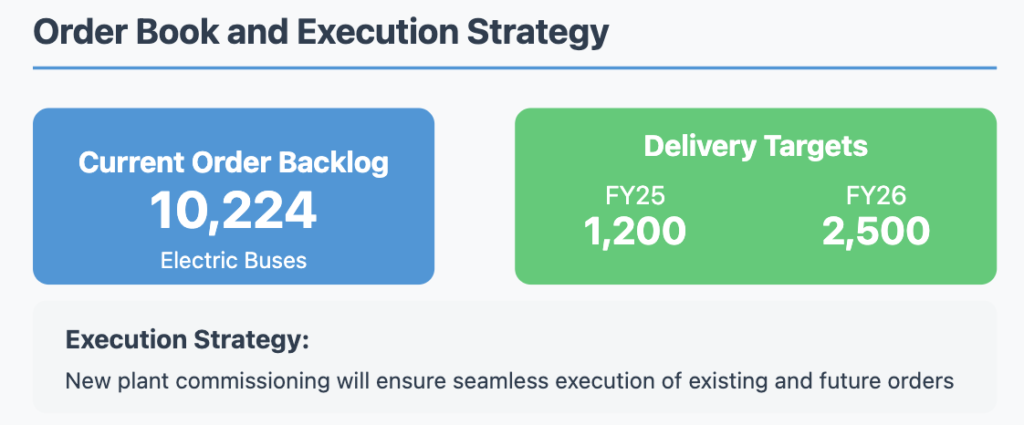
With a substantial backlog of 10,224 electric buses, Olectra has a clear visibility of future revenue. The company has set ambitious delivery targets of 1,200 buses in FY25 and 2,500 buses in FY26. The commissioning of new manufacturing facilities is strategically timed to ensure seamless execution of both existing and upcoming orders, mitigating potential production bottlenecks.
Future Financial Projections & Returns
Future Financial Projections
Short-Term (1-3 Years)
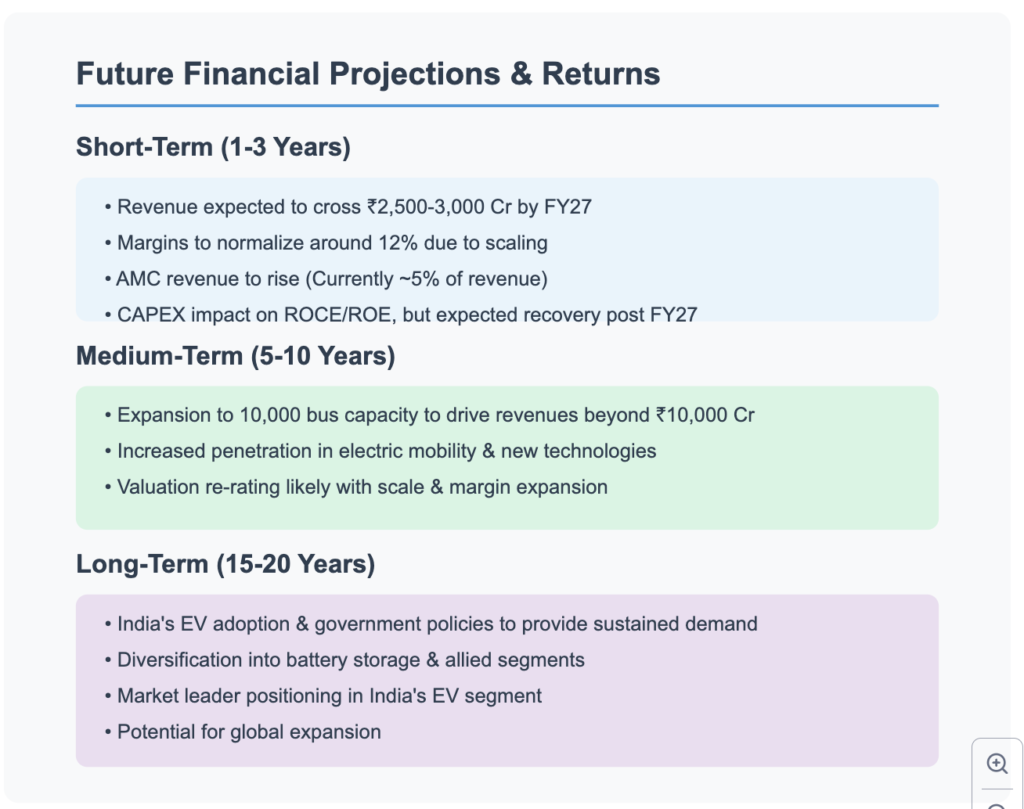
Olectra is positioned for substantial growth in the near term, with revenue projected to exceed ₹2,500-3,000 crore by FY27. While operating margins are expected to normalize around 12% due to scaling effects, the company’s Annual Maintenance Contract (AMC) revenue stream is anticipated to grow from its current level of approximately 5% of total revenue.
The significant CAPEX investment may temporarily impact return metrics like ROCE and ROE; however, these are expected to recover post-FY27 as the new capacity begins to generate sustainable returns.
Medium-Term (5-10 Years)
The medium-term outlook is particularly promising, with the expansion to 10,000 bus manufacturing capacity driving annual revenues beyond ₹10,000 crore. Increased penetration in the electric mobility sector, coupled with diversification into new technologies like BESS and charging infrastructure, will create multiple growth avenues.
As the company achieves scale and potentially expands its margins, a valuation re-rating is likely, providing substantial returns to long-term investors.
Long-Term (15-20 Years)
The long-term investment thesis for Olectra is underpinned by India’s accelerating EV adoption trajectory and supportive government policies. The company is strategically positioning itself to benefit from these secular trends through:
Diversification into battery storage and allied segments
Cementing its market leadership in India’s EV segment
Exploring potential global expansion opportunities
Key Metrics & Valuation Analysis
Key Metrics & Valuation
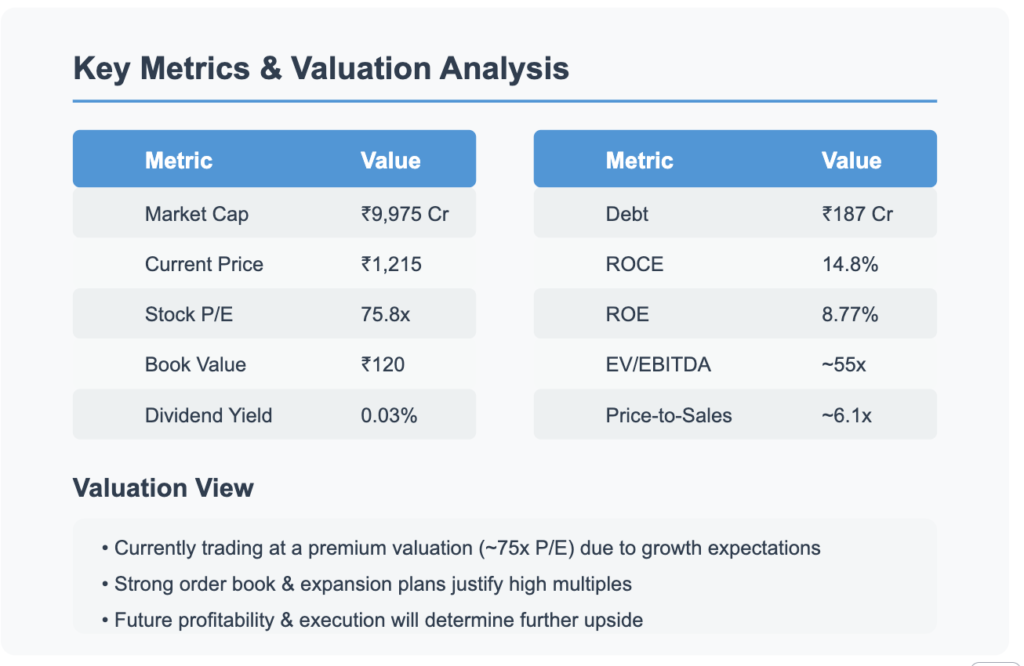
Olectra Greentech currently trades at premium valuations, with a P/E ratio of 75.8x and an EV/EBITDA multiple of approximately 55x. These elevated multiples reflect the market’s optimistic outlook on the company’s growth potential in the rapidly expanding electric mobility sector. Key financial metrics include:
Market Capitalization: ₹9,975 crore
Current Price: ₹1,215
Book Value: ₹120
Debt: ₹187 crore (planned increase by ₹500 crore for CAPEX)
ROCE: 14.8%
ROE: 8.77%
Price-to-Sales Ratio: ~6.1x
Dividend Yield: 0.03% (low payout as the company prioritizes reinvestment for growth)
While the valuation appears stretched by conventional metrics, the strong order book and ambitious expansion plans provide a significant runway for growth that could justify these premium multiples. However, future performance will heavily depend on successful execution of capacity expansion and maintaining profRetry
Claude hit the max length for a message and has paused its response. You can write Continue to keep the chat going.
Risks & Challenges
Risks & Challenges
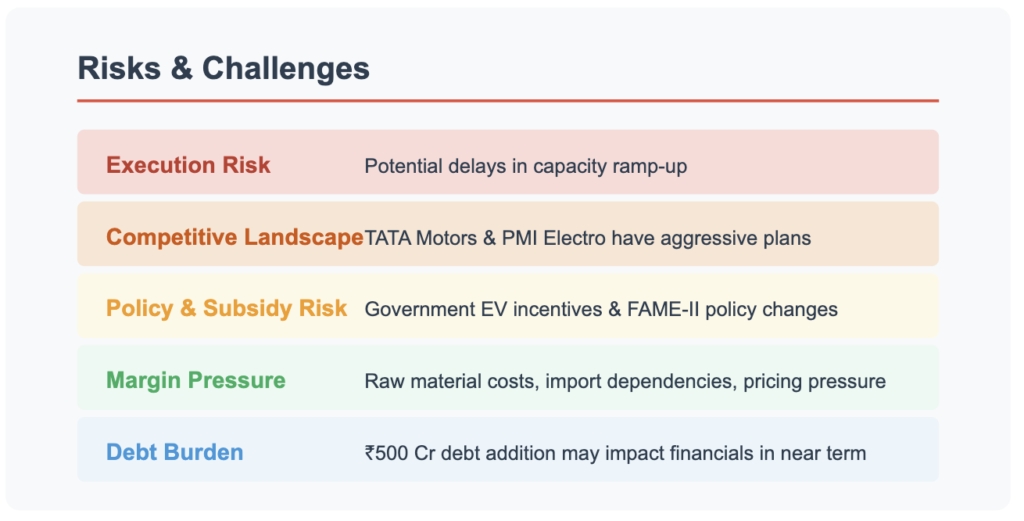
While Olectra Greentech presents a compelling growth story, investors should be mindful of several key risks:
Execution Risk: The ambitious capacity expansion plan could face delays or cost overruns, potentially affecting delivery timelines for the large order book.
Competitive Landscape: Major players like TATA Motors and PMI Electro are aggressively expanding their electric bus portfolios, which could intensify pricing pressure and competition for new orders.
Policy & Subsidy Risk: Changes in government EV incentives or FAME-II policy could impact demand dynamics and profitability.
Margin Pressure: Fluctuations in raw material costs, import dependencies for critical components, and competitive pricing pressure could constrain margins.
Debt Burden: The addition of ₹500 crore in debt for CAPEX could temporarily strain the balance sheet and impact near-term financial metrics.
Credit Rating & Dividend Outlook
Olectra Greentech has not reported any significant changes in its credit rating. The company maintains a conservative dividend policy with a yield of just 0.03%, as it prioritizes reinvesting capital into its growth initiatives rather than distributing profits to shareholders.
Investment Decision Summary
Investment Decision Summary
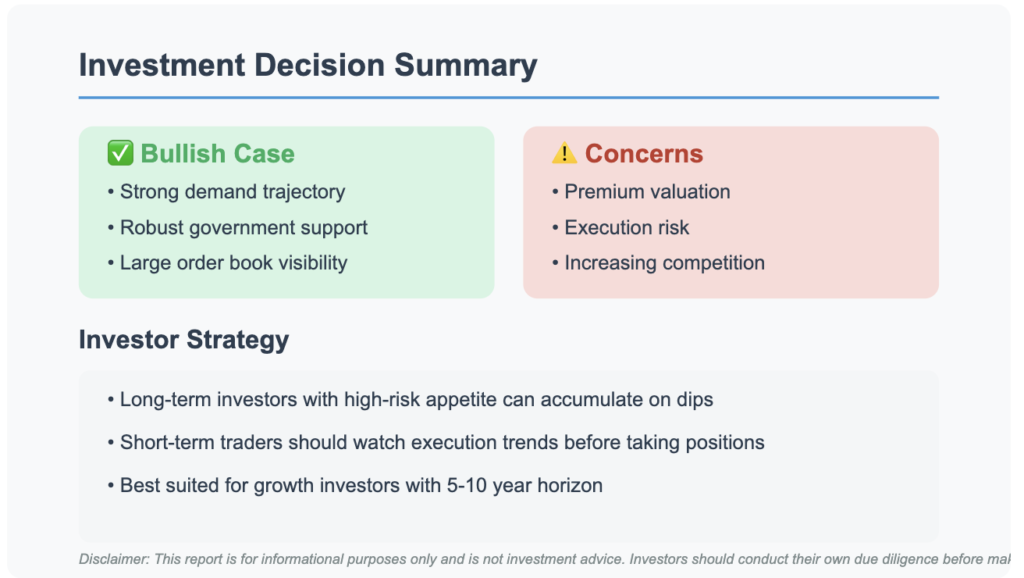
Bull Case
Olectra is riding the strong demand wave for electric buses in India, supported by favorable government policies and initiatives
The substantial order book of 10,224 buses provides excellent revenue visibility
Technology innovations and capacity expansion position the company for sustainable long-term growth
First-mover advantage in a rapidly growing market segment
Bear Case
The current valuation (75.8x P/E) is at a significant premium and may not be sustainable if execution falters
Planned debt addition of ₹500 crore could strain near-term financials
Increasing competition from established players like TATA Motors could pressure margins
Dependency on government policies and subsidies creates regulatory risk
Investor Strategy
Olectra Greentech represents an attractive investment opportunity for growth-oriented investors with a 5-10 year time horizon and high-risk tolerance. The company’s positioning in India’s rapidly expanding electric mobility sector, coupled with its strong order book and expansion plans, provides a solid foundation for long-term growth.
Long-term investors with high-risk appetite can consider accumulating positions on market dips
Short-term traders should closely monitor execution trends and quarterly delivery numbers before establishing positions
Income-focused investors may find the stock less attractive due to its minimal dividend yield (0.03%)
The stock is best suited for portfolio allocation in the high-growth, high-risk segment, with investors prepared to weather potential volatility as the company executes its ambitious expansion plans.
Conclusion
Olectra Greentech Limited stands at an inflection point in its growth journey, with Q3 FY2025 results highlighting its accelerating momentum in India’s electric bus market. The company’s aggressive capacity expansion, technological innovations, and robust order book position it favorably to capitalize on the structural shift toward sustainable transportation solutions in India.
While the premium valuation reflects high growth expectations, successful execution of the capacity expansion plan and maintaining healthy margins will be critical to delivering shareholder value. Investors with a long-term horizon and appetite for growth stocks should consider Olectra Greentech as a potential beneficiary of India’s electric mobility revolution.
Disclaimer: This report is for informational purposes only and is not investment advice. Investors should conduct their own due diligence before making investment decisions.
Q3 EBITDA: ₹1,211 Cr (12.8% margin vs 12.0% last year)
Net Profit: ₹762 Cr (31% YoY growth)
EPS: 2.59 (improved from 1.98)
Cash and Debt Position
Net Cash Position: ₹958 Cr (improved from net debt of ₹1,747 Cr in Q3 FY24)
Operational Metrics & Market Share
Domestic MHCV Market Share: >30%
Export Volumes: 4,151 units (33% YoY growth)
Bus Segment: Maintained market leadership
2. Future Growth Plans & Strategic Expansion
Product Innovation & Portfolio Expansion
Electric & Alternative Fuel Vehicles
Switch Mobility: New 7.5-tonne electric truck
Industry-first electric port terminal tractor
Ongoing R&D in battery electric and alternate fuel products
New Market Segments
SAATHI: New entry-level LCV platform launch
Introduction of India’s first 15-meter front-engine sleeper bus
Capital Expenditure & Investment
Technology & R&D modernization
TECOSIM Group GmbH acquisition through Hinduja Tech
Production capacity expansion
Enhanced automation and digitalization
Global Expansion & Diversification
33% YoY export growth
Strong performance in Defence, Power Solutions, and Aftermarket segments
Integration of financial services
3. Competitive Landscape & Inherent Risks
Competitive Advantages
Dominant position in MHCV and bus segments
Strong dealer network
Early mover in electric and alternative fuel vehicles
Continuous product innovation
Key Risks & Challenges
Cyclical nature of commercial vehicle market
Rising raw material prices and input costs
Competition from established players and EV startups
Regulatory changes in environmental and emission norms
4. Valuation & Investment Thesis
Valuation Overview
P/E Ratio: 23.1x
ROE: 28.4%
ROCE: 15.0%
Debt-to-Equity: 0.15
Investment Thesis
Strong market recovery potential in CV segment
Strategic investments in electrification
Focus on cost leadership and premiumization
Improved financial flexibility
Projected upside potential: 10-15% (medium term)
5. Conclusion
Ashok Leyland Ltd demonstrates strong potential for continued growth through:
Market leadership in CV space
Aggressive expansion into electric and alternative fuel vehicles
Sound financial management
Clear product innovation roadmap
Strategic capacity expansion plans
Disclaimer: This report is for informational purposes only and does not constitute investment advice. Prospective investors should conduct their own research or consult a qualified financial advisor before making any investment decisions.
Tata Motors Group (NSE: TATAMOTORS) delivered a strong Q3 FY25 performance with ₹113,575 Cr in revenue and a consolidated EBITDA margin of 13.7%. Despite global economic challenges, Tata Motors remains on track for a strong full-year performance.
Market Stats
Market Cap: ₹2,56,519 Cr
Current Price: ₹697
52-Week Range: ₹683 – ₹1,179
Stock P/E: 8.06
Book Value: ₹275
Financial Ratios
Dividend Yield: 0.43%
ROCE: 20.1%
ROE: 49.4%
Debt: ₹1,06,549 Cr
Reserves: ₹1,00,326 Cr
Growth Metrics
Sales Growth (YoY): 4.53%
Profit Growth (YoY): 57.9%
Sales Growth (3Y Avg): 20.6%
Profit Growth (3Y Avg): 128%
Promoter Holding: 42.6% (-3.83% over 3Y)
2. Q3 FY25 Financial Performance
Consolidated Highlights
Revenue: ₹113,575 Cr (+2.7% YoY)
EBITDA Margin: 13.7% (+60 bps YoY)
PBT (before exceptional items): ₹7,700 Cr
Net Auto Debt: ₹19,200 Cr (down from ₹29,200 Cr YoY)
Free Cash Flow (Automotive): ₹4,700 Cr
Segment-Wise Performance
Jaguar Land Rover (JLR)
Revenue: £7.5B (+2% YoY)
EBIT Margin: 9.0%
PBT: £523M (-17% YoY)
ROCE: 19.6%
Net Debt: £1.1B
Electrification: 80% new vehicles
Commercial Vehicles (CV)
Revenue: ₹18,431 Cr (-8.4% YoY)
EBITDA Margin: 12.4% (+130 bps YoY)
PBT: ₹1,726 Cr
ROCE: 38.1%
Passenger Vehicles (PV & EV)
Revenue: ₹12,354 Cr (-4.3% YoY)
EBITDA Margin: 7.8% (+120 bps YoY)
PBT: ₹292 Cr
EV EBITDA Margin: 10.0%
EV Market Share: 35%
3. Future Growth Plans & Expansions
Capital Expenditure & Strategic Rationale
FY25 CAPEX Target: ₹3.8B (~₹32,000 Cr)
JLR Investment: £1B in Q3 FY25; £3.8B target for FY25
Tata Motors Domestic Investments: ₹2.0K Cr in Q3 FY25
Focus on Electrification & Digitalization
First electric Jaguar GT launch in late 2025
Expanding EV and hydrogen-powered commercial vehicle portfolio
Tata.ev charging network expansion
“Mileage Sarathi” AI for fleet fuel efficiency
Smart City Mobility with e-buses across major Indian cities
Demerger of Commercial & Passenger Businesses
Appointed Date: July 1, 2025
Effective Date: Expected in Oct-Dec 2025
Strategic Rationale: Enables focused capital allocation and growth in respective segments
Upside Potential: ~20-50% from current ₹697 price level
Investment Thesis
Strong growth momentum in JLR, CV, and EV segments
Aggressive deleveraging & improving cash flows
High ROE (49.4%) and ROCE (20.1%) indicate strong profitability
Well-positioned to benefit from EV & hydrogen adoption
Investment Recommendation
BUY with a 12-month target of ₹900+
6. Conclusion
Tata Motors continues its strong growth trajectory, backed by JLR’s record profitability, solid CV margins, and expanding EV adoption. The ongoing demerger and deleveraging will unlock further value for investors. However, global macroeconomic risks and regulatory headwinds must be monitored.
Disclaimer: This report is for informational purposes only and does not constitute financial advice. Investors should conduct their own due diligence before making any investment decisions.