Category: Infrastructure Developers & Operators

  • Larsen & Toubro Delivers Record-Breaking Q3 FY25 Performance: Strategic Investments Position Company for Long-Term Growth

    Executive Summary

    Larsen & Toubro Limited has posted exceptional results for Q3 FY25, achieving its highest-ever quarterly order inflow at ₹1,160 billion—representing a remarkable 53% year-on-year increase. The company’s order book has expanded by 20% to reach nearly ₹5.64 trillion, providing strong revenue visibility across its diversified business segments including Infrastructure, Energy Projects, and Hi-Tech Manufacturing. Despite challenging macroeconomic conditions, L&T has demonstrated solid execution capabilities while strategically positioning itself in high-growth sectors such as green energy, digital transformation, and semiconductor design.

    Q3 FY25 Results: Breaking Records

    Order Inflows & Book

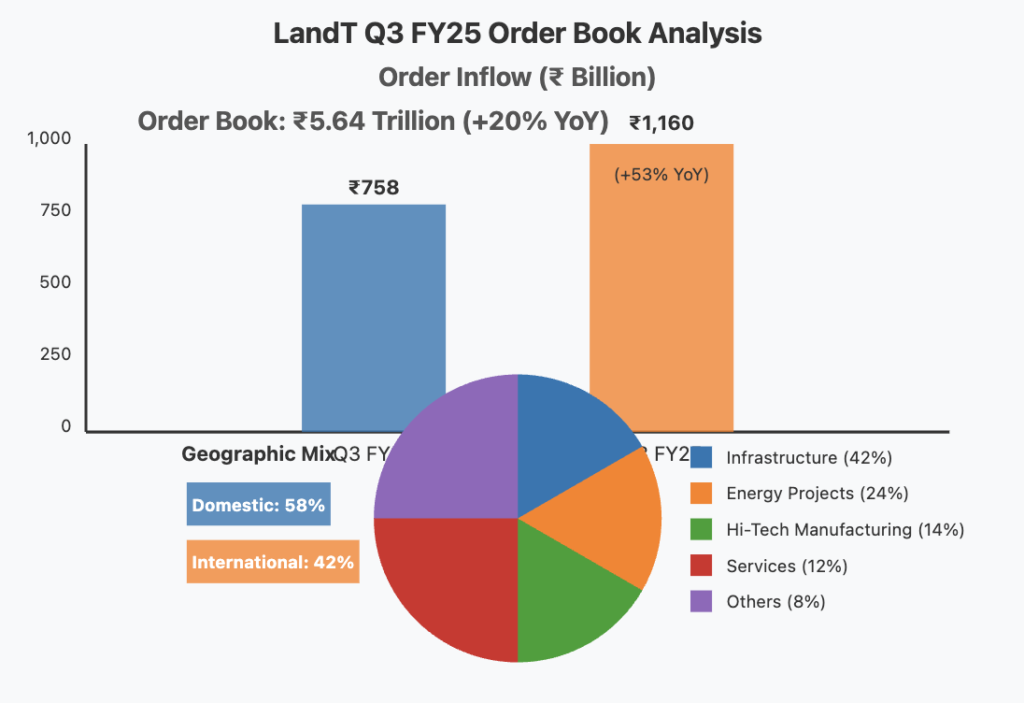
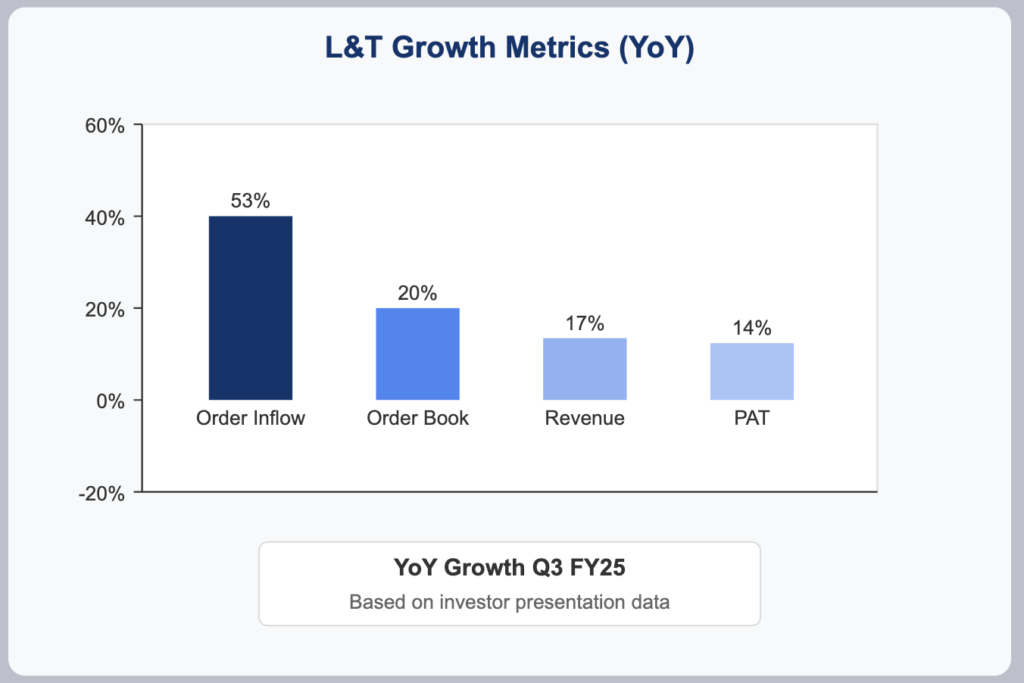
    • Q3 order inflows: ₹1,160 billion (53% YoY increase)
    • Order book: ₹5.64 trillion (20% YoY increase)
    • Geographic mix: 58% domestic, 42% international

    The substantial order growth was primarily driven by major contracts in Infrastructure, Hydrocarbon, CarbonLite Solutions, and Precision Engineering sectors, establishing a strong foundation for future revenue growth.

    Revenue & Profitability

    • Group revenues: ₹647 billion (17% YoY growth)
    • Consolidated PAT: ₹33.6 billion (14% YoY growth)
    • Projects & Manufacturing margins: Stable at 7.6%

    Improved treasury operations and timely project billing contributed significantly to the profit growth, while margin variations reflected differing revenue mix and operating leverage across segments.

    Segment Performance Analysis

    Infrastructure

    The Infrastructure segment maintained steady execution with balanced contribution from both domestic and international projects. The segment continues to be a cornerstone of L&T’s business portfolio, benefiting from increased infrastructure spending in India and Middle Eastern markets.

    Energy Projects

    This segment saw significant traction with ultra-super critical thermal power plant orders and a mega onshore hydrocarbon contract. While margins are still evolving as projects progress through various execution thresholds, the segment shows promising growth potential.

    Hi-Tech Manufacturing

    The segment maintained strong momentum with repeat orders, including the notable K9 Vajra repeat order, alongside several international deals that have strengthened the order book and diversified revenue streams.

    Key Financial Metrics

    • Market Cap: ₹4,69,753 Cr
    • Current Price: ₹3,416
    • P/E Ratio: 33.9
    • Dividend Yield: 0.82%
    • ROE: 14.7%
    • ROCE: 13.4%
    • Debt: ₹1,26,183 Cr
    • Reserves: ₹88,955 Cr

    Future Growth & Expansion Plans

    Strategic Initiatives & Investments

    Green Energy & Hydrogen

    L&T Energy Green Tech has secured a significant 90,000 MTPA green hydrogen capacity order, which comes with incentives potentially totaling around ₹300 crores over three years. This positions L&T advantageously in the rapidly growing green energy sector.

    Digital & IT Expansion

    The company’s IT subsidiaries, LTIMindtree and LTTS, have recorded their highest-ever deal wins, including the strategic acquisition of Silicon Valley-based Intelliswift for USD 110 million. These moves strengthen L&T’s capabilities in software product development, data analytics, and artificial intelligence.

    Capex Focus

    L&T continues to invest substantially in forward-looking sectors such as green energy, data centers, and semiconductor design. These investments are expected to begin contributing meaningfully to earnings in the next strategic cycle (FY27–FY31).

    Growth Strategy

    The company’s diversified order pipeline, comprising significant domestic and international opportunities, supports expectations for near-term revenue growth and margin improvement. Ongoing large contracts, particularly in the Projects & Manufacturing portfolio, are anticipated to drive sustained top-line expansion.

    L&T is also exploring new avenues in semiconductor design and digital transformation, with potential entry into additional value chains if initial ventures prove successful.

    Expense Analysis & CAPEX Insights

    Expense Trends

    • Manufacturing & Construction Costs: Increased due to higher activity levels and projects with longer execution timelines
    • Staff Costs: Rising in line with workforce expansion and regular salary increases
    • SG&A and Depreciation: Reflect ongoing execution ramp-up and recent capital investments

    CAPEX & Growth Strategy

    L&T is reinvesting a significant portion of its free cash flow to expand capacity in emerging sectors like green energy, digital infrastructure, and semiconductor design. This strategic allocation of capital aims to enhance earnings potential and competitive positioning over the FY27-FY31 cycle.

    Bull Case vs. Bear Case

    Bull Case

    • Continued robust order inflows driven by infrastructure spending in India and the Middle East
    • Successful execution of the existing ₹5.64 trillion order book leading to strong revenue growth
    • Strategic investments in green energy and digital transformation yielding higher margins
    • Expansion into high-growth sectors creating new revenue streams
    • Margin improvement through better project execution and operating leverage

    Bear Case

    • Project delays or cost overruns affecting margins
    • High P/E ratio of 33.9 suggesting elevated market expectations
    • Potential challenges in international markets due to geopolitical uncertainties
    • Competition intensifying in core segments
    • Working capital challenges if project execution or payment cycles lengthen

    Long-Term Projections

    5-Year Outlook

    • Revenue projected to grow at or above current guidance (15%+ annual growth)
    • Margin stabilization expected as execution of mega projects progresses
    • Efficiency gains anticipated from improved working capital management and reduced financing costs

    10- to 20-Year Outlook

    L&T’s strategic diversification into high-growth areas positions the company for long-term success. While precise numerical projections depend on macroeconomic variables, qualitative expectations include:

    • Sustained top-line expansion driven by infrastructure development in core markets
    • Incremental improvements in profitability as project execution enhances and digital/technology investments mature
    • Long-term total returns potentially attractive relative to current valuation

    Valuation & Credit Rating Considerations

    Valuation Metrics

    With a P/E of 33.9 and a book value of ₹649, L&T is positioned as a growth-oriented investment. The current valuation reflects high market expectations for future performance.

    Dividend History and Yield

    The company maintains a moderate dividend yield of 0.82%, typical for a capital-intensive conglomerate prioritizing reinvestment in growth opportunities.

    Credit Perspective

    No significant changes in credit agency ratings were reported during Q3 FY25. The company’s stable working capital improvements and balanced debt-reserve profile support a resilient credit outlook.

    Conclusion

    Larsen & Toubro’s Q3 FY25 performance demonstrates the company’s strong execution capabilities and strategic vision. The record-breaking order inflow, robust order book, and diversified revenue segments offer a compelling near-term outlook, while strategic investments in future-focused sectors establish the foundation for long-term growth.

    Investors should note the elevated valuation multiples and moderate dividend yield, which reflect market expectations for sustained growth. As L&T continues to execute its strategic plan and capitalize on emerging opportunities, it remains well-positioned to deliver value to shareholders over the long term.

    Disclaimer: This article is not investment advice and should not be taken as a recommendation to buy or sell securities. Investors should conduct their own due diligence and consider their financial objectives before making any investment decisions.

  • VPRPL Stock Analysis: India’s Top Infrastructure Play | Water Supply & Railway Projects Worth ₹5,086 Cr

    VPRPL Investment Analysis | Complete Infrastructure Sector Report

    Vishnu Prakash R Punglia Ltd. (VPRPL)

    Value Pick : Best share to buy from Infrastructure space

    Executive Summary

    Vishnu Prakash R Punglia Ltd. (VPRPL) is one of India’s fastest-growing infrastructure companies, specializing in government projects. The company has a diverse portfolio spanning water supply, railway infrastructure, and road construction. With a robust order book, strategic backward integration, and geographical expansion, VPRPL is poised for sustained growth.

    Key Metrics

    Market Cap

    ₹3,231 Cr

    Industry Avg: ₹3,000 Cr

    Current Price

    ₹259

    52-Week Range: ₹141 – ₹346

    P/E Ratio

    26.3

    Industry Avg: 28.0

    ROE

    23.6%

    Industry Avg: 21.0%

    Business Overview

    Core Operations

    Water Supply Projects

    Contributes ~60% of order book

    Recent projects worth ₹342 Cr including water storage and treatment facilities

    Railway Infrastructure

    Accounts for ~30% of new orders

    Includes bridges, platforms, and ancillary work

    Road Construction

    Contributes ~5% of revenue

    Strategic importance for future growth

    Geographical Presence

    Operating in 10+ Indian states, including Rajasthan, Maharashtra, and Goa

    Future Growth Drivers

    Strong Order Book

    • Total Orders: ₹5,086 Cr
    • New Orders in H1 FY25: ₹1,104 Cr
    • Average project duration: 36 months
    • Bidding Pipeline: ₹5,000 Cr

    Financial Performance

    Q2 FY25 Highlights

    Metric Value YoY Growth
    Revenue ₹335 Cr +13%
    EBITDA ₹49 Cr +27%
    PAT ₹24 Cr +12%

    H1 FY25 Performance

    Metric Value YoY Growth
    Revenue ₹591 Cr +3%
    EBITDA ₹82 Cr +16%
    PAT ₹39 Cr +2%

    Valuation Estimate

    Relative Valuation

    Metric VPRPL Industry Avg
    P/E Ratio 26.3 28.0
    P/B Ratio 4.25 4.5
    EV/EBITDA 11.5 12.0

    DCF Valuation

    Fair Value Estimate: ₹290 per share

    Potential Upside: ~12%

    Investment Thesis

    Strengths

    • Strong order book and high-margin segments focus
    • Effective cost management through backward integration
    • Strategic geographical expansion
    • Attractive valuation entry point

    Risk Factors

    • Delayed payments from state governments
    • Rising debt levels
    • Economic and weather-related disruptions

    Conclusion

    VPRPL’s growth trajectory, combined with prudent cost management and strategic expansions, makes it a solid choice for long-term investors. At a current price of ₹259, the stock offers a reasonable entry point with an estimated fair value of ₹290.

    Disclaimer: This report is for informational purposes only and does not constitute financial advice. Investors should perform their due diligence or consult with

  • EMS Ltd.: Unlocking India’s Wastewater Revolution with Strong Growth Potential

    EMS Ltd. Investment Analysis | Water Management Sector Leader Value Pick :

    EMS Ltd.

    Value Pick: Best Share to buy today

    Date: January 8, 2025

    Executive Summary

    EMS Ltd. is a leading player in the water and wastewater management sector in India. The company specializes in the design, construction, and operation of sewage treatment plants (STPs) and effluent treatment plants (ETPs), with a unique bundled approach that includes long-term Operations & Maintenance (O&M) contracts. EMS is well-positioned to benefit from government-led infrastructure development initiatives, such as the National Mission for Clean Ganga and AMRUT, aimed at improving urban infrastructure and sanitation.

    The company boasts robust financials, with superior operating margins (26.4%), a healthy return on equity (22.9%), and a strong balance sheet with low leverage. The recently secured ₹4,164.6 crore Indore Municipal Corporation project underscores EMS’s growing reputation and ability to execute large-scale municipal projects.

    1. Future Growth Drivers

    Robust Order Book Growth:

    EMS’s ₹4,164.6 crore order win, of which it holds a 26% share (~₹1,083 crore), strengthens its visibility over the next 3-5 years. The project includes STPs with capacities of 120 MLD, 40 MLD, and 35 MLD, supported by 15-year O&M contracts, ensuring recurring revenue.

    Government Push for Sanitation:

    India’s urbanization is expected to drive demand for wastewater infrastructure. EMS is aligned with flagship schemes such as AMRUT 2.0 and Swachh Bharat Mission 2.0, which aim to modernize municipal waste management systems.

    Over ₹60,000 crore has been earmarked for sewage and water infrastructure by the government in FY25, ensuring sustained sectoral tailwinds.

    Geographic Expansion:

    EMS is actively bidding for projects in tier-2 and tier-3 cities, leveraging its expertise in scalable solutions for mid-sized municipalities. This ensures a well-diversified order pipeline across India.

    2. Financial Analysis

    Key Metrics (FY24 Actuals)

    Market Cap

    ₹4,636 crore

    Current Price

    ₹834 per share

    52-Week Range

    ₹1,017 / ₹353

    Revenue

    ₹885 crore

    EBITDA Margin

    26.4%

    ROE

    22.9%

    ROCE

    29.3%

    Net Debt

    ₹78.6 crore

    Growth Metrics

    Sales Growth (YoY): 28.2%

    Profit Growth (YoY): 29.0%

    3-Year Revenue CAGR: 33.9%

    3-Year PAT CAGR: 27.1%

    Valuation Metrics

    Price-to-Earnings Ratio (P/E): 27.0x

    Price-to-Book Value (P/BV): 5.2x

    Enterprise Value/EBITDA: 14.7x (implied FY25E multiple)

    3. Strategic Use of Capital and CapEx

    • EMS has demonstrated prudent capital allocation, maintaining low leverage while funding growth.
    • Future capital expenditure will focus on technology upgrades and increasing project execution capabilities.
    • This includes automation in STP operations, improving margins and project efficiency.

    4. Competitive Landscape

    Company Market Cap (₹ Cr.) Revenue (₹ Cr.) EBITDA Margin ROE (%)
    EMS Ltd. 4,636 885 26.4% 22.9%
    VA Tech Wabag 4,250 3,200 12.5% 15.0%
    Ion Exchange 3,150 1,150 20.0% 18.5%

    EMS’s Edge:

    • Higher margins due to its bundled approach of O&M services.
    • Niche focus on medium-sized municipal projects, avoiding over-competition with large EPC players.

    5. Key Risks

    • Execution Delays: Government infrastructure projects often face delays due to regulatory hurdles, land acquisition issues, or funding gaps.
    • Payment Cycles: High dependency on public sector clients exposes EMS to risks of delayed payments, impacting working capital.
    • Economic and Political Risks: Any slowdown in public infrastructure spending or political instability could adversely affect order flows.

    6. Valuation Estimate and Recommendation

    DCF Valuation

    Based on a discounted cash flow (DCF) analysis, assuming a 15% revenue CAGR and stable margins:

    • Fair Value Estimate: ₹940-₹1,020 per share (implied FY26E EV/EBITDA of 12-15x)
    • Upside Potential: ~15-20% from the current price of ₹834

    Investment Thesis

    EMS Ltd. offers a compelling growth story in India’s under-penetrated wastewater management sector. With strong financials, a robust order book, and long-term O&M contracts, the company is well-placed to generate steady cash flows and deliver shareholder returns.

    Recommendation: BUY

    Recommended for a 12-18 month horizon.

    Disclaimer: This report is for informational purposes only and does not constitute investment advice. Investors should conduct their own due diligence or consult a financial advisor before making any investment decision. Past performance is not indicative of future results.

  • Value Pick: RVNL-Growth Projections, Capex Plans, and Investment Rationale for 2025

    RVNL Value Pick Best stock to buy today

    Rail Vikas Nigam Limited (RVNL)

    RVNL Value Pick Best stock to buy today

    Company Overview

    Rail Vikas Nigam Limited (RVNL) is a public sector enterprise under the Ministry of Railways, specializing in project implementation, planning, development, and execution of railway infrastructure projects. With a strong presence in India’s infrastructure growth story, RVNL remains a key player in railway modernization and expansion.

    Market Metrics

    Market Cap: ₹90,094 Cr

    Current Price: ₹432

    52-Week Range: ₹647 – ₹181

    Financial Ratios

    P/E: 70.4

    ROCE: 18.7%

    ROE: 20.4%

    Performance

    Sales: ₹20,310 Cr

    PAT: ₹1,280 Cr

    OPM: 5.66%

    Future Growth and Expansion Plans

    Management highlighted strategic focus areas, including new rail infrastructure projects, signaling and electrification initiatives, and international collaborations. RVNL plans a capex of approximately ₹7,000 Cr for FY25, focusing on high-speed rail corridors, station modernization, and green initiatives.

    SWOT Analysis

    Strengths

    • Strong government backing (72.8% holding)
    • Established project execution expertise
    • Robust order book

    Weaknesses

    • Recent decline in growth metrics
    • High P/E ratio (70.4)

    Opportunities

    • Metro and international market expansion
    • Government focus on rail projects
    • PPP model potential

    Threats

    • Rising private competition
    • Project execution delays
    • Government funding dependence

    Valuation and Projections

    Growth Projections

    Revenue CAGR (FY24-27): 15%

    PAT CAGR (FY24-27): 18%

    Target Price: ₹520

    Valuation Metrics

    EV/EBITDA: 25.8x

    P/B Ratio: 11.3x

    PEG Ratio: 3.9

    Disclaimer: This report is for informational purposes only and should not be considered as financial advice. Investors are advised to consult their financial advisors before making any investment decisions. The analysis is based on publicly available data and management commentary and may be subject to errors or omissions. Past performance is not indicative of future results.

  • WPIL Limited Growth Projections 2025: Insights into Future Performance

    WPIL Limited – Comprehensive Equity Research Report 2024 | Financial Analysis

    WPIL Limited Equity Research Report

    Comprehensive Financial Analysis and Market Insights

    Executive Summary

    WPIL Limited demonstrates robust financial performance with a market capitalization of ₹7,008 Cr and strong growth metrics across key performance indicators. This analysis provides in-depth insights into the company’s financial health, market position, and future growth prospects.

    Key Financial Metrics

    Market Cap

    ₹ 7,008 Cr

    Current Price

    ₹ 718

    52-Week High/Low

    ₹ 760 / 299

    Stock P/E Ratio

    35.6

    Book Value per Share

    ₹ 138

    Dividend Yield

    0.56%

    ROCE

    20.4%

    ROE

    46.2%

    Debt

    ₹ 403 Cr

    Reserves

    ₹ 1,340 Cr

    Recent Performance

    Q2 FY25 Highlights

    Revenue

    ₹ 491 Cr

    (+54% YoY)
    EBITDA

    ₹ 104 Cr

    (+57% YoY)
    EBITDA Margin

    21.3%

    PAT

    ₹ 70 Cr

    (+64% YoY)

    H1 FY25 Highlights

    Revenue

    ₹ 853 Cr

    (+33% YoY)
    EBITDA

    ₹ 165 Cr

    (+31% YoY)
    PAT

    ₹ 113 Cr

    (+36% YoY)
    PAT Margin

    13.3%

    Operational Highlights

    Order Book

    Domestic Projects

    ₹ 2,730 Cr

    International Projects

    ₹ 534 Cr

    Geographical Expansion

    • Strong growth in South Africa and Australia due to strategic acquisitions and investments
    • Enhanced presence in high-growth markets like MENA and Southeast Asia

    Future Growth and Projections

    Revenue Outlook

    • Analysts project a compound annual growth rate (CAGR) of 15-20% over the next three years
    • Domestic and international operations are expected to drive top-line growth, leveraging government-led initiatives

    Focus Areas

    • Increasing the contribution of high-margin product sales to enhance profitability
    • Targeting new acquisitions in North America and other strategic regions to expand market share

    Sector Opportunities

    • Infrastructure investments in water management and irrigation sectors provide a significant growth runway
    • Technological advancements and niche market focus strengthen WPIL’s competitive advantage

    Key Risks

    • Dependency on government projects introduces risks related to policy changes and payment delays
    • Volatility in commodity prices may impact margins

    Conclusion

    WPIL Limited demonstrates strong financial health, supported by a robust order book and strategic growth initiatives. The company is well-positioned to capitalize on domestic and international infrastructure growth, with consistent performance expected in the medium term.

    Data sources: Company filings, market research, and financial analysis

    Last updated:

  • GMR Power and Urban Infra (GPUIL): Strategic Infrastructure Growth, Renewable Energy

    BSE: 543490. NSE: GMRP&UI

    Equity Research Report: GMR Power and Urban Infra Limited (GPUIL)

    Comprehensive Analysis of Business Model and Strategic Positioning

    Company Overview and Strategic Context GMR Power and Urban Infra Limited (GPUIL) represents a dynamic infrastructure conglomerate navigating the complex intersection of energy transition, digital infrastructure, and sustainable development. The company’s multi-sectoral approach positions it uniquely in India’s rapidly evolving infrastructure landscape, with strategic investments across energy, transportation, and urban infrastructure domains.

    Key Financial Metrics

    Key Financial Metrics
    
    Metric                           Value
    -----------------------------------------------
    Market Capitalization            ₹8,324 Cr.
    Current Stock Price              ₹116
    52-Week High/Low                 ₹169 / ₹38.6
    Face Value                       ₹5.00
    Book Value                       ₹11.1
    Dividend Yield                   0.00%
    Dividend (Previous Annualized)   ₹0.00 Cr.
    Return on Capital Employed       11.4%
    Return on Equity (ROE)           N/A
    Debt                             ₹10,068 Cr.
    Reserves                         ₹434 Cr.
    Number of Equity Shares          71.5 Cr.
    Sales                            ₹5,733 Cr.
    Operating Profit Margin          26.3%
    Sales Growth (YoY)               24.0%
    Sales Growth (3 Years)           18.0%
    Profit Growth (YoY)              57.6%
    Profit Variation (3 Years)       18.1%
    Quarterly Sales Variation        121%
    Profit After Tax (Q2 FY25)       ₹-271 Cr.

    Detailed Sectoral Deep Dive

    1. Energy Portfolio: Transformation and Resilience

      • Thermal Assets:

        • Warora and Kamalanga plants demonstrate robust operational capabilities with PLFs of 67% and 78%, respectively.

        • Strategic maintenance activities, while temporarily impacting output, reflect long-term asset optimization strategies.

      • Renewable Energy Trajectory:

        • Current operational capacity of 29.4 MW (26 MW solar, 3.4 MW wind) represents an initial foothold in the renewable sector.

        • Significant growth potential evident through planned expansions and market trends favoring clean energy.

    2. Transportation Infrastructure: Growth Dynamics

      • Highways Segment:

        • 31.7% YoY traffic growth on Ambala-Chandigarh stretch indicates robust infrastructure utilization.

        • Potential for increased monetization through traffic-linked revenue models.

      • Urban Infrastructure Development:

        • Krishnagiri land sales and leases demonstrate alternative revenue generation strategies beyond traditional infrastructure models.

    3. Advanced Metering Infrastructure (AMI): Digital Transformation

      • Uttar Pradesh Smart Meter Project:

        • ₹75.9 billion contract represents a landmark digital infrastructure initiative.

        • 1.42 lakh meters installed, signaling steady project implementation.

        • Partnership with Bosch indicates technological credibility and scalability.

    Financial Performance Analysis

    Quarterly Highlights (Q2 FY25)

    • Revenue Dynamics:

      • Total income of ₹15.1 billion reflects 122% YoY growth

      • 13% QoQ decline attributed to strategic maintenance activities

    • Profitability Metrics:

      • EBITDA growth of 2.1x, with margin improvement to 35%

      • Net profit turnaround from ₹1.2 billion loss to ₹2.5 billion profit

    • Debt Management:

      • Significant ₹7.2 billion gross debt reduction

      • Demonstrates robust financial restructuring capabilities

    Strategic Financial Observations

    • Leverage Management: Gross debt of ₹10,068 Cr. remains a critical focus area

    • Operational Efficiency: 26.3% Operating Profit Margin indicates strong cost management

    • Growth Trajectory: 24% sales growth and 57.6% profit growth showcase strategic execution

    ESG and Sustainability: Beyond Compliance

    • Certifications (ISO 14001, ISO 50001) validate environmental commitment

    • “Zero waste to landfill” certification for Warora Plant

    • Community development initiatives benefiting 30,000+ individuals

    • Signals comprehensive approach to corporate social responsibility

    Investment Thesis

    Strengths

    • Diversified infrastructure portfolio

    • Strong ESG credentials

    • Strategic pivot towards renewable and digital infrastructure

    • Demonstrated operational turnaround capabilities

    Potential Challenges

    • High debt levels require continued deleveraging

    • Regulatory uncertainties in infrastructure projects

    • Exposure to energy demand volatilities

    Strategic Recommendations

    1. Renewable Energy Acceleration

      • Rapidly scale renewable portfolio

      • Explore hybrid energy models

      • Target commercial and industrial clients

    2. Digital Infrastructure Expansion

      • Leverage AMI project expertise

      • Develop EV charging ecosystem

      • Explore smart city technology integrations

    3. Financial Optimization

      • Continue debt reduction strategies

      • Improve asset utilization across thermal and renewable assets

      • Explore strategic partnerships for technology integration

    Valuation Perspective

    • Current market cap: ₹8,324 Cr.

    • Stock price volatility (52-week range: ₹38.6 – ₹169)

    • Limited traditional valuation metrics (NA for P/E, ROE)

    • Recommend valuation based on asset value, growth potential, and strategic positioning

    Conclusion GMR Power and Urban Infra Limited exhibits a compelling growth narrative driven by strategic diversification, technological innovation, and sustainable infrastructure development. The company’s ability to navigate complex sectoral transitions, coupled with its robust ESG framework, positions it as an attractive long-term investment opportunity.

    Risk Rating: Moderate to High Investment Outlook: Positive (Long-term) Recommended Action: Accumulate with a balanced, patient approach

    The enhanced report provides a more comprehensive, analytical perspective on GPUIL, offering investors deeper insights into the company’s strategic positioning, financial performance, and future potential.

    TradingView chart
Value Picks fin.ctoi.in
Value Picks

Dont Miss our Value picks

SUBSCRIBE TO OUR NEWSLETTER to Get short term, long term and multi-bagger

We don’t spam! Read our privacy policy for more info.