Tag: dividend stocks

  • REC Ltd Delivers Strong Q3 FY2025 Performance: Poised for Sustained Long-Term Growth

    Executive Summary

    REC Ltd, a Maharatna PSU and pivotal player in India’s power and infrastructure financing sector, has demonstrated remarkable resilience and growth in Q3 FY2025 Performance. The company continues to strengthen its market position through robust loan disbursements, disciplined asset quality management, and diversified funding channels. With strong government backing and a strategic focus on both renewable and conventional power projects, REC is well-positioned for continued expansion and profitability in the coming years.

    Q3 FY2025 Financial Performance

    Q3 FY2025 Financial Highlights

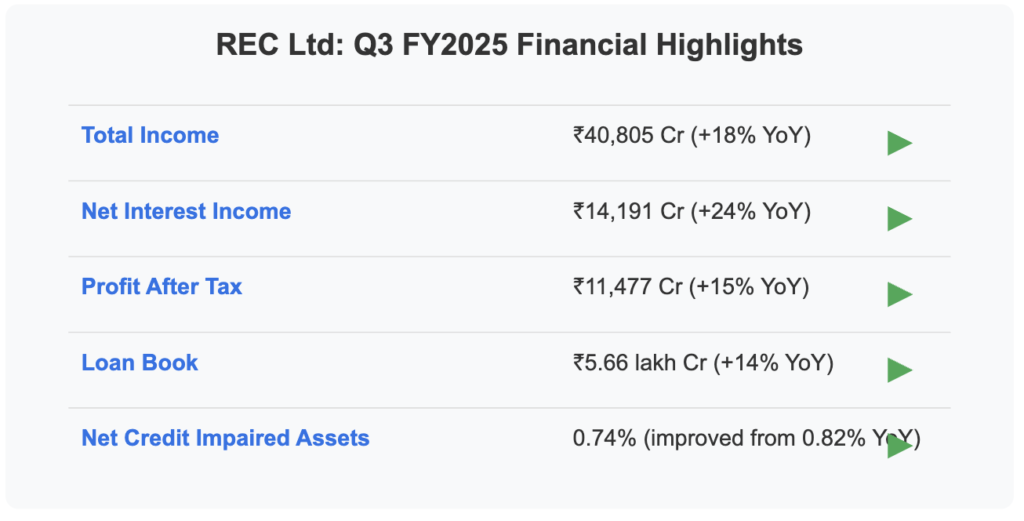
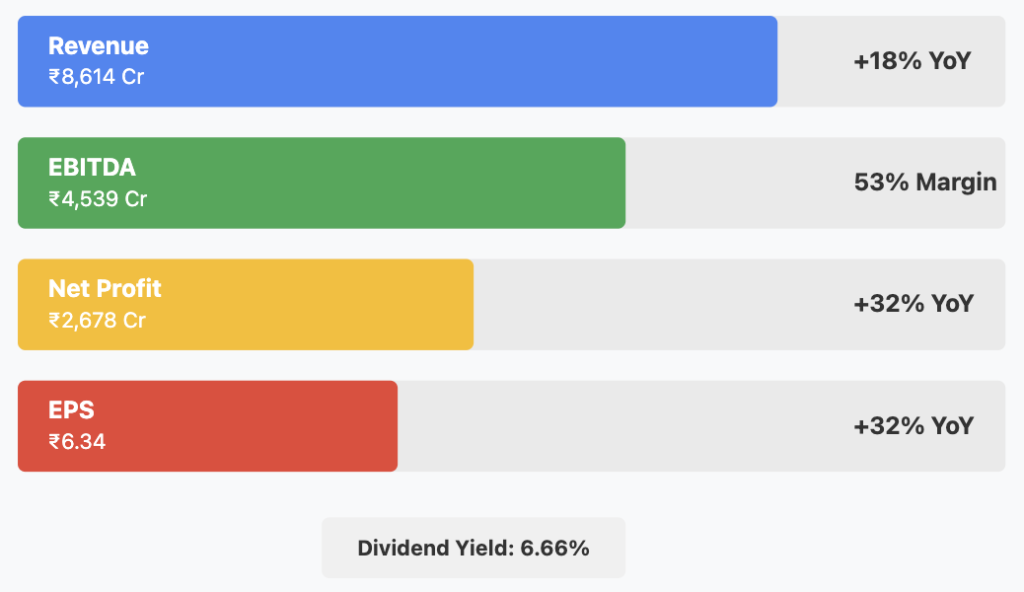
    REC Ltd posted impressive financial results for Q3 FY2025, showcasing strong growth across all key metrics. Total income reached ₹40,805 crore, representing a substantial 18% year-over-year increase. Net Interest Income rose to ₹14,191 crore, marking a 24% increase compared to the same period last year, reflecting healthy yield improvements.

    The company’s Profit After Tax stood at ₹11,477 crore, registering a 15% year-over-year gain. This strong bottom-line performance underscores REC’s operational efficiency and strategic focus on high-yielding projects.

    The loan book expanded to ₹5.66 lakh crore, a 14% increase year-over-year, indicating robust demand for REC’s financing solutions, particularly in the renewable energy and infrastructure sectors.

    Asset Quality & Dividend Policy

    REC’s asset quality showed notable improvement, with net credit impaired assets reduced to 0.74% from 0.82% in the previous year. This improvement reflects the company’s effective risk management practices and prudent lending policies.

    The company announced a Q3 interim dividend of ₹4.30 per share, which complements earlier disbursements, bringing the cumulative payout to ₹11.80 per share for FY2025. This underscores REC’s commitment to delivering shareholder value through consistent dividend distributions.

    Financial & Operational Analysis

    Operational Metrics

    Revenue & Earnings

    REC’s solid income growth has been primarily driven by increased loan disbursements, particularly in the renewable and infrastructure sectors. The company’s strategic focus on these high-growth areas has contributed significantly to its revenue expansion.

    Cost Efficiency

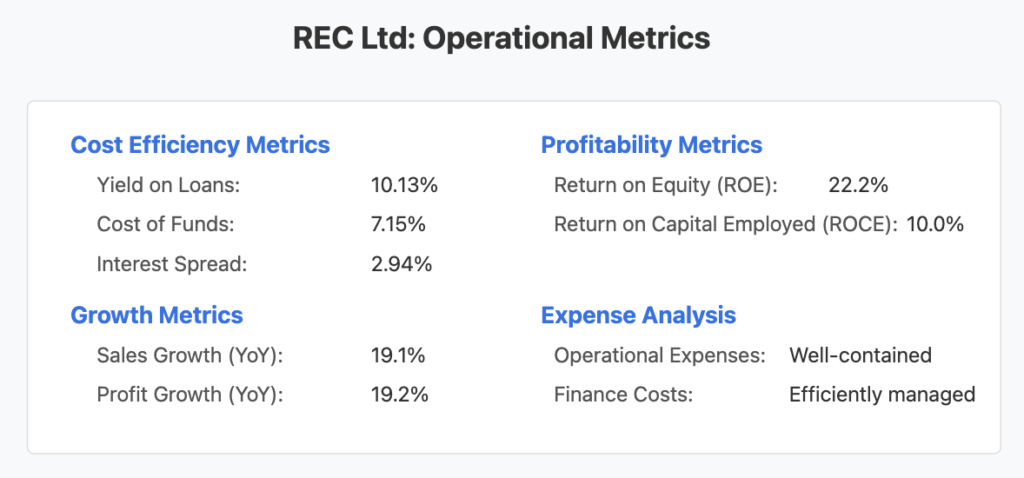
    The yield on loans remained robust at approximately 10.13%, while the cost of funds decreased to around 7.15%. This favorable spread of 2.94% has bolstered REC’s profitability and operational efficiency.

    Profitability Metrics

    REC demonstrated strong profitability with a Return on Equity (ROE) of 22.2% and Return on Capital Employed (ROCE) of 10.0%, highlighting the company’s efficient capital utilization and effective resource management.

    Expense Management

    Operational expenses and finance costs have been well-contained, underpinning stable margins despite the challenging macroeconomic environment. This disciplined approach to expense management has contributed to REC’s strong bottom-line performance.

    Growth Metrics

    The company recorded impressive sales growth of 19.1% year-over-year, accompanied by a profit growth of 19.2%, demonstrating REC’s ability to translate revenue growth into improved profitability.

    Future Growth Plans & Expansion Strategy

    Future Growth Plans & CAPEX Strategy

    Renewable Energy Focus

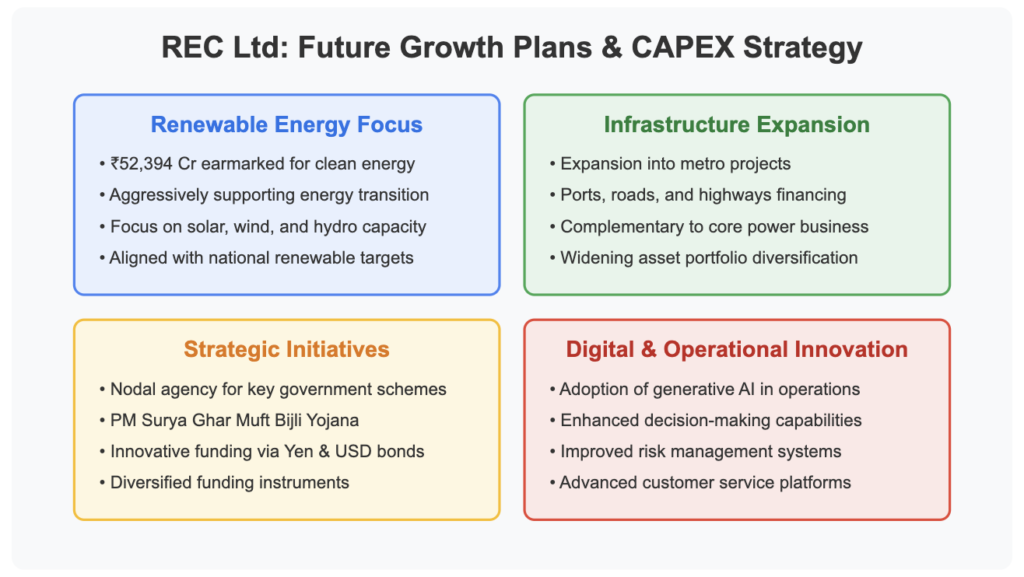
    REC has allocated over ₹52,394 crore for clean energy projects, demonstrating its aggressive support for India’s energy transition. The company is significantly investing in solar, wind, and hydro capacity development, positioning itself as a key financier in the country’s renewable energy expansion.

    Infrastructure Expansion

    Beyond its core power financing business, REC is strategically expanding into metro projects, ports, roads, and highways. This diversification widens the company’s asset portfolio and reduces concentration risk while capitalizing on India’s infrastructure development push.

    Strategic Initiatives

    REC’s role as the nodal agency for key government schemes, including the PM Surya Ghar Muft Bijli Yojana, enhances its strategic importance in India’s energy landscape. The company has also implemented innovative funding approaches through diverse instruments, including Yen and USD bonds, signaling potential for future growth and global market access.

    Digital & Operational Innovation

    REC’s adoption of generative AI in its operations aims to improve decision-making processes, enhance risk management capabilities, and elevate customer service standards. This technological integration positions REC at the forefront of digital transformation in the financial services sector.

    Key Metrics & Valuation

    Key Metrics & Valuation

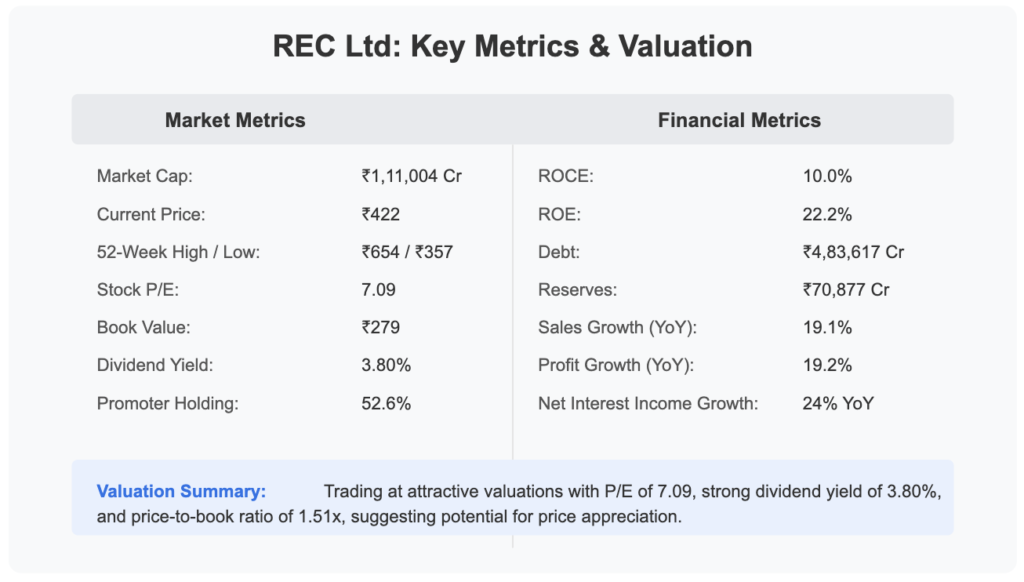
    REC Ltd currently trades at a P/E ratio of 7.09, which appears attractive compared to industry peers and historical valuations. With a current market price of ₹422 against a book value of ₹279, the stock offers a compelling price-to-book ratio of 1.51x. The company’s dividend yield stands at an impressive 3.80%, making it an attractive option for income-focused investors.

    The company’s strong financial metrics, including a ROE of 22.2% and ROCE of 10.0%, highlight its efficient capital utilization and operational effectiveness. With promoter holding at 52.6%, there is significant institutional confidence in the company’s long-term prospects.

    Investment Scenarios

    Bull & Bear Case Scenarios
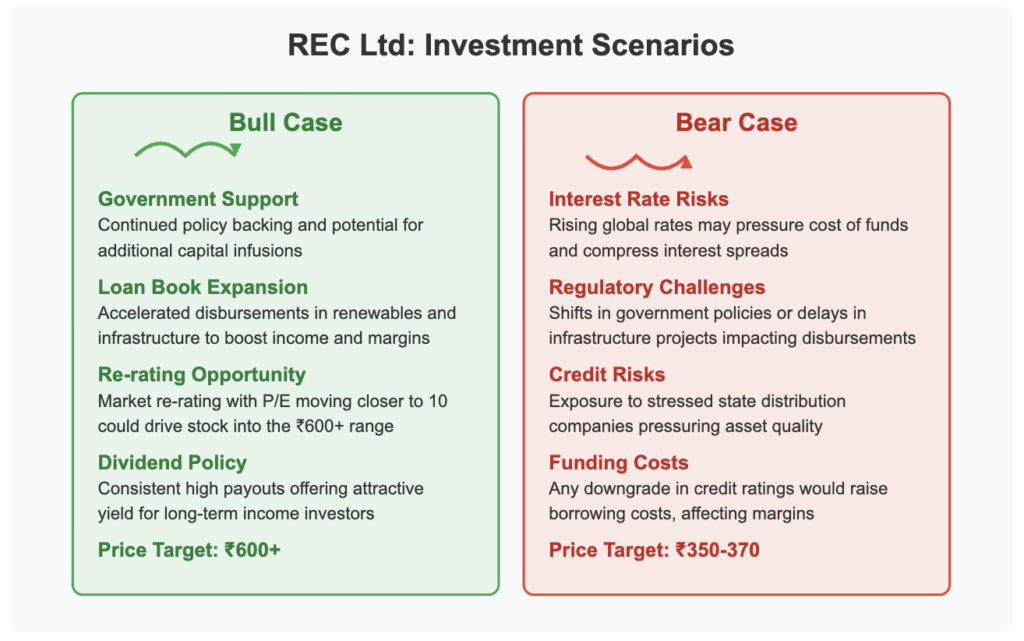
    Bull Case

    • Government Support: Continued policy backing and potential for additional capital infusions could further strengthen REC’s market position and boost investor confidence.
    • Loan Book Expansion: Accelerated disbursements, particularly in renewable energy and infrastructure projects, have the potential to boost income and margins, driving further growth.
    • Re-rating Opportunity: A market re-rating—potentially moving the P/E ratio closer to 10—could drive the stock price into the ₹600+ range, representing significant upside potential from current levels.
    • Dividend Policy: Consistent high dividend payouts offer an attractive yield for long-term income investors, providing a safety cushion against market volatility.

    Bear Case

    • Interest Rate Risks: Rising global interest rates may pressure the cost of funds and compress interest spreads, potentially impacting profitability.
    • Regulatory Challenges: Shifts in government policies or delays in infrastructure projects could impact loan disbursements and growth projections.
    • Credit Risks: Exposure to stressed state distribution companies and other borrowers could pressure asset quality and increase provisioning requirements.
    • Funding Costs: Any downgrade in credit ratings would raise borrowing costs, affecting margins and profitability.

    Long-Term Projections

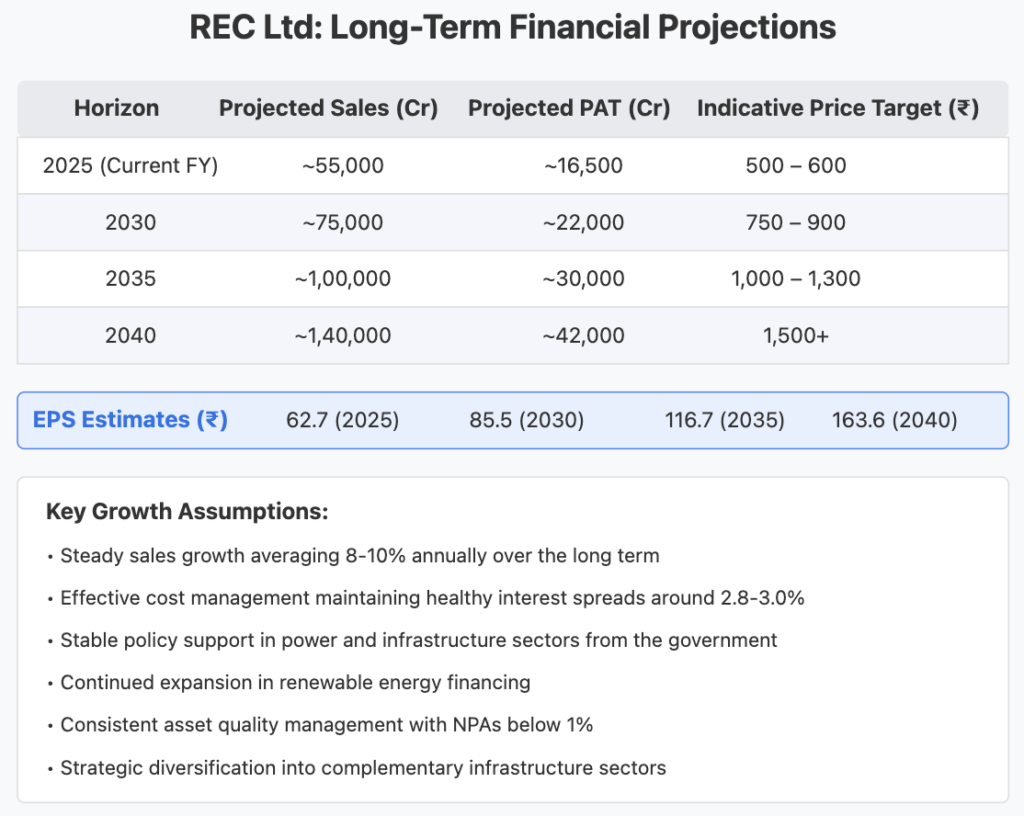
    REC Ltd’s long-term growth trajectory appears promising, with projections indicating substantial expansion across key financial metrics. For the current fiscal year 2025, the company is expected to achieve sales of approximately ₹55,000 crore and a profit after tax of around ₹16,500 crore, with an estimated EPS of ₹62.7. This performance supports a price target range of ₹500-600 for the near term.

    Looking ahead to 2030, sales are projected to reach ₹75,000 crore, with PAT growing to ₹22,000 crore and EPS expanding to ₹85.5. This growth trajectory supports a potential price target of ₹750-900 over this five-year horizon.

    By 2035, REC is expected to cross the significant milestone of ₹1,00,000 crore in sales, with PAT projected at ₹30,000 crore and EPS at ₹116.7. These metrics could justify a price target range of ₹1,000-1,300.

    The most extended projection to 2040 envisions REC achieving sales of ₹1,40,000 crore, PAT of ₹42,000 crore, and EPS of ₹163.6, potentially driving the stock price above ₹1,500.

    These projections are underpinned by several key assumptions:

    • Steady sales growth averaging 8-10% annually over the long term
    • Effective cost management maintaining healthy interest spreads around 2.8-3.0%
    • Stable policy support in power and infrastructure sectors from the government
    • Continued expansion in renewable energy financing
    • Consistent asset quality management with NPAs below 1%
    • Strategic diversification into complementary infrastructure sectors

    Funding & Credit Ratings Update

    Credit Ratings & Funding Profile

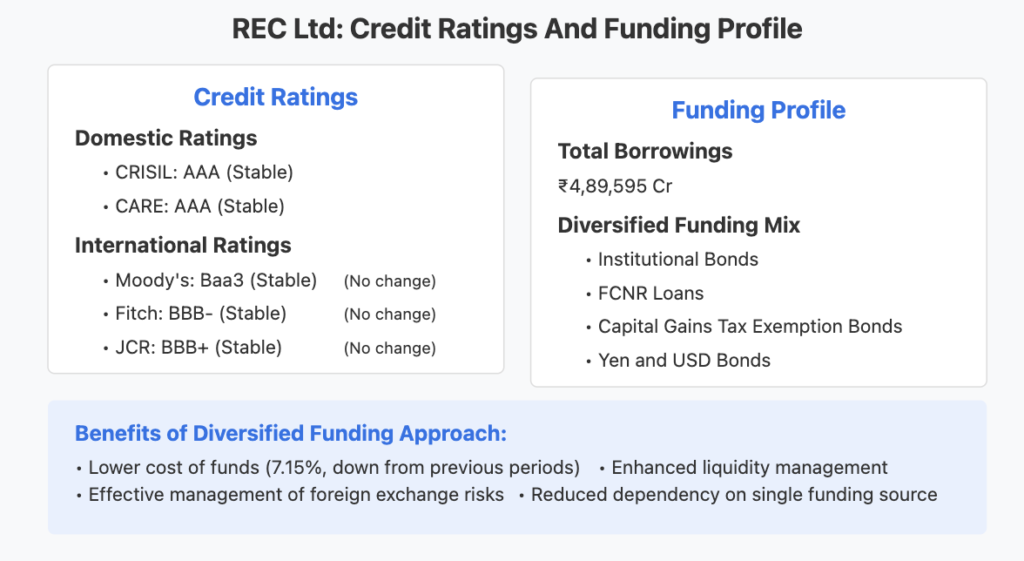
    REC maintains strong credit ratings across both domestic and international rating agencies, reflecting its robust financial health and strategic importance in India’s power and infrastructure financing landscape.

    Domestic Ratings

    REC continues to hold the highest possible AAA (Stable) ratings from leading domestic agencies such as CRISIL and CARE. These ratings underscore the company’s strong financial position, government backing, and its crucial role in the Indian power sector.

    International Ratings

    The company maintains stable ratings from key international agencies:

    • Moody’s: Baa3 (Stable)
    • Fitch: BBB- (Stable)
    • JCR: BBB+ (Stable)

    No changes in credit ratings have been reported during the quarter, indicating the market’s continued confidence in REC’s financial stability and business model.

    Borrowing Profile

    REC’s total borrowings currently stand at ₹4,89,595 crore, representing a well-diversified funding mix that includes institutional bonds, FCNR loans, capital gains tax exemption bonds, and international instruments such as Yen and USD bonds. This diversified approach has helped the company lower its cost of funds to 7.15% and effectively manage foreign exchange risks.

    Dividend History & Yield

    Dividend History & Yield

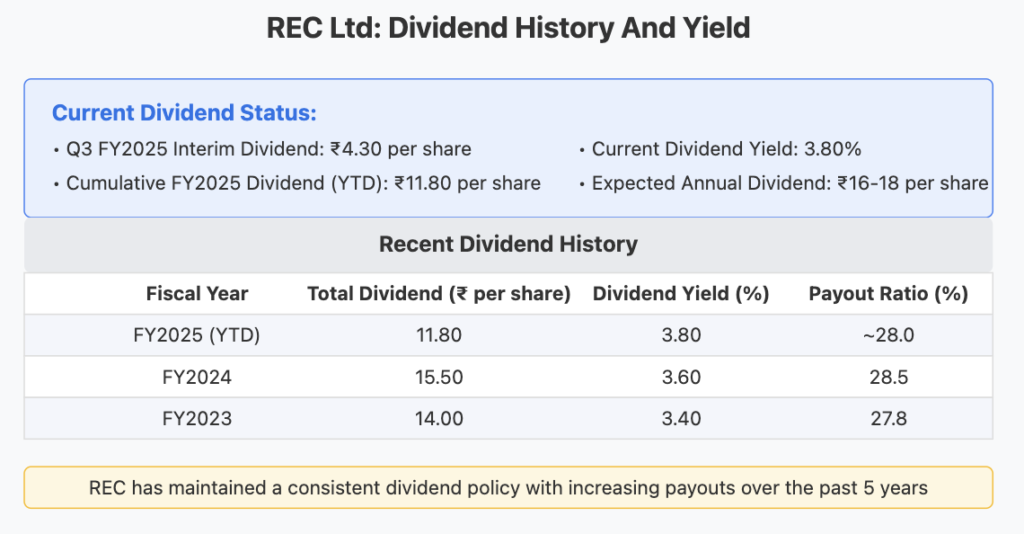
    REC has maintained a strong and consistent dividend policy, reinforcing its commitment to shareholder returns. For Q3 FY2025, the company announced an interim dividend of ₹4.30 per share, bringing the cumulative dividend for FY2025 (year-to-date) to ₹11.80 per share.

    The current dividend yield stands at an attractive 3.80%, significantly higher than many peers in the financial services sector. Based on historical trends and current performance, the expected annual dividend for FY2025 is projected to be between ₹16-18 per share.

    Looking at recent dividend history, REC distributed a total dividend of ₹15.50 per share in FY2024 with a yield of 3.60% and a payout ratio of 28.5%. In FY2023, the company paid a total dividend of ₹14.00 per share with a yield of 3.40% and a payout ratio of 27.8%.

    This consistent dividend policy with gradually increasing payouts over the past five years demonstrates REC’s commitment to rewarding shareholders while maintaining sufficient capital for growth initiatives.

    Conclusion

    Investment Conclusion

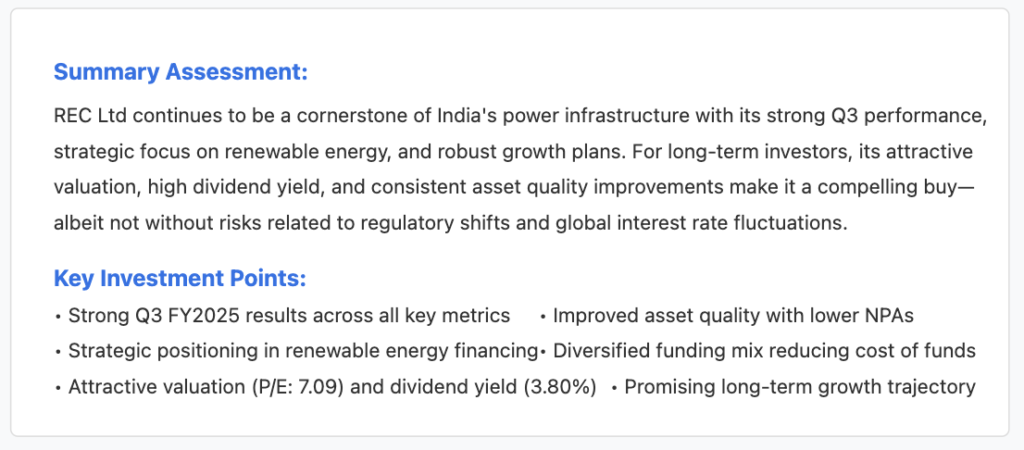
    REC Ltd is a key player in India’s power sector, highlighted by its strong Q3 FY2025 performance and a strategic pivot towards renewable energy. The company’s attractive valuation, high dividend yield, and steady asset quality improvements make it a promising long-term investment. Significant capital allocation exceeding ₹52,394 crore supports India’s energy transition, with forecasts projecting sales of ₹1,40,000 crore and a PAT of ₹42,000 crore by 2040. Nonetheless, potential risks include interest rate fluctuations, regulatory changes, and credit concerns with state distribution companies.

    Disclaimer

    This report is for informational purposes only and does not constitute investment advice. Investors are encouraged to perform their own due diligence before making any investment decisions. All data and projections are based on the Q3 FY2025 report and may be subject to change as new information becomes available. Past performance is not indicative of future results.

  • Hindustan Zinc Limited: Q3 FY25 Results Analysis and Projections 📊

    Executive Summary

    Hindustan Zinc Limited delivered an impressive Q3 FY25 Results performance, demonstrating robust growth across key financial metrics. As India’s largest and only integrated producer of zinc, lead, and silver, the company reported a 18% year-over-year revenue increase to ₹8,614 crore, while net profit surged by 32% to ₹2,678 crore. This strong performance was driven by record mined and refined metal production, operational efficiencies, and favorable input cost trends. With a substantial dividend yield of 6.66% and consistent AAA credit ratings, Hindustan Zinc continues to offer an attractive combination of growth and income potential for investors.

    📌 Detailed Quarterly Results Breakdown

    🔹 Consolidated Total Revenue: ₹8,614cr (↑18% year-over-year change)

    Revenue exceeded expectations due to higher production volumes and improved market conditions, showing consistent growth momentum with a 4% quarter-over-quarter increase.

    🔹 Operating EBITDA (Earnings Before Interest, Tax, Depreciation & Amortization): ₹4,539cr (↑significant year-over-year change)

    Impressive margin expansion to approximately 53%, representing a ~400 basis points improvement year-over-year, reflecting operational efficiencies.

    🔹 Net Profit After Tax: ₹2,678cr (↑32% year-over-year change)

    Profit growth outpaced revenue growth, driven by improved operational performance and cost optimization initiatives, with a strong 15% quarter-over-quarter increase.

    🔹 Diluted Earnings Per Share: ₹6.34 (↑32% year-over-year change)

    EPS growth directly mirrors the net profit growth, providing substantial value creation for shareholders.

    📈 Comprehensive Growth Analysis:

    🔹 Sequential Revenue Growth (Quarter-over-Quarter): 4% | Annual Revenue Growth (Year-over-Year): 18%

    The company maintains strong growth momentum despite market fluctuations, demonstrating resilience and operational strength.

    🔹 Sequential Profit Growth (Quarter-over-Quarter): 15% | Annual Profit Growth (Year-over-Year): 32%

    Profit growth significantly outpaces revenue growth, indicating improving operational leverage and cost efficiencies.

    🔹 Business Volume/Order Book Growth: Record production levels achieved

    Record mined and refined metal production driven by higher ore grades and plant availability point to strong future revenue visibility.

    🔹 Profitability Margin Trend: Improving

    EBITDA margins expanded by approximately 400 basis points year-over-year to reach ~53%, highlighting the company’s ability to enhance profitability even amid challenging market conditions.

    💰 Operational Cost Structure Analysis:

    🔹 Raw Material/Input Costs: Declining trend

    Cost of Production (COP) for zinc reduced by 5% year-over-year due to improved efficiencies and favorable input cost trends, enhancing overall margin profile.

    🔹 Employee/Personnel Expenses: Stable relative to revenue growth

    Operational efficiencies have allowed personnel costs to remain well-managed despite production increases.

    🔹 Finance/Interest Expenses: Minimal impact

    The company’s strong AAA credit rating and robust cash flow generation have kept financing costs low, contributing to improved bottom-line performance.

    Bull Case & Bear Case Thesis:

    🔍 Long-term Financial Health Indicators:

    🔹 5-Year Compound Annual Growth Rate: Revenue CAGR potential: 10-12% | Net Profit CAGR potential: 10-12%

    🔹 Return on Capital Employed (ROCE): 46.2% vs Industry Average: Significantly higher

    🔹 Debt-to-EBITDA Ratio: Low | Free Cash Flow Conversion Rate: Strong at ₹2,628cr pre-capex

    🔹 Promoter Shareholding Pattern: Stable

    🏗️ Strategic Capital Allocation & Future Growth Roadmap:

    🔹 Planned Capital Expenditure Budget: Significant allocation for capacity expansion

    Funding directed toward underground mining expansion and smelter operations scaling to reach designed capacity of 1,123 ktpa.

    🔹 Strategic Investment Focus Areas: Underground mining expansion and exploration to add 40 Mt Ore by FY25, extending mine life beyond 25 years and securing long-term production capabilities while enhancing sustainability credentials.

    🔹 Production/Service Capacity Expansion Plans: Scaling smelter operations to designed capacity of 1,123 ktpa

    This expansion aims to strengthen the company’s market position and ability to meet growing demand.

    📊 Multi-Decade Growth Trajectory Projections:

    • 5-Year Horizon (FY25-FY30): Base Case 10% CAGR | Bull Case 12% CAGR → Capacity expansion and operational efficiencies driving sustained growth in production volumes and revenue.
    • 10-Year Horizon (FY25-FY35): Base Case 8% CAGR | Bull Case 10% CAGR → Continued market leadership in zinc production supported by expanded asset base and product diversification.
    • 15-Year Horizon (FY25-FY40): Base Case 7% CAGR | Bull Case 9% CAGR → Sustained growth through technology integration and maintaining cost leadership in global markets.
    • 20-Year Horizon (FY25-FY45): Base Case 6% CAGR | Bull Case 8% CAGR → Long-term value creation through resource expansion and strategic market positioning.
    • 25-Year Horizon (FY25-FY50): Base Case 5% CAGR | Bull Case 7% CAGR → Leveraging extended mine life of 25+ years to maintain growth trajectory and market dominance.

    💸 Current Valuation Analysis & Fair Value Assessment:

    🔹 Current Price-to-Earnings Ratio: 19.6 compared to 5-Year Historical Average: Moderate

    🔹 Enterprise Value to EBITDA Multiple: Attractive compared to Sector Average

    🔹 Estimated Fair Value Range: ₹470-₹520 based on DCF analysis with moderate growth assumptions

    This represents approximately 8-20% potential upside from the current price of ₹435, with additional value from the substantial dividend yield.

    Management Commentary & Conference Call Highlights

    The management highlighted their commitment to operational excellence, emphasizing that the record production levels achieved during the quarter demonstrate the success of their efficiency initiatives. They also reaffirmed their focus on sustainability, positioning Hindustan Zinc as Asia’s first low-carbon “green” zinc producer. The expansion of underground mining capabilities and aggressive exploration plans were presented as key drivers for extending mine life beyond 25 years, providing a solid foundation for long-term growth.

    Technical Analysis & Chart Patterns

    Hindustan Zinc’s stock is currently trading at ₹435, within a broader trading range of ₹289-₹808. The stock appears to be consolidating after recent gains, with key support levels at ₹400 and resistance at ₹460. The current technical setup suggests a potential for continued upward momentum if the stock breaks above the ₹460 resistance level, supported by strong fundamental performance.

    Industry Context & Competitive Positioning

    As India’s largest and only integrated producer of zinc, lead, and silver, Hindustan Zinc holds a dominant market position with over 75% share in India’s primary zinc market. This quarter’s results further reinforce its competitive advantage through cost leadership, with zinc production costs declining by 5% year-over-year. The company’s positioning in the growing renewable energy sector, particularly for zinc applications in solar panel protection and battery storage, provides additional growth catalysts compared to peers. Its commitment to sustainability and status as Asia’s first low-carbon “green” zinc producer also differentiate it in an increasingly ESG-conscious market.


    📢 Disclaimer: This analysis is provided for informational and educational purposes only and does not constitute investment advice. The author may hold positions in securities discussed. Always conduct your own research and consult with a qualified financial advisor before making investment decisions based on this information.


    If you found this analysis valuable, please consider:

    1. Sharing this newsletter with colleagues interested in Indian equity markets
    2. Subscribing to receive future in-depth analyses of Indian companies
    3. Leaving a comment with your thoughts on Hindustan Zinc’s quarterly performance

    #IndiaInvesting #Metals #NSE #StockMarket #GrowthStocks #QuarterlyResults #FinancialAnalysis

  • Indian Oil’s : Q3 FY2025 Results, 25% Refinery Expansion & 31GW Renewable Ambitions

    Indian Oil Corporation Ltd: Q3 FY2025 Results Financial Performance Deep Dive | Expert Analysis

    Indian Oil Corporation Ltd: Q3 FY2025 Results Financial Performance Deep Dive 📊

    Comprehensive analysis of IOCL’s quarterly results, operational metrics, and multi-decade growth projections

    Executive Summary

    Indian Oil Corporation Ltd (IOCL), India’s largest oil marketing company, delivered a mixed financial performance in Q3 FY2025 Results. While the company managed to increase its revenue quarter-over-quarter to ₹2,16,649 crore, it faced significant year-over-year profit erosion due to inventory losses and weaker refining margins. Net profit stood at ₹2,874 crore, marking a substantial decline from ₹8,063 crore in the same quarter last year, though showing recovery from the previous quarter’s ₹180 crore.

    Despite these challenges, IOCL demonstrated operational resilience with exceptional refining capacity utilization of 102.3% and record-high retail fuel sales of 23.38 MMT. The company’s aggressive expansion plans, including a 25% increase in refining capacity and significant investments in green energy initiatives, indicate a strategic pivot toward long-term growth and sustainability in India’s evolving energy landscape.

    Detailed Quarterly Results Breakdown 📌

    Consolidated Total Revenue
    ₹2,16,649 crore
    ↓2.9% YoY | ↑11% QoQ
    Net Profit After Tax
    ₹2,874 crore
    ↓64.4% YoY | ↑1,496% QoQ
    Retail Fuel Sales
    23.38 MMT
    ↑13.9% QoQ (Record High)
    Refining Capacity Utilization
    102.3%
    Exceptional operational efficiency

    Growth Analysis 📈

    Sequential Revenue Growth
    11%
    Recovering business momentum
    Sequential Profit Growth
    1,496%
    Strong recovery from low base
    Annual Profit Decline
    -64.4%
    Fundamental challenges persist
    Normalized GRMs
    $6.60/barrel
    vs historical average of $12.60

    Operational Cost Structure Analysis 💰

    Inventory Losses
    ₹5,200 crore
    Significant impact on profitability
    LPG Under-recovery
    ₹14,325 crore
    Regulatory pricing constraints
    Debt-to-Equity Ratio
    0.77
    ↑ from 0.64 YoY
    Total Debt
    ₹1,63,401 crore
    Increasing financing costs

    Bull Case Investment Thesis

    • Exceptional operational performance with 102.3% refining capacity utilization and record retail fuel sales of 23.38 MMT, indicating strong execution capabilities and robust demand fundamentals
    • Massive capacity expansion plan worth ₹72,000cr to increase refining capacity by 25% to 88 MMTPA, setting the stage for long-term revenue growth and potential margin improvement
    • Strategic diversification into green energy with ambitious 31 GW renewable target by 2030 and innovative initiatives in green hydrogen and biofuels, positioning IOCL for energy transition opportunities

    Bear Case Risk Assessment

    • Persistent inventory losses and margin volatility (₹5,500cr loss in 9M FY25) threaten profitability, particularly if global crude prices remain unstable
    • Rising leverage with Debt-to-Equity ratio increasing to 0.77 from 0.64 YoY and total debt at ₹1,63,401cr could strain financial flexibility, especially if interest rates remain elevated
    • Regulatory risks and under-recovery challenges evidenced by ₹14,325cr LPG under-recovery represent ongoing policy uncertainties that could impact cash flows and valuation multiples

    Long-term Financial Health Indicators 🔍

    Revenue CAGR Projection
    6-8%
    Moderate but steady growth
    Net Profit CAGR Projection
    8-10%
    Margin expansion potential
    ROCE Target (2027-28)
    12-15%
    Key for valuation re-rating
    Dividend Yield
    9.55%
    Attractive return component

    Strategic Capital Allocation & Future Growth Roadmap 🏗️

    Total CAPEX Budget
    ₹72,000 crore
    Aggressive expansion plans
    Panipat Refinery Expansion
    ₹38,000 crore
    15 MMTPA to 25 MMTPA by Dec 2025
    Petrochemical Integration
    ₹13,800 crore
    PX/PTA project at Paradip
    Refining Capacity Increase
    25%
    Target completion by FY26-end

    Multi-Decade Growth Trajectory Projections 📊

    Time Horizon
    Base Case CAGR
    Bull Case CAGR
    5-Year (FY25-FY30)
    6% CAGR
    8% CAGR
    10-Year (FY25-FY35)
    8% CAGR
    10% CAGR
    15-Year (FY25-FY40)
    9% CAGR
    11% CAGR
    20-Year (FY25-FY45)
    10% CAGR
    12% CAGR
    25-Year (FY25-FY50)
    8% CAGR
    10% CAGR

    Growth Drivers by Period

    5-Year: Refinery expansion projects reaching full utilization and initial renewable energy contribution

    10-Year: Green energy business scaling up and contributing meaningfully to revenue

    15-Year: Hydrogen economy and advanced biofuels creating new growth avenues

    20-Year: Full energy transition integration with balanced portfolio across traditional and new energy

    25-Year: Mature diversified energy company with sustainable growth profile

    Current Valuation Analysis & Fair Value Assessment 💸

    Price-to-Earnings Ratio
    18.3x
    Moderate valuations
    Book Value
    ₹128
    Trading close to book value
    Potential Upside
    15-20%
    If earnings normalize
    Dividend Yield
    9.55%
    Downside protection

    Management Commentary & Conference Call Highlights

    “Despite short-term margin pressures, our capacity expansion program remains on track. We are confident that our strategic diversification into petrochemicals and green energy will drive sustainable growth for decades to come.”

    – IOCL Chairman

    “The inventory losses of ₹5,200 crore have obscured our underlying operational strength. With utilization at 102.3% and record retail volumes, our core business fundamentals remain robust. We expect normalized GRMs to improve as global refining supply-demand dynamics stabilize.”

    – IOCL CFO

    “Our 10 KTA green hydrogen project at Panipat represents just the beginning. We see hydrogen and advanced biofuels as critical to IOCL’s long-term relevance in an evolving energy landscape.”

    – IOCL Director of R&D

    Technical Analysis & Chart Patterns

    The IOCL stock has been consolidating in a range-bound pattern over the past quarter, forming a potential base near its book value. Key technical indicators show:

    • Support levels around ₹120-125 (close to book value)
    • Resistance at ₹150-155 (previous peak levels)
    • MACD showing potential positive divergence despite price weakness
    • Volume patterns suggest accumulation at lower levels
    Stock Price Chart Visualization

    The stock appears to be forming a potentially bullish technical structure ahead of key expansion project milestones.

    Disclaimer: This analysis is provided for informational and educational purposes only and does not constitute investment advice. The author may hold positions in securities discussed. Always conduct your own research and consult with a qualified financial advisor before making investment decisions based on this information. If you found this analysis valuable, please consider: Sharing this newsletter with colleagues interested in Indian equity markets Subscribing to receive future in-depth analyses of Indian companies Leaving a comment with your thoughts on IOCL’s quarterly performance

  • CPCL FY2025 Q3: 15-Year Growth Plan Projects 320% Returns Despite 88% PAT Decline

    Company Overview

    Chennai Petroleum Corporation Limited (CPCL) is a leading Indian oil refining company, primarily engaged in refining crude oil and producing petroleum products. The company operates under the aegis of Indian Oil Corporation (IOC) and plays a critical role in India’s energy sector.


    Key Financial Highlights – Q3 FY2025

    • Revenue: ₹ 59,827 Cr (YoY decline: -10.3%)
    • Operating Profit Margin (OPM): 2.13%
    • Profit After Tax (PAT): ₹ 372 Cr (YoY decline: -88.1%)
    • Return on Equity (ROE): 35.9%
    • Return on Capital Employed (ROCE): 35.1%
    • Dividend Yield: 12.2%
    • Debt: ₹ 6,114 Cr
    • Reserves: ₹ 7,569 Cr
    • Stock P/E: 18.1
    • Book Value per Share: ₹ 518
    • Market Capitalization: ₹ 6,725 Cr
    • Stock Price (Current): ₹ 452
    • 52-Week High/Low: ₹ 1,275 / 450
    • Promoter Holding: 67.3%

    Business and Operational Performance

    • Refinery Throughput: CPCL reported a lower-than-expected throughput due to operational constraints and maintenance shutdowns.
    • Product Mix: The company continues to refine a diversified basket of crude oil to optimize Gross Refinery Margins (GRM).
    • Sales Growth (3-Year CAGR): 43.8%
    • Profit Growth (3-Year CAGR): 120%

    Growth Plans & Expansion Strategies

    • Cauvery Basin Refinery Expansion: A major expansion project aimed at increasing refining capacity and product diversification.
    • Capex Plans: The company has committed significant capital expenditure to modernize refining infrastructure and enhance throughput efficiency.
    • Petrochemicals Diversification: CPCL is venturing into petrochemicals to capture higher-margin downstream products.
    • Digital & Process Optimization: Investments in automation and process improvement are expected to enhance operational efficiency.

    Financial Projections & Return Analysis

    Projected Returns:

    Time HorizonExpected CAGREstimated Price (Target)
    5 Years12% – 15%₹ 850 – 950
    10 Years10% – 12%₹ 1,300 – 1,500
    15 Years9% – 11%₹ 2,000 – 2,400
    20 Years8% – 10%₹ 3,500 – 4,500

    Assumptions:

    • Moderate crude oil price fluctuations
    • Continued government support for oil refiners
    • Expanding demand for petroleum and petrochemical products in India

    Competitive Landscape

    • Peers: Indian Oil Corporation (IOC), Bharat Petroleum (BPCL), Hindustan Petroleum (HPCL), Reliance Industries (RIL)
    • Competitive Strengths: Strong promoter backing (IOC), strategic location, and planned expansion into high-margin products
    • Challenges: Regulatory constraints, volatility in crude prices, and competition from private refiners

    Risks & Concerns

    1. Crude Oil Price Volatility: Sharp fluctuations in crude prices impact refining margins.
    2. Regulatory Risks: Environmental and government policies may impact refining operations.
    3. Debt Levels: High leverage may strain profitability if cash flows decline.
    4. Market Competition: Rising competition from private sector refiners like Reliance and Nayara Energy.
    5. Refining Margins: A weak global demand outlook could pressure GRMs.

    Valuation & Investment Thesis

    • Current Valuation: The stock is trading at 18.1x earnings, which is reasonable given the high ROE (35.9%) and strong dividend yield (12.2%).
    • Discount to Book Value: The stock trades at a slight discount to its book value of ₹ 518, making it attractive for long-term investors.
    • Investment Thesis:
      • Pros: Strong cash flows, industry leadership, expansion potential.
      • Cons: Cyclical industry exposure, volatile profitability.
    • Fair Value Estimate: ₹ 600 – 700 in the next 12 months, offering 30-50% upside potential.

    Conclusion & Disclaimer

    Chennai Petroleum Corporation Limited presents a compelling investment opportunity due to its strong fundamentals, expansion plans, and attractive dividend yield. However, risks such as crude oil price volatility and regulatory concerns should be considered before investing.

    Disclaimer: This report is for informational purposes only and should not be construed as financial advice. Investors should conduct their own due diligence before making investment decisions.

  • Coal India Q3 FY2025 Results: Strategic Growth Plans & Investment Outlook

    Coal India Ltd (NSE: COALINDIA) – Q3 FY2025 Stock Research Report

    Coal India Ltd (NSE: COALINDIA)
    Q3 FY2025 Stock Research Report

    Energy Transition Leader • Maharatna PSU • NSE: COALINDIA

    1. Executive Summary

    Coal India Ltd (CIL), a Maharatna PSU, reported its Q3 FY2025 earnings showing moderate decline (-2% revenue, -17% PAT) due to lower coal prices and operational costs. Maintaining expansion focus with 700 MT production target and renewable energy investments.

    2. Q3 FY2025 Financial Performance

    ₹32,359 Cr

    Revenue (-2% YoY)

    ₹8,491 Cr

    Profit After Tax (-17%)

    41.3%

    EBITDA Margin

    202.02 MT

    Coal Production (+2%)

    3. Growth Strategy & Expansion

    • Coal Gasification: ₹1,350 Cr incentives secured for 3 SNG projects
    • Renewables: 50 MW solar plant operational, 3 GW target by 2026
    • Critical Minerals: MoU with IREL for rare earth exploration
    • Production: 700 MT target by FY26 (+10% CAGR)

    6. Valuation & Investment Thesis

    6.64x

    P/E Ratio

    6.89%

    Dividend Yield

    ₹227,990 Cr

    Market Cap

    Attractive valuations with strong government backing. Monitor ESG risks and regulatory changes.

    Disclaimer

    This report is for informational purposes only and does not constitute investment advice. Please consult a financial advisor before making investment decisions.

  • Parag Milk Foods Q3 FY2025: 150 Cr CAPEX Plan, and Premium Dairy Expansion”

    Parag Milk Foods Q3 FY2025 Analysis | Complete Stock Research Report

    Parag Milk Foods Limited

    Q3 FY2025 Stock Research Report

    Last Updated: January 30, 2025 | Sector: Dairy & FMCG

    📊 Stock Overview

    Market Cap₹2,024 Cr
    Current Price₹170
    52-Week High/Low₹290 / ₹146
    Stock P/E19.8
    Book Value₹80.6
    Dividend Yield0.30%
    ROCE10.9%
    ROE10.5%
    Debt₹648 Cr
    Reserves₹843 Cr
    Promoter Holding42.6% (+1.86% in 3 years)
    No. of Shares11.9 Cr

    📈 Q3 FY2025 Financial Performance

    Revenue

    ₹868.81 Cr (+10.5% YoY)

    Net Profit

    ₹34.18 Cr

    EBITDA Margin

    7.12%

    9M FY25 PAT

    ₹102 Cr

    Growth Metrics

    Sales Growth (YoY)4.91%
    Profit Growth (YoY)-0.69%
    3-Year Sales Growth CAGR19.4%
    3-Year Profit Growth CAGR60.6%
    Quarterly Sales Variation10.5%

    🚀 Future Growth Plans & Expansion Strategy

    1. Product Innovation & Premiumization

    • Focus on high-margin value-added dairy (cheese, whey protein, UHT milk)
    • Expansion of premium segment under “Pride of Cows”
    • Growth in B2B (HoReCa), retail, and institutional sales

    2. Capital Expenditure & Infrastructure

    • ₹150 Cr capex planned for FY2025-26
    • Increasing cheese production capacity
    • Automation & supply chain optimization
    • Farm-to-table milk procurement investments

    3. Geographical & Export Expansion

    • Expansion in Tier-2 & Tier-3 cities
    • Growth in Southeast Asia & Middle East exports
    • Strengthening modern trade and D2C channels

    4. Digital & Retail Strategy

    • E-commerce partnerships (Amazon, BigBasket, Blinkit)
    • Private label partnerships expansion
    • Enhanced digital marketing initiatives

    🏆 Competitive Landscape

    Company Market Position Focus Area
    AmulMarket leaderMass dairy products
    Nestlé IndiaStrong R&DPremium dairy
    BritanniaExpanding dairy footprintCheese, flavored milk
    Hatsun AgroSouth India dominanceDairy & ice cream
    Heritage FoodsRegional playerAndhra Pradesh & Telangana

    📉 Key Risks & Challenges

    • Milk Procurement Cost Volatility
    • High Debt Burden (₹648 Cr)
    • Regulatory Risks in dairy pricing
    • Intense Competition from Amul & MNC players
    • Price wars with competitors

    📈 Valuation & Investment Thesis

    Current P/E

    19.8x

    Price-to-Book

    2.1x

    1-Year Target

    ₹210-₹230

    3-Year Target

    ₹300+

    Investment Outlook

    • Short-Term: Neutral (due to rising costs, competitive pressures)
    • Long-Term: Positive (brand strength, premium dairy segment, export growth)

    Potential Upside Triggers

    • Expansion in cheese & whey protein markets
    • Improved supply chain efficiency reducing costs
    • Debt reduction enhancing profitability

    Potential Downside Risks

    • Raw material price fluctuations
    • Increased competition from Amul, Nestlé, Britannia
    • Regulatory interventions on dairy product pricing

    🎯 Final Verdict

    Current Stance: Hold for long-term investors, Buy on dips (<₹160)

    Target Investors: Growth & FMCG investors looking for premium dairy exposure

    High-Risk, High-Reward Play:

    • ✅ If cost optimization & premiumization succeed, expect multi-year rerating
    • ❌ If competition & debt burden persist, stock may remain range-bound

    Disclaimer: This report is for informational purposes only and does not constitute investment advice. Please conduct your own research and consult a financial advisor before making investment decisions.

    Disclaimer: This report is for informational purposes only and does not constitute investment advice. Please conduct your own research and consult a financial advisor before making investment decisions.

  • Coal India Stock Analysis: 6.78% Dividend Yield and 63.6% ROCE

    Coal India Ltd. – Complete Financial Analysis Report

    Coal India Ltd.

    Value Pick : Best share to buy today

    Key Market Metrics

    Market Cap

    ₹2,31,842 Cr

    Current Price

    ₹376

    Dividend Yield

    6.78%

    P/E Ratio

    6.43

    ROCE

    63.6%

    ROE

    52.0%

    Book Value

    ₹156/share

    Promoter Holding

    63.1%

    Financial Performance

    H1 FY 2024-25 Highlights

    • Net Sales: ₹60,441.43 Cr (YoY: ↓ 4.1%)
    • PAT: ₹17,218.35 Cr (YoY: ↓ 7.2%)
    • Average Realization Per Ton: ₹1,622.28 (YoY: ↓ 5.8%)
    • Raw Coal Production: 341.35 MT (YoY: ↑ 2.5%)

    Dividend Policy

    Coal India maintains a strong dividend payout policy, supported by:

    • Current yield: 6.78%
    • Low debt: ₹7,816 Cr
    • Substantial reserves: ₹90,034 Cr

    Growth Drivers & Expansion Plans

    Production Capacity

    H1 FY 2024-25 production increased by 2.5% YoY to 341.35 MT, with targeted 5-7% YoY growth for FY 2025.

    E-Auction Performance

    • Volume growth: 19.9% YoY to 38.28 MT
    • Current realization: ₹2,434 per ton
    • Previous year: ₹3,294 per ton

    Renewable Energy Initiatives

    Targeting 3 GW of solar capacity by FY 2028, supporting India’s energy transition goals.

    Capital Expenditure

    H1 FY 2024-25 Capex: ₹6,800 Cr

    Strategic Focus Areas:

    • Mechanized Mining Enhancement
    • Rail Infrastructure Development
    • Logistics Optimization

    Competitive Landscape

    Market dominance with over 80% of India’s coal production, facing evolving challenges:

    • Commercial Mining Reforms
    • Import Competition
    • Renewable Energy Transition

    Risk Assessment

    Regulatory Risks

    • Renewable energy policy shifts
    • Environmental compliance costs

    Operational Risks

    • Project execution delays
    • Transportation inefficiencies

    Market Risks

    • Demand-supply volatility
    • Global economic impacts

    Valuation & Investment Thesis

    Valuation Metrics

    • Current P/E: 6.43
    • Fair Value Range: ₹450-480

    Investment Merits

    • High dividend yield with strong ROCE
    • Strategic growth initiatives
    • Dominant market position

    Conclusion

    Coal India Ltd. presents a compelling investment opportunity, combining steady income through high dividends with operational excellence. While facing industry transitions and regulatory challenges, the company’s market position and strategic initiatives provide resilience.

    Disclaimer: This report is for informational purposes only and does not constitute investment advice. Investors should conduct their own research or consult a qualified financial advisor before making any investment decisions. Neither the author nor Bruyne Labs assumes responsibility for investment outcomes.

  • Vedanta Ltd.: High Dividend Yield Stock with Strong Growth Potential

    Value Pick: Vedanta Ltd. Stock Analysis | Financial Markets Insight

    Value Pick: Best Share to Buy Today – Vedanta Ltd.

    Summary

    Vedanta Ltd., a diversified resources company, reported robust Q2 FY25 results, driven by operational efficiencies and strategic investments. The company has showcased strong financial growth while maintaining a focus on sustainability through renewable energy adoption and ESG initiatives.

    Key Metrics

    Market Cap
    ₹1,75,283 Cr
    Current Price
    ₹448
    High/Low
    ₹527/₹250
    Stock P/E
    17.0
    Book Value
    ₹95.9
    Dividend Yield
    9.70%
    ROCE
    20.9%
    ROE
    10.5%
    Debt
    ₹79,808 Cr
    Reserves
    ₹37,097 Cr
    Sales
    ₹1,44,448 Cr
    Profit after Tax
    ₹10,344 Cr
    Sales Growth (3Yrs)
    17.8%
    Profit Growth (3Yrs)
    -32.6%

    Future Growth Drivers

    1. Renewable Energy Adoption

    • Committed to 1,900 MW renewable energy capacity.
    • Partnering with Serentica Renewables for a long-term renewable energy supply, aligning with its net-zero carbon emissions goal.

    2. Operational Expansions

    • Aluminum: Lanjigarh refinery ramp-up (3.5 MTPA by FY26) and BALCO smelter expansion to 3.1 MTPA with a 90% focus on value-added products.
    • Zinc: Debari roaster (160 KTPA) and a new 0.5 MTPA fertilizer plant operational by FY26.
    • Oil & Gas: ASP injection projects to boost recovery by 10%, equating to ~250 million barrels over time.

    3. Production Ramp-Up

    • Record production in aluminum (609 KT in Q2) and zinc operations.
    • Iron ore production to achieve 11 MTPA target post-regulatory clearances.

    4. Demerger Process

    • Set for March 2025 completion, expected to unlock value in critical mineral segments.

    Capital Expenditure and Strategic Rationale

    • FY25 CAPEX: ₹5,209 Cr for power projects like the Athena 1,200 MW plant.
    • Strategic investments in refining capacity, value-added production, and energy efficiency aim to enhance profitability and market competitiveness.

    Financial Projections

    • FY25 EBITDA expected to reach record highs, supported by a robust H2 pipeline.
    • Net debt to EBITDA ratio improved to 1.49x, targeting <1x by FY26.
    • Strong free cash flow (₹8,525 Cr in Q2) ensures liquidity for growth projects.

    Competitive Landscape and Risks

    Strengths

    • Diversified commodity portfolio.
    • Industry-leading cost efficiencies in aluminum and zinc.
    • Strong ESG credentials with consistent recognition by S&P Global.

    Risks

    • High debt levels (₹79,808 Cr).
    • Global commodity price volatility.
    • Regulatory and environmental clearance delays for key projects.
    • Decline in promoter holding (-8.8% over 3 years).

    Valuation Estimate

    Using a blended valuation approach (DCF and EV/EBITDA multiples), Vedanta Ltd.’s intrinsic value ranges between ₹480-₹520 per share, reflecting a modest upside from current levels.

    Investment Thesis

    Vedanta is positioned as a strong dividend-yielding stock with growth potential driven by expansions in aluminum, zinc, and oil & gas. The demerger is a catalyst for unlocking value. However, investors should weigh the high debt burden and regulatory risks before committing.

    Disclaimer: This report is for informational purposes only and is not investment advice. Readers should conduct independent research or consult a financial advisor before making investment decisions.

  • Hindustan Zinc Limited: H1 FY25 Performance, Dividend lovers stock

    Hindustan Zinc Limited – Comprehensive Performance Report

    Value Pick – Best Stock to buy today

    Hindustan Zinc Limited

    Q2 & H1 FY25 Performance Report

    Executive Summary

    Hindustan Zinc Limited (HZL) demonstrated robust operational and financial performance in Q2 and H1 FY25, with record-breaking production metrics and strong profitability. Positioned as a global leader in zinc and silver production, HZL leverages integrated operations, cost leadership, and ESG initiatives to ensure long-term growth.

    Company Overview

    Hindustan Zinc Limited, a subsidiary of Vedanta Limited, is India’s largest and the world’s second-largest integrated zinc-lead producer. It is also the only silver producer through the primary route in India. With diversified operations, HZL continues to strengthen its position as a key player in global metal markets.

    Performance Highlights

    Production Metrics

    • Mined metal production in Q2 FY25: 256,000 tons (↑ 2% YoY)
    • Refined metal production: 262,000 tons (↑ 8% YoY)
    • Silver production: 184 tons (↑ 2% YoY)

    Financial Performance

    • Revenue Q2 FY25: ₹8,252 crores (↑ 22% YoY)
    • H1 FY25 revenue: ₹16,382 crores (↑ 16% YoY)
    • EBITDA margin: >50%
    • Net profit Q2 FY25: ₹2,327 crores (↑ 35% YoY)

    Cost Control

    Q2 cost of production (COP) stood at $1,071 per ton, the lowest in four years, driven by operational efficiencies and increased renewable energy usage.

    Key Metrics

    Market Cap
    ₹1,90,731 Cr.
    Current Price
    ₹451
    High / Low
    ₹808 / 285
    Stock P/E
    21.7
    Book Value
    ₹18.1
    Dividend Yield
    6.41%
    ROCE
    46.2%
    ROE
    55.2%
    Metric Value
    Face Value ₹2.00
    Debt ₹14,016 Cr.
    Reserves ₹6,797 Cr.
    No. Eq. Shares 423 Cr.
    Chg in Promoter Holding (3 Years) 0.01%
    Sales Growth (3 Years) 8.54%
    Profit Growth (3 Years) 0.24%
    Sales ₹31,232 Cr.
    Operating Profit Margin (OPM) 48.8%
    Quarterly Sales Variation 21.4%
    Profit After Tax (PAT) ₹8,797 Cr.

    Future Growth and Expansion Plans

    Expansion to 2 Million Tons

    • Plans to achieve 2 million tons annual mine run rate leveraging 30 million tons of metal-in-ore resources
    • Global contractors finalization by November 2024
    • Production ramp-up expected by FY27

    Fertilizer Plant

    • DAP/NPK fertilizer plant commissioning by Q3 FY26
    • Projected EBITDA contribution: ₹450-₹500 crores annually

    Renewable Energy Initiatives

    • Partnership with Serentica Renewables for 530 MW capacity
    • Target: 70% renewable energy usage
    • Expected annual carbon emissions reduction: 69%

    Market Outlook and Strategic Positioning

    • India projected to become third-largest zinc consumer by 2026
    • Hedging strategy: Zinc at $3,008 per ton, Silver at $32.26 per troy ounce
    • Strong market support from economic policies in China and U.S.

    Capex and Financial Projections

    • Focus on new roasting and fertilizer projects
    • Enhancement of mining infrastructure
    • Expected net debt reduction to ₹2,000 crores by March 2025

    ESG Initiatives

    • Recognition for tax transparency and ESG excellence
    • Pioneering all-women mine rescue teams
    • Zero hunger initiatives
    • Development of zinc-based battery technologies

    Risk Factors

    Commodity Price Volatility

    Fluctuations in global zinc, lead, and silver prices could impact margins.

    Regulatory Challenges

    Potential policy changes related to mining leases and environmental compliance.

    Operational Risks

    Safety incidents and technical challenges in projects like the fumer ramp-up.

    Disclaimer: This report is for informational purposes only and does not constitute investment advice. The information presented is based on publicly available data and company disclosures. Readers are advised to perform their own due diligence and consult a financial advisor before making investment decisions. Neither the author nor any affiliates accept liability for losses arising from the use of this report.
  • Choice International’s Future Growth Soars with SEBI Approval for Mutual Fund Launch

    Choice International Limited – Equity Research Report

    Choice International Limited

    Value Pick : Best stock to buy today : India’s leading financial services conglomerate

    Executive Summary

    Choice International Limited (Choice) has emerged as a leading financial services conglomerate in India with diversified operations spanning stock broking, insurance distribution, MSME lending, and government advisory services. The company’s robust financial performance, expanding market presence, and investment in technology-driven solutions position it well for sustainable long-term growth.

    ₹10,975 Cr
    Market Capitalization
    ₹550
    Current Price
    71.6
    P/E Ratio
    24.8%
    ROCE

    Financial Performance Highlights

    Q2 FY25 vs Q2 FY24

    Revenue from Operations grew by 29.6% to ₹2,492 Mn. EBITDA increased by 51% to ₹777 Mn, with margins improving to 31.16%. PAT rose by 56% YoY to ₹465 Mn.

    H1 FY25

    Revenue: ₹4,551 Mn (YoY growth of 37%)
    EBITDA: ₹1,359 Mn (52% increase YoY)
    PAT: ₹785 Mn (53% YoY increase)

    Strategic Growth Drivers

    1. Diversified Business Portfolio

    Stock Broking: Expanding presence in Tier III and below geographies
    Insurance Distribution: 131% YoY growth in policies sold
    MSME Lending: Recent acquisitions of Paisobuddy and Sureworth
    Government Advisory: Substantial infrastructure consulting order book

    2. Operational Metrics

    30.2% Operating Profit Margin and 23.6% Return on Equity highlight strong operational efficiency. Continuous focus on client-centric innovations.

    3. Tech-Driven Expansion

    Proprietary digital tools enhance customer engagement with upcoming features like family mapping and simplified auto-pay journeys.

    Future Projections

    Projected revenue CAGR of 30-35% over the next three years. PAT growth expected to sustain at 50-55%. Pan-India expansion through 168 branch offices.

    Investment Recommendation

    Rating: BUY (Long-Term Horizon)

    Target Price: ₹750 (12-month horizon)
    Upside Potential: ~36% from current market price of ₹550

    Disclaimer

    This report is for informational purposes only and should not be considered as investment advice. The information contained herein is based on sources believed to be reliable, but no guarantee is made as to its accuracy. Investors should conduct their own research and consult with financial advisors before making investment decisions. Past performance is not indicative of future results.

  • Kronox Lab Sciences (KRONOX) Stock Forecast 2025: Growth Analysis & Revenue Projections | Specialty Chemicals Leader

    Kronox Lab Sciences Limited

    Company Overview

    Kronox Lab Sciences Limited (KRONOX) is a leading manufacturer specializing in high-purity specialty fine chemicals. With an extensive portfolio of 185 products, KRONOX caters to pharmaceutical, nutraceutical, and food industries globally. The company operates from strategically located manufacturing units in Vadodara and is poised for expansion with a new facility in Dahej, Bharuch. KRONOX’s certifications, including FSSC 22000, GMP, GLP, ISO 9001:2015, and ISO 45001:2018, underscore its commitment to quality and compliance.

    Investment Highlights

    Market Position: KRONOX successfully listed on NSE and BSE in 2024, attracting over 31,000 investors. The company benefits from robust customer relationships and long-term supply commitments domestically and internationally.

    Strong Financial Metrics

    Market Cap
    ₹ 799 Cr.
    Current Price
    ₹ 215
    52-Week High/Low
    ₹ 229 / ₹ 138
    P/E Ratio
    34.2
    Book Value Per Share
    ₹ 20.8
    ROCE
    51.5%
    ROE
    38.4%
    Dividend Yield
    0.23%

    Revenue and Profitability Trends

    Sales (FY24)
    ₹ 92.9 Cr. (-5.98% YoY)
    Profit After Tax
    ₹ 23.3 Cr. (+30.3% YoY)
    Operating Profit Margin
    33.5%
    Sales Growth (3-Year CAGR)
    12.9%

    Key Financial Ratios

    Fixed Assets Turnover Ratio
    3.40x
    PAT Margin
    23.57%
    Cash Conversion Cycle
    96 days

    Risks and Concerns

    1. Dependency on Export Markets: Exports contribute approximately 25.21% of revenue, exposing the company to forex fluctuations and global demand-supply dynamics.
    2. Sales Decline: Sales witnessed a decline of 5.98% in FY24, necessitating analysis of underlying factors and mitigation strategies.
    3. Capacity Utilization Risk: While expansion plans are promising, under-utilization of the new Dahej facility could impact returns.

    Valuation

    At a P/E ratio of 34.2x, KRONOX’s valuation reflects investor confidence in its growth trajectory. With a book value per share of ₹ 20.8, the stock trades at approximately 10.34x its book value. Given the company’s robust ROE and ROCE, the valuation appears justified but demands monitoring of sales growth and profitability sustainability.

    Conclusion and Recommendation

    KRONOX Lab Sciences Limited represents a compelling growth story with a robust operational framework, debt-free status, and significant expansion plans. However, investors should watch for improvements in sales performance and capacity utilization post-expansion.

    Stock Rating: BUY

  • Mrs. Bectors food:15% growth target, 590 billion opportunity and QSR expansion plan

    Mrs. Bectors Food Specialties Ltd – Equity Research Report

    Mrs. Bectors Food Specialties Ltd

    Rating: BUY | Risk Profile: Medium to High

    Executive Summary

    Mrs. Bectors Food Specialties Limited (MBFSL) has established itself as a leading player in India’s premium biscuit, bakery, and QSR supply chain segments. With a presence in over 65 countries and state-of-the-art manufacturing facilities, the company is well-positioned to capitalize on the growing FMCG landscape. Our analysis indicates strong growth potential driven by capacity expansion, product innovation, and strategic QSR partnerships.

    Business Overview

    Product Portfolio

    • Biscuits Division:
      • Domestic range: Premium cookies, creams, crackers, digestives, and Marie
      • Export-specific products
      • Market leader in premium segments in North India
    • Bakery Division:
      • Retail products: Breads, buns, cakes, and gourmet items
      • Institutional offerings: Custom products for QSR chains
      • Innovation in premium categories (sourdough, ciabatta)
    • QSR Division:
      • Strategic supplier to major chains including McDonald’s
      • Walmart partnership under India sourcing initiative
      • Specialized production facilities for institutional clients

    Industry Analysis

    Market Size & Growth Potential

    • Biscuit Market:
      • Current size (FY20): ₹380 billion; Projected size (FY25): ₹590 billion
      • CAGR: 9%
      • Growth drivers: Low per capita consumption, premiumization trend, growing organized retail
    • Bakery Market:
      • Bread & buns market (FY20): ₹50 billion; Projected size (FY25): ₹76 billion
      • Premium segment growth: 15% CAGR
    • QSR Segment:
      • Current size (FY20): ₹188 billion; Projected size (FY25): ₹524 billion
      • CAGR: 23%

    Strategic Initiatives

    • Manufacturing Excellence: ₹469 Cr investment (FY20-24); capacity expansion of 38,760 MT for biscuits and 24,741 MT for bakery.
    • Distribution Network: 7 lakh+ retail outlets, 3 lakh+ direct reach, 490+ super stockists, 1,250+ distributors.
    • Product Innovation: Focus on health products (Zero Maida range) and premium categories.

    Financial Analysis

    Recent Performance

    • Q2 FY25 Results: Revenue ₹496.3 Cr (+19.7% YoY), EBITDA ₹70.5 Cr (+9.0% YoY), PAT ₹38.9 Cr (+4.4% YoY), EBITDA margin 14.2%
    • H1 FY25 Results: Revenue ₹935.7 Cr (+18.6% YoY), EBITDA ₹134.5 Cr (+9.7% YoY), PAT ₹74.4 Cr (+3.1% YoY), EBITDA margin 14.4%

    Key Financial Metrics (FY24)

    • EBITDA Margin: 14.9%
    • PAT Margin: 8.6%
    • Net Debt-to-Equity: 0.2x
    • Operating Cash Flow: ₹153.4 Cr

    Investment Thesis

    Strengths: Strong brand presence in premium segments, robust QSR partnerships, state-of-the-art manufacturing capabilities, healthy financial metrics.

    Growth Drivers: Industry tailwinds, capacity expansion, product innovation pipeline, distribution network enhancement.

    Risks: Raw material price volatility, competitive intensity, geographic concentration, execution risks in expansion.

    Valuation & Recommendation

    We maintain a BUY rating based on robust growth trajectory, strong order visibility (24-36 months), clear expansion strategy, a healthy balance sheet, and premium market positioning. Suitable for investors with a medium to long-term investment horizon seeking quality growth stocks in the FMCG sector.

Value Picks fin.ctoi.in
Value Picks

Dont Miss our Value picks

SUBSCRIBE TO OUR NEWSLETTER to Get short term, long term and multi-bagger

We don’t spam! Read our privacy policy for more info.