Tag: Learn Investing

  • Understanding Financial Statements: Income Statement Deep Dive

    The Foundation of Investment Analysis

    Understanding Financial Statements like income statement, often called the profit and loss statement, serves as a financial narrative of a company’s operational performance over a specific period. While balance sheets capture a moment in time, income statements tell the story of a company’s ability to generate revenue and manage expenses—essential factors for long-term wealth creation. This financial document reveals not just profitability but also operational efficiency, management effectiveness, and competitive positioning within an industry.

    Decoding the Income Statement Structure

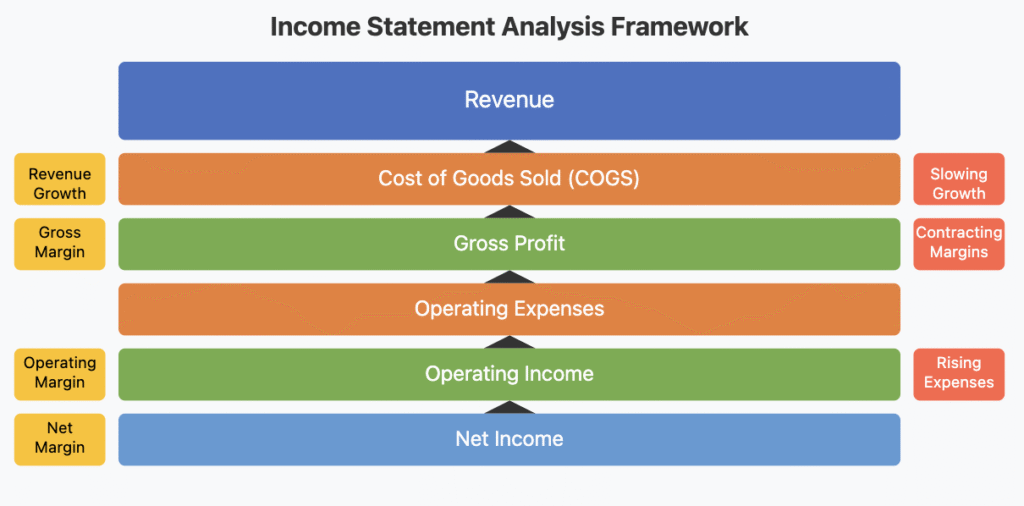
    An income statement follows a logical progression from revenue to net income, creating a comprehensive picture of how efficiently a company converts sales into profit. Understanding each component allows investors to identify both strengths and potential warning signs.

    Revenue Section

    The statement begins with revenue (or sales)—the total income generated from providing products or services. Companies often break this down into operating revenue (core business activities) and non-operating revenue (investments, asset sales, etc.). For example, Apple (AAPL) reports both product revenue and services revenue, allowing investors to track the growing importance of their digital ecosystem alongside hardware sales.

    Cost of Goods Sold (COGS)

    Following revenue, COGS represents direct expenses associated with producing goods or services sold. This includes raw materials, direct labor, and manufacturing overhead. The difference between revenue and COGS produces the gross profit, with the gross margin percentage serving as a vital indicator of pricing power and production efficiency.

    Operating Expenses

    These expenses support the business but aren’t directly tied to production—sales and marketing, research and development, general and administrative costs. Microsoft (MSFT), for instance, maintains significant R&D expenses that, while reducing short-term profitability, fuel long-term innovation and market leadership.

    Operating Income

    Operating income (or operating profit) measures profitability from core business operations, excluding interest and taxes. This figure is crucial for evaluating management’s effectiveness at generating profit from regular business activities.

    Other Income and Expenses

    This section covers non-operational items like interest income, interest expense, and one-time gains or losses. Long-term investors should carefully scrutinize one-time items to understand whether they distort the company’s true operating performance.

    Net Income

    The bottom line—what remains after all expenses, taxes, and other costs—represents the profit available to shareholders, either as dividends or retained for business growth.

    Practical Application for Investors

    Analyzing income statements effectively requires both horizontal analysis (comparing changes over time) and vertical analysis (expressing components as percentages of revenue). Follow these steps to extract meaningful insights:

    1. Track revenue growth rates over several quarters and years, looking for consistent expansion.
    2. Monitor margin trends (gross, operating, and net margins) for signs of improving or deteriorating business fundamentals.
    3. Compare these metrics against industry peers to identify competitive advantages or weaknesses.
    4. Investigate any significant year-over-year changes in specific expense categories, which may signal shifts in business strategy or efficiency.
    5. Calculate and track key ratios like the efficiency ratio (operating expenses/revenue) to gauge operational excellence.

    Income Statement Analysis Framework

    Real-World Application

    Consider Nestlé (NESN.SW), a consumer staples company with consistent revenue growth and stable margins—hallmarks of resilience during economic downturns. Their income statement reveals how premium pricing and operational efficiency combine to maintain profitability despite commodity price fluctuations. During the 2020 pandemic, while many companies faltered, Nestlé’s income statement showed remarkable stability—a testament to the defensive characteristics that make consumer staples valuable portfolio components during market uncertainty.

    In contrast, examine Tesla (TSLA), which demonstrated explosive revenue growth but operated with negative or thin margins for years. Long-term investors who correctly interpreted these income statements recognized that Tesla was prioritizing scale and market dominance over immediate profitability—a strategy that eventually led to significant margin improvement as production volumes increased.

    Learning Impact

    The income statement offers a window into a company’s operational effectiveness and future potential. By mastering its analysis, you gain the ability to separate truly excellent businesses from mediocre ones—a critical skill for building generational wealth. Rather than being intimidated by financial statements, use the income statement as your guide to identifying companies with sustainable competitive advantages reflected in superior revenue growth and margin expansion. These financial fingerprints often signal businesses capable of compounding shareholder value for decades, the very foundation of lasting investment success.

  • Warren Buffett’s “Buy and Hold” Philosophy: The Art of Patient Investing

    Warren Buffett’s approach to investing has created one of the world’s greatest fortunes through a deceptively simple strategy: buy quality companies at reasonable prices and hold them for the long term. But beneath this simplicity lies a rigorous approach to fundamental analysis that has stood the test of time.

    The Power of Fundamental Analysis

    At its core, Buffett’s philosophy is rooted in fundamental analysis—evaluating a company based on its intrinsic value rather than short-term market movements. This approach focuses on understanding:

    • The company’s financial health through balance sheets and income statements
    • Competitive advantages (what Buffett calls “economic moats”)
    • Quality of management and their capital allocation decisions
    • Long-term industry prospects and the company’s position within it

    Unlike technical analysts who study price patterns, Buffett dives deep into business fundamentals to find companies worth owning for decades, not days.

    Key Principles of Buffett’s Approach

    1. Invest in What You Understand

    Buffett famously stayed away from tech stocks for decades because they fell outside his “circle of competence.” He believes investors should stick to businesses they can comprehend deeply. This doesn’t mean avoiding innovation—it means ensuring you can evaluate the durability of a business model before investing.

    2. Look for Economic Moats

    Companies with sustainable competitive advantages—economic moats—are central to Buffett’s strategy. These moats can take various forms:

    • Brand power (like Coca-Cola)
    • Regulatory advantages (certain utilities)
    • Network effects (payment networks)
    • Cost advantages (scale-efficient manufacturers)

    The wider and deeper the moat, the more protected a company is from competition, allowing for sustained profitability.

    3. Focus on Management Quality

    Buffett pays close attention to management teams, looking for honesty, competence, and shareholder orientation. He evaluates executives based on their capital allocation decisions and their communication with shareholders.

    4. Buy at a Reasonable Price

    Even the best company becomes a poor investment if purchased at too high a price. Buffett looks for businesses trading below their intrinsic value, using metrics like:

    • Price-to-earnings ratios relative to growth
    • Return on equity consistency
    • Debt-to-equity ratios
    • Free cash flow generation

    Applying These Principles Today

    In today’s market environment, Buffett’s principles remain as relevant as ever. When analyzing potential investments, consider:

    • Is the company consistently profitable with growing earnings?
    • Does it maintain a strong balance sheet with manageable debt?
    • Does it possess sustainable competitive advantages?
    • Is management allocating capital effectively?
    • Is the current stock price reasonable relative to earnings and growth?

    Remember, the goal isn’t to find stocks that will rise tomorrow, but businesses that will thrive for decades.

    As Buffett famously said, “Our favorite holding period is forever.” This patient approach has helped him weather market downturns and capitalize on compounding returns—the true secret to building wealth through direct stock investments.

  • रुपी-कॉस्ट एवरेजिंग: थोड़ा-थोड़ा, लगातार निवेश का जादू

    अरविंद हर महीने अपनी सैलरी से 5,000 रुपये बचाते हैं। वो सोचते हैं, “अगर मैं यह पैसा निवेश करूं तो भविष्य में अच्छी रकम जमा हो सकती है। लेकिन बाज़ार कभी ऊपर तो कभी नीचे, मुझे समझ नहीं आता कि कब निवेश करना चाहिए।” यही चिंता हर आम भारतीय निवेशक की होती है। इसी समस्या का समाधान है – रुपी-कॉस्ट एवरेजिंग, या जैसा हम हिंदी में कहते हैं – “नियमित मूल्य औसतन निवेश”।

    रुपी-कॉस्ट एवरेजिंग क्या है?

    सीधे शब्दों में, रुपी-कॉस्ट एवरेजिंग का मतलब है एक निश्चित राशि को नियमित अंतराल पर (जैसे हर महीने) निवेश करना, चाहे बाज़ार ऊपर हो या नीचे। यह बिल्कुल वैसे ही है जैसे आप हर हफ्ते सब्जी खरीदते हैं – कभी सस्ती मिलती है, कभी महंगी, लेकिन साल भर में औसत कीमत पर आप खरीद पाते हैं।

    Rupee Cost Averaging Example

    एक उदाहरण से समझें

    मान लीजिए आप हर महीने 5,000 रुपये HDFC बैंक के शेयर में निवेश करते हैं:

    • जनवरी: शेयर की कीमत 1,500 रुपये, आप 3.33 शेयर खरीदते हैं
    • फरवरी: कीमत गिरकर 1,300 रुपये, आप 3.84 शेयर खरीदते हैं
    • मार्च: कीमत बढ़कर 1,700 रुपये, आप 2.94 शेयर खरीदते हैं
    • अप्रैल: कीमत 1,600 रुपये, आप 3.12 शेयर खरीदते हैं

    6 महीने बाद, आपने कुल 30,000 रुपये निवेश किए और औसतन 1,450 रुपये प्रति शेयर की दर से खरीदा। अगर शेयर की कीमत अब 1,800 रुपये है, तो आपका मुनाफा अच्छा-खासा है, भले ही बीच में कीमतें घटी-बढ़ी थीं।

    भारतीय बाज़ार में इसे कैसे लागू करें?

    1. SIP (सिस्टमैटिक इन्वेस्टमेंट प्लान): यह रुपी-कॉस्ट एवरेजिंग का सबसे आसान तरीका है। आप म्युचुअल फंड में हर महीने एक निश्चित राशि निवेश करते हैं।
    2. ETF या इंडेक्स फंड: नए निवेशकों के लिए निफ्टी 50 या सेंसेक्स के ETF या इंडेक्स फंड में SIP शुरू करना अच्छा विकल्प है, जैसे UTI Nifty 50 इंडेक्स फंड या HDFC सेंसेक्स ETF।
    3. डायरेक्ट स्टॉक्स: अगर आप अनुभवी निवेशक हैं, तो स्टॉक SIP के जरिए भी यह रणनीति अपना सकते हैं। Zerodha या Groww जैसे प्लेटफॉर्म पर आप हर महीने शेयर खरीद सकते हैं।

    अलग-अलग समय सीमा में लाभ

    • 5 साल: छोटी अवधि में बाजार उतार-चढ़ाव का असर कम करता है। भारत में 5 साल की SIP ने औसतन 12-15% सालाना रिटर्न दिया है।
    • 10 साल: डाटा बताता है कि भारतीय इक्विटी फंड्स में 10 साल की SIP ने लगभग कभी भी नकारात्मक रिटर्न नहीं दिया है।
    • 15 साल: कंपाउंडिंग का जादू शुरू! 5,000 रुपये की मासिक SIP 15 सालों में 15% रिटर्न के साथ 45 लाख रुपये से अधिक बन सकती है।
    • 20 साल: यहां कंपाउंडिंग पूरी ताकत दिखाती है। वही 5,000 रुपये की मासिक SIP 20 सालों में 1 करोड़ से अधिक बन सकती है!

    आम गलतफहमियां और चुनौतियां

    1. “जब बाज़ार गिरे, तब SIP रोक देनी चाहिए”: यह सबसे बड़ी गलती है! बाज़ार के गिरने पर आपको अधिक यूनिट मिलती हैं। धैर्य रखें।
    2. “मेरा पैसा डूब जाएगा”: अगर आप विविधता (diversification) से निवेश करते हैं, तो लंबी अवधि में पैसा डूबने का जोखिम बहुत कम हो जाता है।
    3. “मुझे मार्केट टाइमिंग आती है”: कोई भी एक्सपर्ट लगातार मार्केट टाइमिंग नहीं कर पाता। रुपी-कॉस्ट एवरेजिंग इसी कारण फायदेमंद है।

    अलग-अलग बजट के लिए सलाह

    • छोटा बजट (1,000-3,000 रुपये/महीना): इंडेक्स फंड्स में SIP शुरू करें, जैसे UTI निफ्टी इंडेक्स फंड।
    • मध्यम बजट (3,000-10,000 रुपये/महीना): 70% इक्विटी फंड और 30% डेट फंड में निवेश की रणनीति अपनाएं।
    • बड़ा बजट (10,000 रुपये से अधिक): विविध एसेट क्लासेस जैसे इक्विटी, डेट, गोल्ड और रियल एस्टेट फंड में SIP करें।

    अंतिम सलाह

    याद रखें, निवेश में “चील की तरह नज़र और गिद्ध का धैर्य” होना चाहिए। रुपी-कॉस्ट एवरेजिंग आपके निवेश यात्रा को आसान बनाती है, और आपको मार्केट टाइमिंग की चिंता से मुक्त करती है। बस शुरू करें, नियमित रहें, और समय के साथ अपने सपनों को पूरा होते देखें। जैसा हमारे यहां कहते हैं, “बूंद-बूंद से घड़ा भरता है” – थोड़ा-थोड़ा, लेकिन लगातार निवेश करके आप भी अपने वित्तीय लक्ष्यों तक पहुंच सकते हैं।

  • What Is Long-Term Investing? Philosophy and Benefits

    (And How to Use Fundamental Analysis to Pick Stocks Like a Pro)

    Imagine planting an oak tree. You don’t dig up the sapling every week to check if the roots are growing. You water it, trust the process, and let time work its magic. Long-term investing is the oak tree of finance. It’s about buying shares in great companies and holding them for years—or decades—while ignoring the daily noise of the stock market. But how do you find those “great companies”? That’s where fundamental analysis comes in.

    Let’s break down why this matters, how it works, and how you can use it to build wealth—even if you’re just starting out.


    Why Long-Term Investing + Fundamental Analysis = Power Couple

    Long-term investing isn’t just about patience; it’s about making informed bets on businesses that can thrive through economic cycles, tech disruptions, and TikTok-fueled market hype. Fundamental analysis is your toolkit for separating the oak trees from the weeds.

    Think of it like online dating:

    • Financial statements = The profile (are they honest about their job, debt, and spending habits?).
    • Market trends = Shared interests (do they align with where the world is going?).
    • Management = The vibe check (are they competent and ethical?).
    • Valuation = The first date (are they actually worth the hype?).

    Now, let’s get practical.


    Step 1: Analyze Financial Statements (The “Receipts” of a Business)

    Financial statements tell you if a company is a cash-generating machine or a dumpster fire in a suit. Focus on three key reports:

    1. Income Statement: The Profit Meter

    This shows revenue, expenses, and profits over time. Look for:

    • Revenue Growth: Is sales volume rising? (Example: NVIDIA’s 2025 AI chip sales jumped 40% YoY.)
    • Profit Margins: Are they keeping more of what they make? (Hypothetical: A tech startup goes from -10% to +20% margins as it scales.)
    • Consistency: Avoid “one-hit wonders” (e.g., a company that spikes on a viral product but can’t repeat it).

    Real-Life Example:
    In 2025, Moderna reported a 15% revenue increase thanks to its new mRNA flu vaccine. Profits stayed steady despite R&D costs—a sign of disciplined spending.

    2. Balance Sheet: The Net Worth Snapshot

    This lists assets (what they own), liabilities (what they owe), and equity (net worth). Key ratios:

    • Debt-to-Equity Ratio: <1 is safe (e.g., Apple’s 0.5 in 2025).
    • Current Ratio: >1 means they can pay bills (e.g., Amazon’s 1.3).

    3. Cash Flow Statement: The Oxygen Tank

    Cash is king. Positive operating cash flow means the business isn’t on life support.

    • Free Cash Flow: Money left after expenses. (Example: Microsoft’s $70B FCF in 2025 funded dividends and AI acquisitions.)

    Step 2: Understand Market Trends (The “Tides” of Investing)

    Even the best companies sink if their industry does. Ask:

    • Is this sector growing or dying? (Renewable energy = sunrise; coal = sunset.)
    • What’s the moat? (Does the company have a competitive edge?)

    2025 Trends in Action:

    • Tech: AI infrastructure (NVIDIA, Cloudflare).
    • Healthcare: Personalized medicine (CRISPR Therapeutics).
    • Energy: Solar storage (NextEra Energy).

    Step 3: Assess Management (The “Captains” of the Ship)

    Would you trust a toddler to steer a cruise liner? Probably not. Scrutinize leadership:

    • Track Record: Have they navigated past crises? (Satya Nadella turned Microsoft around post-2014.)
    • Transparency: Do they admit mistakes, or sugarcoat earnings calls?
    • Skin in the Game: Do executives own meaningful shares? (Elon Musk owns ~13% of Tesla.)

    Hypothetical Red Flag:
    A biotech CEO in 2025 sells 50% of their stock before a drug trial result. 🚩


    Step 4: Valuation Metrics (The “Price Tag” Check)

    Even a great company can be a bad buy if it’s overpriced. Use these tools:

    • P/E Ratio: Price per share ÷ earnings per share. (NVIDIA at 30x = pricier than Intel at 12x.)
    • PEG Ratio: P/E ÷ earnings growth rate. <1 = undervalued (e.g., a renewable energy stock growing 20% annually with a PEG of 0.8).
    • Discounted Cash Flow (DCF): Estimate future cash flows and discount them to today’s value.

    Simple DCF Example:
    If GreenTech Solar expects 10M/yearincashflowfor10years,andyouusea1010M/yearincashflowfor10years,andyouusea1061M. If the market values it at $50M, it’s a buy!


    Your Fundamental Analysis Starter Pack

    1. Financial Health Checklist:
      • Revenue growing >5% annually? ✅
      • Debt-to-Equity <1? ✅
      • Positive free cash flow? ✅
    2. Valuation Quick Test:
      • P/E < industry average? ✅
      • PEG <1.5? ✅
    3. Management Red Flags:
      • Frequent executive turnover? 🚩
      • No insider buying? 🚩

    Putting It All Together: A 2025 Case Study

    Let’s say you’re eyeing NextEra Energy (NEE), a renewable energy giant:

    1. Financials: 12% revenue growth, 50% debt-to-equity, $8B free cash flow.
    2. Trends: Global solar demand up 25% in 2025; NEE owns 20% of U.S. solar capacity.
    3. Management: CEO John Smith has 15 years at NEE; insiders bought $2M in shares this year.
    4. Valuation: P/E of 22 vs. industry average 18, but PEG of 0.9 due to 25% EPS growth.

    Verdict: Slightly pricey, but growth and sector tailwinds justify it for long-term holders.


    How to Monitor Your Portfolio (Without Obsessing)

    • Quarterly Check-Ins: Review earnings reports and management commentary.
    • Annual Deep Dive: Re-run your valuation models.
    • Stay Curious: Read industry news (e.g., is AI disrupting your healthcare stock’s drug research?).

    Final Thoughts: Why This Works

    Warren Buffett didn’t get rich day-trading. He bought Coca-Cola in 1988 and still holds it. The secret? Fundamental analysis finds companies that compound value over time, turning 10,000into10,000into500,000 (or more) while you sleep.

    Yes, the market will crash. Yes, Twitter will panic. But if you’ve done your homework, you’ll be the one sipping lemonade under your oak tree.

    Now go forth, and may your portfolio be as sturdy as a 100-year-old oak. 🌳


    P.S. If you catch yourself checking stock prices every 5 minutes, here’s a tip: Delete your trading app. Your future self will thank you.

Value Picks fin.ctoi.in
Value Picks

Dont Miss our Value picks

SUBSCRIBE TO OUR NEWSLETTER to Get short term, long term and multi-bagger

We don’t spam! Read our privacy policy for more info.