Tag: trending stocks

  • Mazagon Dock Shipbuilders: Strong Q3 FY25 Performance Signals Robust Long-Term Growth Trajectory

    Executive Summary

    Mazagon Dock Shipbuilders Limited (MAZDOCK), a Navratna Defense Public Sector Undertaking with an established reputation in constructing submarines, destroyers, and frigates, has delivered impressive Q3 FY25 results. The company demonstrated solid operational metrics and indicated promising long-term growth potential supported by a secure order book, substantial backlog, and strategic capital expenditure plans aimed at expanding capacity and upgrading technology.

    Key Company Metrics

    Q3 FY25 Results & Performance Analysis

    Revenue & Earnings Growth

    The Q3 FY25 figures demonstrate robust top-line execution with revenue growth consistent with Mazagon Dock’s historical performance. The company maintained focus on order execution with significant contributions from completed projects, particularly Project 15 Bravo. Notable reversals of D-448 liabilities have additionally boosted profitability during this quarter.

    Margin Performance

    While current profit before tax (PBT) margins exceed industry-normalized ranges, management has provided guidance that over the medium term, normalized margins are expected to settle in the 12-15% range (PBT basis). This adjustment is anticipated as legacy high-margin orders are gradually phased out and new orders come into the pipeline.

    Expense Analysis

    Expense Management

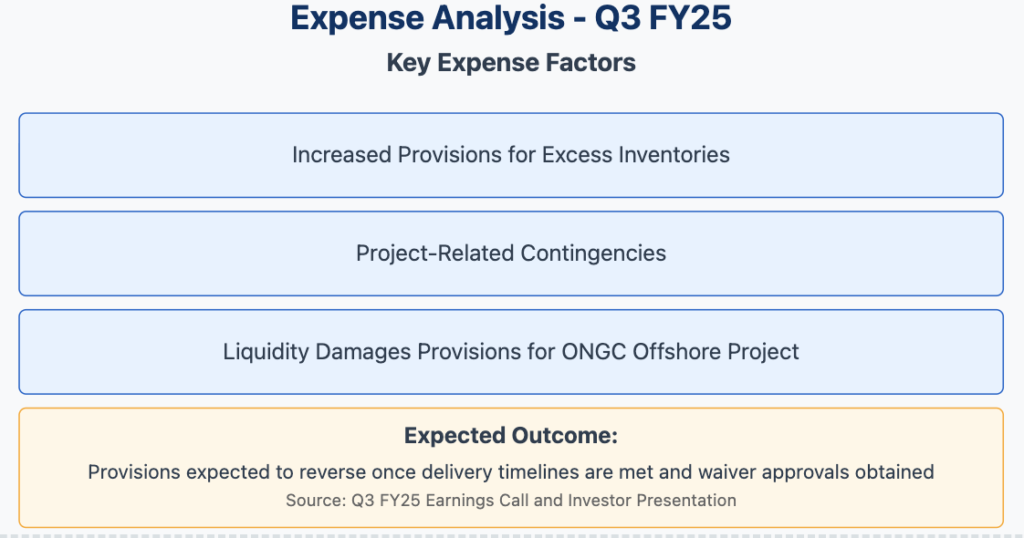
    The company reported increased provisions during the quarter, primarily related to:

    • Excess inventories
    • Project-related contingencies
    • Liquidity damages provisions for the ONGC offshore project

    Management indicated that these provisions are expected to reverse once delivery timelines are met and necessary waiver approvals are obtained, potentially boosting future profitability.

    Future Growth Plans & Expansion Strategy

    CAPEX & Growth Strategy

    CAPEX & Infrastructure Upgrades

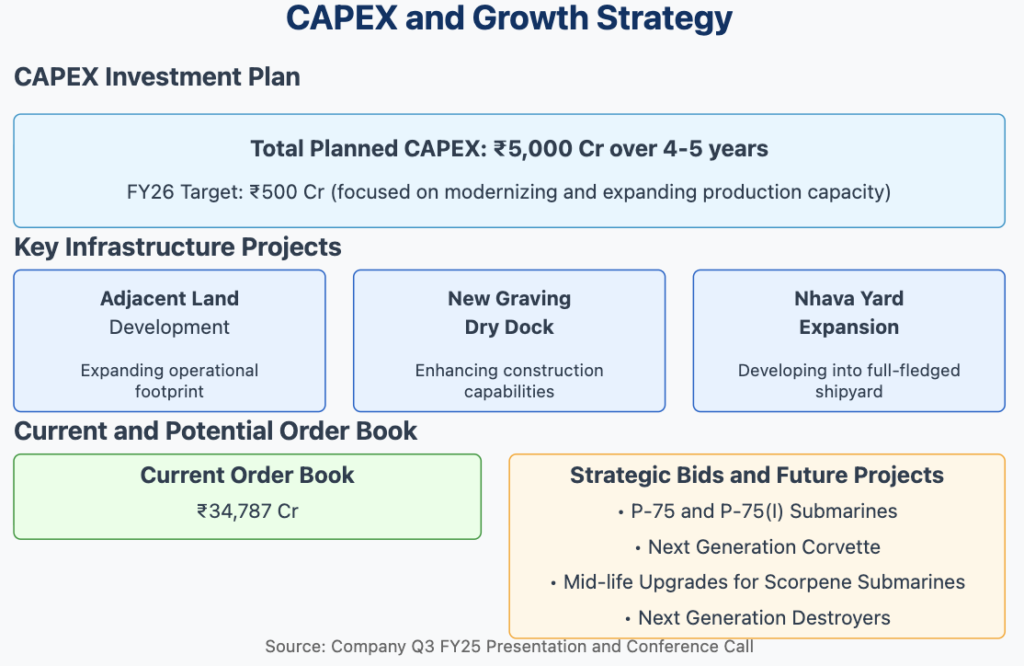
    Mazagon Dock has outlined an ambitious capital expenditure program of approximately ₹5,000 Cr spread over the next 4-5 years. This significant investment is strategically directed toward:

    1. Development of adjacent land assets to expand operational footprint
    2. Construction of a new graving dry dock to enhance shipbuilding capabilities
    3. Expansion of the Nhava Yard into a full-fledged shipyard to increase capacity

    Near-term CAPEX is projected at ₹500 Cr for FY26, with primary focus on modernizing and expanding production capacity to meet future order requirements.

    Order Book & New Projects

    The company maintains a robust order book valued at approximately ₹34,787 Cr, which includes all current projects. Management has indicated promising prospects for upcoming orders in critical segments including:

    • P-75 and P-75(I) submarine programs
    • Additional submarine orders
    • Next-generation destroyers
    • Next Generation Corvette program
    • Mid-life upgrades for Scorpene submarines

    The company is also exploring export potential, with preliminary exports such as support for Malaysian submarines suggesting broader international opportunities on the horizon.

    Long-Term Financial Projections & Return Outlook

    Long-Term Financial Projections

    5-Year Outlook

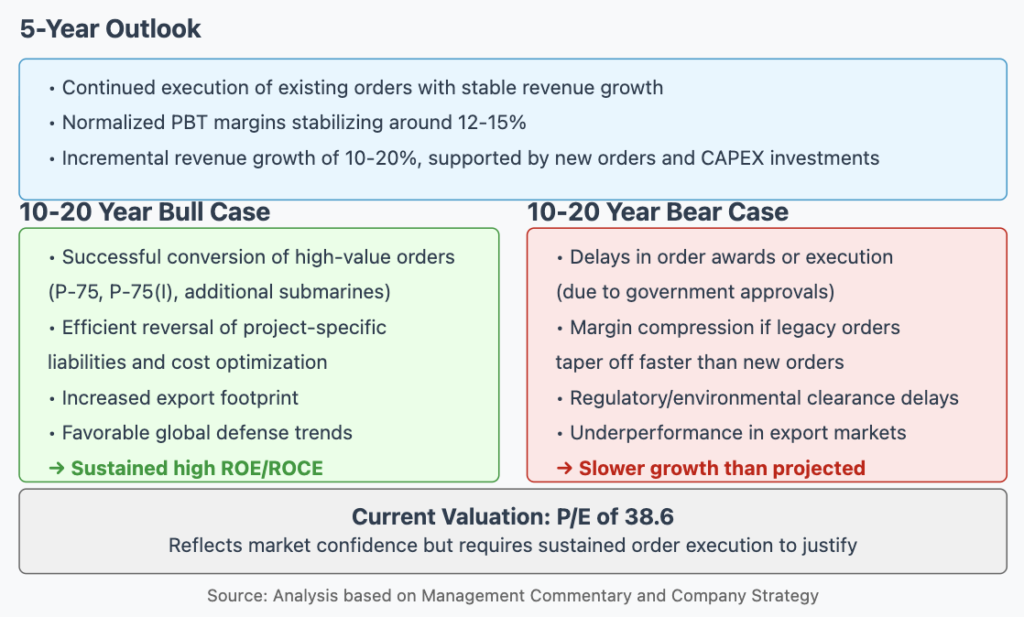
    Over the next five years, Mazagon Dock is expected to focus on:

    • Continued execution of existing orders with stable revenue growth
    • Normalized PBT margins stabilizing around the industry average of 12-15%
    • Incremental revenue growth in the range of 10-20%, supported by new orders and ongoing CAPEX investments

    10-20 Year Outlook

    Bull Case Scenario

    • Successful conversion of high-value orders including P-75, P-75(I), additional submarines, destroyers, and frigate programs
    • Efficient reversal of project-specific liabilities and implementation of cost optimization measures
    • Expanded export footprint and favorable global defense trends boosting revenues and margins
    • Long-term returns benefiting from sustained high ROE/ROCE (currently at 44.2% and 35.2% respectively)
    • Continuation of strong dividend distribution track record, albeit with a modest yield of 0.52%

    Bear Case Scenario

    • Delays in order awards or execution due to government approvals or technical challenges
    • Margin compression if legacy high-margin orders taper off faster than new orders are secured
    • Regulatory or environmental clearance delays impacting CAPEX projects and expansion plans
    • Underperformance in export markets leading to slower growth than projected

    Valuation Perspective

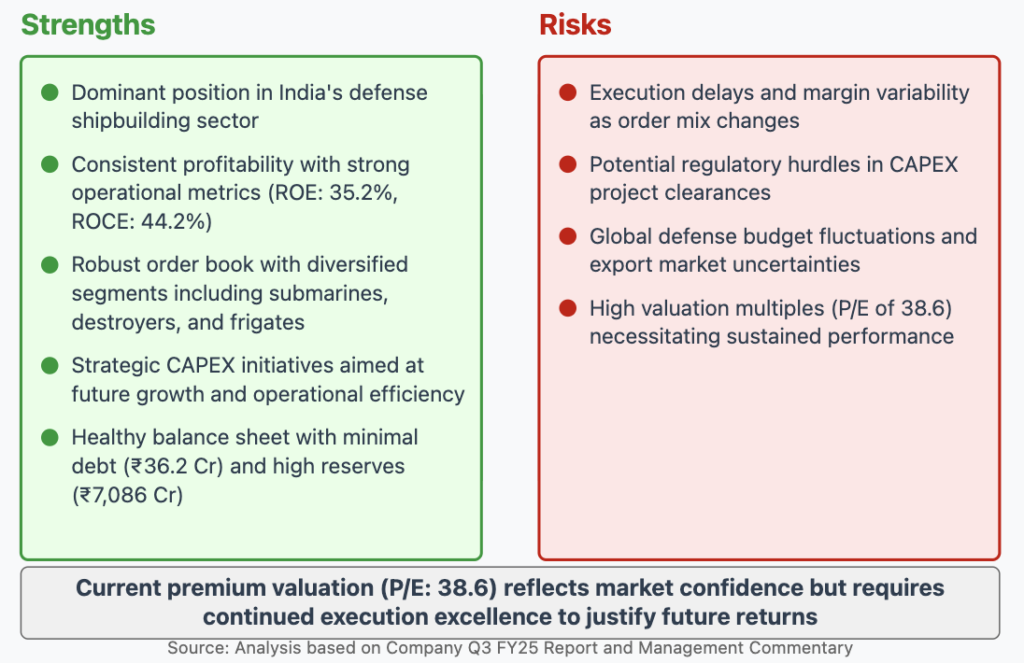
    The current premium valuation (P/E of 38.6) reflects market confidence in Mazagon Dock’s strategic positioning and operational efficiencies. However, this high valuation multiple requires sustained order execution and effective implementation of CAPEX plans to justify future returns for investors.

    Credit Ratings & Financial Health

    Financial Health & Dividend History

    Credit Profile

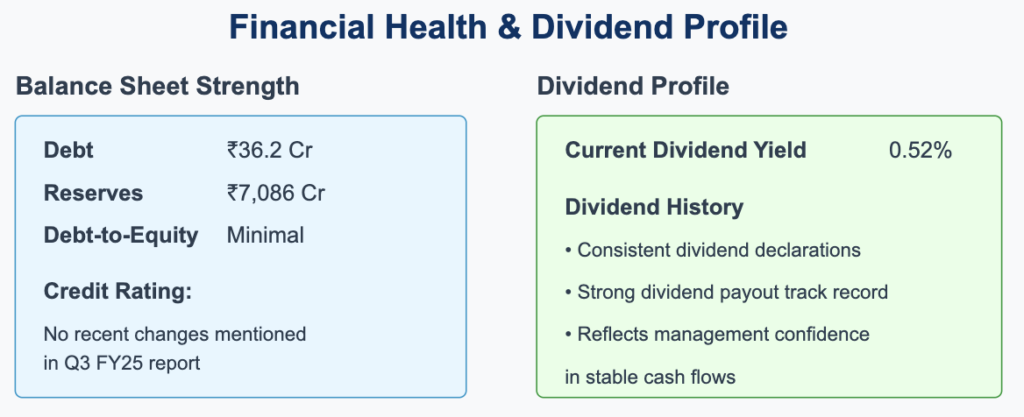
    While the Q3 FY25 report and investor presentation did not explicitly mention any recent changes in credit agency ratings, Mazagon Dock’s financial health remains exceptionally strong. The company’s balance sheet features:

    • Minimal debt of just ₹36.2 Cr
    • Substantial reserves of ₹7,086 Cr
    • Very low debt-to-equity ratio
    • Strong cash position

    This robust financial position underscores the company’s creditworthiness and provides significant headroom for future capital expenditure plans without incurring excessive leverage.

    Dividend Policy

    Mazagon Dock Shipbuilders has maintained a consistent dividend distribution history with a current yield of 0.52%. The company’s strong dividend payout track record reflects management’s confidence in stable cash flows despite the modest current yield. This dividend policy is particularly notable given the substantial capital expenditure plans, indicating management’s balanced approach to shareholder returns while investing for future growth.

    Investment Considerations

    Investment Strengths and Risks

    Strengths

    1. Dominant Market Position: Mazagon Dock maintains a leadership position in India’s defense shipbuilding sector, particularly in constructing submarines, destroyers, and frigates.
    2. Consistent Profitability: The company has demonstrated strong operational metrics with high ROE (35.2%) and ROCE (44.2%) figures, along with impressive 3-year sales and profit growth of approximately 33% and 47% respectively.
    3. Robust Order Book: The current order book of ₹34,787 Cr provides revenue visibility across diversified segments including submarines, destroyers, and frigates.
    4. Strategic CAPEX Initiatives: The planned ₹5,000 Cr CAPEX program over 4-5 years targets future growth and operational efficiency through infrastructure expansion and technology upgradation.
    5. Healthy Balance Sheet: The company maintains minimal debt (₹36.2 Cr) against substantial reserves (₹7,086 Cr), providing significant financial flexibility for future growth plans.

    Risks

    1. Execution Delays: Potential delays in project execution and margin variability as the order mix changes from legacy high-margin orders to newer contracts.
    2. Regulatory Hurdles: Possible challenges in securing regulatory and environmental clearances for planned CAPEX projects.
    3. Defense Budget Fluctuations: Exposure to global defense budget dynamics and uncertainties in export markets could impact future order inflows.
    4. Premium Valuation: The current high P/E multiple of 38.6 requires sustained performance excellence to justify future returns for investors.

    Conclusion

    Investment Outlook Summary

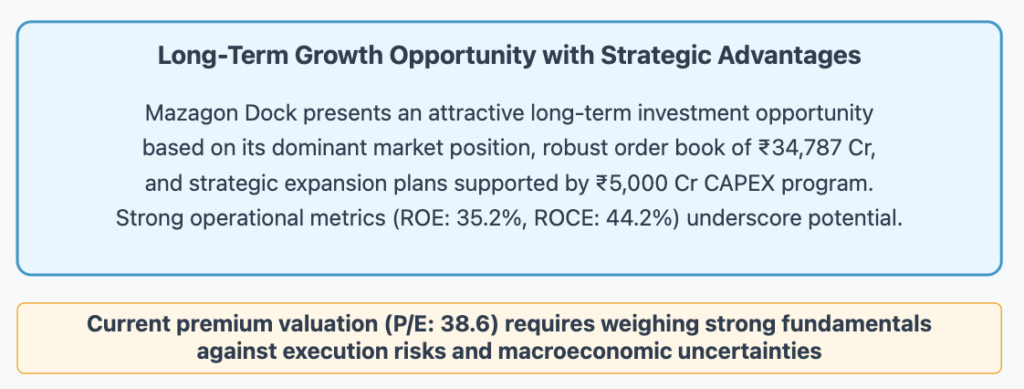
    Mazagon Dock Shipbuilders Limited presents an attractive long-term investment opportunity based on its dominant market position in India’s defense shipbuilding sector, robust order book of ₹34,787 Cr, and strategic expansion plans supported by a comprehensive ₹5,000 Cr CAPEX program spread over the next 4-5 years.

    The company’s Q3 FY25 results demonstrate solid operational execution with strong financial metrics, including impressive ROE of 35.2% and ROCE of 44.2%. With minimal debt of just ₹36.2 Cr against substantial reserves of ₹7,086 Cr, the company maintains significant financial flexibility to fund its expansion plans while continuing its consistent dividend distribution policy.

    While the current premium valuation (P/E of 38.6) reflects market confidence in the company’s long-term prospects, investors should carefully weigh the strong fundamentals and growth potential against execution risks, potential regulatory hurdles, and macroeconomic uncertainties before making investment decisions.

    The company’s ability to secure and execute future high-value orders in submarine programs (P-75, P-75(I)), next-generation destroyers, and potential export opportunities will be crucial in determining whether it can maintain its strong growth trajectory over the 5-20 year horizon that would justify its current valuation multiples.

    Disclaimer

    This report is for informational purposes only and does not constitute investment advice. Investors should conduct their own research or consult a financial advisor before making any investment decisions.

  • India Hotels IHCL Q3: 325+ Hotels Target, 2500 Croe Capex

    IHCL Q3 FY2025 Comprehensive Stock Research Report | Indian Hotels Company Limited

    IHCL Q3 FY2025 Results Stock Research Report

    1. Company Overview

    Indian Hotels Co Ltd (IHCL), a part of the Tata Group, is India’s largest hospitality company with a legacy spanning over 120 years. Operating in over 125 locations across India and international markets, including the UK, US, Middle East, Africa, Sri Lanka, and the Maldives.

    Business Model

    Owned & Leased Hotels

    Higher margins, asset-heavy model

    Management Contracts

    Scalable, asset-light model for long-term growth

    Institutional Catering

    Taj SATS – Strategic expansion in airport and railways catering

    Branded Residences

    ama Stays & Trails – Premium home rentals

    2. Key Financial Highlights (Q3 FY2025)

    Standalone Performance

    Revenue: ₹1,47,361 Cr (+15% YoY)

    EBITDA: ₹63,346 Cr (42.9%)

    Net Profit: ₹46,877 Cr (+23%)

    EPS: ₹3.30

    OPM: 32.9%

    Consolidated Performance

    Revenue: ₹2,53,305 Cr (+29% YoY)

    EBITDA Margin: 32.9%

    PAT: ₹63,253 Cr (+33.6%)

    Exceptional Gain: ₹30,736 Cr

    Balance Sheet Metrics

    Market Cap: ₹1,06,459 Cr

    Debt: ₹2,973 Cr (D/E: 0.30x)

    Reserves: ₹10,014 Cr

    ROCE: 15.1%, ROE: 14.3%

    P/E: 68.2x

    3. Growth Plans & Expansion Strategy

    Planned Expansions

    • Targeting 325+ hotels by FY2026 (currently ~280 hotels)
    • 40+ hotels under asset-light management contract model
    • New Taj hotels in Goa, Mumbai, Jaipur, and Delhi
    • 30+ new Ginger hotels by FY2026
    • International expansion in Dubai, Maldives, Saudi Arabia, and UK

    Strategic Investments

    Planned Capex for FY2025-26: ₹2,500 Cr for new developments, refurbishments, and digital transformation

    4. Competitive Landscape & Industry Outlook

    Industry Trends

    • Travel & Tourism Boom: 14% CAGR till 2030
    • Rising Business Travel: Post-pandemic MICE recovery
    • Luxury Segment Growth: Premiumization trend
    • Government Initiatives: G20 summit impact

    Key Risks

    • High Valuation Risk: P/E 68.2x vs industry 50-55x
    • Inflation & Rising Costs
    • Economic Slowdowns
    • International Expansion Risks

    5. Valuation & Investment Thesis

    Valuation Metrics

    Current Price: ₹748

    Target Price: ₹820-₹850 (12-month)

    EV/EBITDA: 25x FY26E

    P/E Multiple: 60x FY26E

    6. Financial Projections (FY2025-2027)

    Metric FY2024 (Actual) FY2025 (Est) FY2026 (Est) FY2027 (Est)
    Revenue (₹ Cr) 6,76,875 7,90,000 9,00,000 10,50,000
    EBITDA Margin (%) 32.9% 34.0% 35.2% 36.5%
    PAT (₹ Cr) 1,33,024 1,62,000 1,85,000 2,10,000
    EPS (₹) 8.86 10.95 12.50 14.20
    ROCE (%) 15.1% 16.8% 17.5% 18.0%

    7. Conclusion

    IHCL remains a high-quality hospitality play, benefiting from rising travel demand, luxury expansion, and institutional catering growth. While its valuation is expensive, strong earnings growth justifies its premium.

    Disclaimer: This report is for informational purposes only and is not investment advice. Investors should conduct their own due diligence.

  • Dhampure Speciality Sugars Limited Q3 FY25 Results: 34.8% Growth, Premium Sugar Expansion, ₹85.1Cr Market Cap

    Dhampure Speciality Sugars (BSE: 531923) – Q3 FY2025 Complete Report

    Dhampure Speciality Sugars Limited

    BSE: 531923 | Q3 FY2025 Stock Research Report

    Company Overview

    Dhampure Speciality Sugars Limited (DSSL) operates in the organic and specialty sugar segment, catering to health-conscious consumers. The company has a niche presence in organic jaggery, low-glycemic sweeteners, and chemical-free sugar. Its flagship brand, “Dhampur Green,” is well recognized in both domestic and international markets, leveraging the Direct-to-Consumer (D2C) model through e-commerce.

    Key Stock Metrics

    Market Metrics

    Market Cap: ₹85.1 Cr

    Current Price: ₹107

    52-Week High/Low: ₹142 / ₹75.7

    Stock P/E: 51.3

    Financial Metrics

    Book Value: ₹35.6

    Dividend Yield: 0.00%

    ROCE: 3.15%

    ROE: 3.78%

    Balance Sheet

    Debt: ₹0.00 Cr

    Reserves: ₹20.3 Cr

    Promoter Holding: 56.3%

    Growth Metrics

    Sales Growth (YoY): 34.8%

    Profit Growth (YoY): -52.5%

    3-Year Sales CAGR: 22.5%

    3-Year Profit CAGR: 50.6%

    Q3 FY2025 Financial Performance

    Key Highlights (YoY Growth)

    • Net Sales: ₹1142.40 Lakh (+33.7%)
    • Total Income: ₹1172.16 Lakh (+36.5%)
    • Operating Profit Margin: 4.16%
    • PAT: ₹73.38 Lakh (-52.5%)
    • EPS: ₹0.93 (vs ₹1.39 in Q2 FY25)

    Expense Breakdown

    Raw Material Cost

    ₹742.61 Lakh (+32% YoY)

    Employee Expenses

    ₹106.39 Lakh (+86% YoY)

    Depreciation & Amortization

    ₹7.51 Lakh

    Finance Costs

    ₹0.85 Lakh

    Growth Plans & Expansion Strategy

    1. Product Innovation

    • Expansion in chemical-free sugar, jaggery, and low-GI products

    • New product launches in organic and functional sweeteners

    2. Market Expansion

    • Strengthening presence in Tier-1 cities and metro areas

    • International reach in US, Europe, and Middle East

    3. Retail & E-Commerce Growth

    • Boosting D2C Sales via dhampurgreen.com

    • Partnerships with major e-commerce platforms

    4. Operational Efficiency

    • Investments in modern processing and packaging

    • Focus on waste reduction and eco-friendly production

    5. Sustainability & ESG Focus

    • Organic certification and sustainable farming

    • Biodegradable packaging solutions

    Competitive Landscape

    Company Market Cap (Cr) Revenue Growth Product Focus
    Balrampur Chini Mills ₹7,800 Strong Mass-market sugar
    EID Parry ₹10,500 Stable Sugar & bio-energy
    Dalmia Bharat Sugar ₹3,900 Moderate Industrial & consumer sugar
    Dhampure Speciality Sugars ₹85.1 High Premium & Organic Sugar

    Risks & Challenges

    Raw Material Cost Fluctuations

    Dependence on sugarcane and jaggery prices can affect margins significantly.

    Regulatory Risks

    Sugar industry heavily regulated, affecting exports, pricing, and production limits.

    Seasonality of Business

    Sugar production is seasonal, affecting quarterly revenue consistency.

    Competition from Larger Players

    Large sugar companies entering the premium segment could pressure pricing & market share.

    Industry Growth Drivers

    • Rise in health-conscious consumers driving demand for natural sweeteners

    • Government push towards organic farming boosting specialty agriculture

    • Higher disposable income fueling demand for premium, unrefined, and chemical-free sugar products

    Capital Expenditure & Strategic Rationale

    Capex Area Investment Purpose Expected Impact
    Manufacturing Upgrades Automation, better processing & packaging Higher margins & efficiency
    R&D for New Product Development Organic, low-GI sweeteners, premium sugar variants Market differentiation & premium pricing
    E-Commerce & Brand Expansion Digital marketing, influencer partnerships, website revamp Higher D2C sales, stronger online presence

    Valuation & Investment Thesis

    P/E Ratio

    51.3x

    (Industry avg: 25-30x)

    Price to Book

    3.0x

    EV/EBITDA

    28.4x

    ROE

    3.78%

    Investment Strengths

    • Revenue growth of 34.8% YoY
    • Debt-free company
    • 56.3% Promoter Holding
    • Expanding niche in premium & organic sugar

    Investment Concerns

    • Declining profit margins (-52.5%)
    • High P/E with low ROE
    • Seasonal revenue fluctuations

    Final Verdict: Hold/Watchlist

    • Short-Term: Avoid due to weak profitability trends and stretched valuations
    • Long-Term: Buy on Dips if margins improve through automation & premium pricing

    Conclusion

    Dhampure Speciality Sugars Ltd is well-positioned in the organic, chemical-free, and premium sugar space, with strong growth in revenue. However, profit margins and valuation remain key concerns. Investors should monitor margin improvements and upcoming expansion strategies before making long-term commitments.

    💡 This report is for informational purposes only and does not constitute financial or investment advice. Investors should conduct their own due diligence before making investment decisions.

  • CFCL Q3 FY2025: Multibagger Agrochemical Stock Set to Surge with TAN Project & Speciality Chemicals Expansion

    CFCL Q3 FY2025 Result Research Report

    Chambal Fertilisers and Chemicals Limited (CFCL) Q3 FY2025 Results

    Value Pick Multibagger Stock to buy

    Investment Summary

    Market Cap: ₹ 22,256 Cr

    Current Price: ₹ 556

    High/Low: ₹ 575 / 331

    Stock P/E: 13.8

    Book Value: ₹ 205

    Dividend Yield: 1.35%

    ROCE: 20.2%

    ROE: 17.0%

    Face Value: ₹ 10.0

    Debt: ₹ 99.4 Cr

    Reserves: ₹ 7,803 Cr

    Promoter Holding: 60.4%

    Sales Growth (YoY): -11.0%

    Profit Growth: 26.9%

    Sales: ₹ 16,841 Cr

    Operating Profit Margin: 14.8%

    Q3 FY2025 Financial Performance

    Revenue: ₹ 4,918 Cr (13% YoY increase)

    EBITDA: ₹ 843 Cr (16% YoY increase)

    PBT: ₹ 753 Cr (24% YoY increase)

    PAT: ₹ 505 Cr (25% YoY increase)

    Consolidated PAT: ₹ 534 Cr (16% YoY increase)

    Qtr Sales Variation: 13.1%

    3-Year Sales Growth: 12.2%

    3-Year Profit Variation: -4.98%

    Key Drivers

    • Higher sales volume of Urea & P&K fertilisers
    • Improved energy efficiency & production capacity
    • Strong performance in Crop Protection Chemicals (CPC) & Speciality Nutrients (SN)
    • Improved margins in joint venture IMACID Morocco
    • Strong operational cash flows aiding balance sheet stability

    Future Growth Plans & Expansion

    1. Technical Ammonium Nitrate (TAN) Project

    Investment: ₹ 1,645 Cr

    Capacity: 2.4 Lakh MTPA

    Amount spent till Dec 31, 2024: ₹ 466 Cr

    Current Progress: Civil foundation, detail engineering & major structures near completion

    Configuration Changes: Enable additional ammonia feed

    Revised Completion Timeline: January 2026 (No cost escalation)

    Strategic Rationale: Diversification into industrial chemicals, catering to mining & explosive industries

    Revenue Contribution: Estimated annual revenue of ₹ 2,000+ Cr post-commissioning

    2. Crop Protection Chemicals (CPC) & Speciality Nutrients (SN) Expansion

    Quarterly Growth: 39%

    YoY Growth (9 months): 38%

    New Territories Revenue Growth: 141%

    New Products Launched: 12 (weedicide, fungicide & insecticide)

    Focus Areas: Biologicals (Mycorrhiza biofertilizers, bio-nematicides, bio-fungicides)

    Revenue Target by FY26-27: ₹ 1,750 Cr (from ₹ 760 Cr in FY24)

    Strategic Alliances: Collaborations with Japanese, US & European firms

    New Market Entry: Africa & South-East Asia

    3. CFCL-TERI Centre of Excellence

    Collaboration: The Energy and Resources Institute (TERI)

    Focus Areas: Sustainable agriculture solutions, nano-biotechnology, bio-stimulants & biopesticides

    Alignment: PM PRANAAM scheme promoting biofertilizers

    Goal: Reduce chemical fertilizer dependency by 20% over 5 years

    4. Digital & Market Expansion Initiatives

    Farmer Education: Seed to Harvest program

    Support: ‘Hello Uttam Experts’ farmer call center

    Domestic B2C Market Target: ₹ 10,500 Cr by FY26-27

    Retail Expansion: Increased distributor network by 15% YoY

    Competitive Landscape & Risks

    Competitive Positioning

    • Largest private Urea manufacturer in India
    • Diversified portfolio covering Urea, P&K fertilisers, CPC & SN
    • Strong farmer outreach programs enhancing brand loyalty
    • Emerging Player in TAN Segment with competitive advantage

    Key Risks

    • Regulatory Dependence: Government pricing & subsidy policies impact margins
    • Raw Material Volatility: Dependency on imported raw materials
    • Delayed TAN Project Execution: Potential impact on future revenue projections
    • Competition: Increasing market presence of domestic & international agrochemical players
    • Environmental & ESG Concerns: Stricter pollution norms could impact manufacturing costs

    Valuation & Investment Thesis

    P/E Ratio: 13.8 (Fairly valued compared to peers)

    ROE: 17.0%

    ROCE: 20.2%

    Debt: Low at ₹ 99.4 Cr

    Dividend Yield: 1.35%

    Urea Demand: Expected to remain steady

    CPC & SN Growth: >20% CAGR over next 3 years

    Long-term Goal: Market leadership in sustainable agrochemical solutions

    Investment Verdict: Moderate Buy

    • Strong fundamentals with diversified product portfolio
    • Expansion in high-margin CPC & SN business is a key positive
    • Risk: Dependency on government policies & regulatory changes
    • Valuation: Fairly priced with scope for future growth

    Disclaimer

    This report is for informational purposes only and does not constitute investment advice. Investors should conduct their own due diligence before making investment decisions. Stock market investments are subject to market risks. Past performance does not guarantee future results.

    © 2025 Stock Research Report. All Rights Reserved.

  • Lemon Tree Hotels Q3: 42% Profit Surge, 2500 Rooms Pipeline by FY27

    Lemon Tree Hotels – Q3 FY2025 Results Analysis

    Lemon Tree Hotels Ltd – Q3 FY2025 Results

    Value Pick Best Stock to buy today

    Stock Overview

    Market Cap: ₹11,682 Cr

    Current Price: ₹147

    52-Week High/Low: ₹162 / ₹112

    Stock P/E: 65.3

    Book Value: ₹12.8

    Dividend Yield: 0.00%

    ROCE: 11.4%

    ROE: 16.3%

    Debt: ₹2,270 Cr

    Reserves: ₹224 Cr

    Promoter Holding: 22.8%

    OPM: 48.7%

    Q3 FY2025 Financial Performance

    Revenue: ₹1,235 Cr (YoY growth: 24.2%)

    Operating Profit (EBITDA): ₹601 Cr (YoY growth: 31.5%)

    Operating Profit Margin: 48.7% (up from 46.2% in Q3 FY2024)

    Net Profit (PAT): ₹179 Cr (YoY growth: 42.6%)

    Quarterly Sales Growth: 22.4%

    Debt-to-Equity Ratio: 1.01

    Hotel Pipeline & Expansion Plans

    New Openings (FY2025-FY2027)

    • Mumbai: Aurika, Navi Mumbai, Lemon Tree Premier
    • Bangalore: Lemon Tree Premier & Red Fox
    • Goa: Aurika Beach Resort, Candolim
    • Jaipur: Lemon Tree Premier
    • Pipeline cities: Chandigarh, Pune, Chennai, Coimbatore

    Total Room Additions: ~2,500 new rooms by FY2027

    International Expansion

    • Middle East: Dubai, Abu Dhabi, Doha (under Aurika brand)
    • South Asia: Nepal, Bhutan, and Sri Lanka
    • Focus: High-end leisure travelers

    Capital Expenditure & Strategic Rationale

    Planned CapEx (FY2025-FY2027): ₹1,500 Cr

    Major Investment Areas:

    • New owned hotels in strategic locations
    • Property refurbishment
    • Technology & digital transformation
    • Sustainability initiatives

    Competitive Landscape

    Key Competitors

    • Indian Hotels (Taj, Vivanta, Ginger)
    • EIH (Oberoi, Trident)
    • Chalet Hotels & Marriott-managed properties
    • Sarovar & Radisson

    Competitive Advantages

    • Asset-light expansion model
    • Strong urban presence
    • Cost leadership in operations
    • Growing brand recognition

    Risks & Challenges

    Valuation Risk

    • P/E of 65.3x above industry average
    • EV/EBITDA at 21x indicates stretched valuation

    Debt & Financial Risk

    • ₹2,270 Cr debt burden
    • Net debt/EBITDA: 3.8x

    Market Risks

    • Cyclical nature of hotel demand
    • Potential corporate travel slowdown
    • Competitive pricing pressure

    Valuation Metrics

    EV/EBITDA (FY25E): 21x (vs industry avg of ~18x)

    Price-to-Book Ratio: 11.5x (vs sector average of 7x)

    Disclaimer: This report is for informational purposes only and does not constitute investment advice. Investors should conduct their own research before making financial decisions.

  • Suditi Industries Q3: 44% QoQ Growth & Gini & Jony Acquisition Analysis

    Suditi Industries Ltd. Q3 FY2025 Results Analysis

    Suditi Industries Ltd.

    Q3 FY2025 Stock Research Report

    Suditi Industries Ltd. Q3 FY2025 Results | Value pick multibagger for long term

    Suditi Industries Ltd.

    Value pick multibagger for long term

    1. Market Overview & Key Stock Metrics

    Market Cap

    ₹98.5 Cr.

    Current Price

    ₹37.4

    52-Week Range

    ₹11.6 – ₹54.7

    Book Value

    ₹-8.98

    Debt

    ₹9.27 Cr.

    Promoter Holding

    71.7% (+4.63% in 3Y)

    Total Equity Shares

    2.64 Cr.

    3-Year Growth

    Sales: 10.2% | Profit: 14.0%

    2. Q3 FY2025 Financial Performance

    Revenue & Profitability

    • Revenue: ₹2,399.44 Lakhs (+44.3% QoQ, -1.02% YoY)
    • Operating Margin: -9.65%
    • PAT: ₹-5.36 Cr. (64.7% YoY improvement)
    • Sales Growth CAGR: 10.2% (3 years)

    Key Expenses

    • Material Costs: ₹1,495.89 Lakhs (62.3%)
    • Employee Benefits: ₹103.66 Lakhs (4.3%)
    • Depreciation: ₹68.37 Lakhs
    • Finance Costs: ₹11.49 Lakhs
    • Other Expenses: ₹658.71 Lakhs

    3. Business Strategy & Growth Plans

    Brand Acquisition: Gini & Jony

    • Acquisition of iconic kidswear brand
    • Enhanced retail and e-commerce presence
    • Access to established distribution channels
    • Revenue impact expected from H2 FY2026

    Retail Expansion Strategy

    • Omni-Channel Strategy across EBOs and LFS
    • Growing licensing business
    • Sports apparel focus through subsidiaries

    Subsidiary & Joint Venture Updates

    • Suditi Sports Apparel Limited: E-commerce focus
    • Suditi Design Studio Limited: Currently inactive
    • SAA & Suditi Retail: Managing “Nush” brand

    4. Competitive Landscape & Industry Analysis

    Industry Overview

    India’s apparel market growing at ~10% CAGR, driven by rising disposable income and e-commerce growth.

    Competitive Positioning

    Company Market Cap Revenue Profitability Growth Potential
    Suditi Industries ₹98.5 Cr. ₹71.6 Cr. Loss-Making High
    Page Industries ₹40,000 Cr. ₹4,000 Cr. Highly Profitable Moderate
    Aditya Birla Fashion ₹25,000 Cr. ₹12,000 Cr. Strong Margins High
    Arvind Fashions ₹4,000 Cr. ₹4,500 Cr. Moderate High
    Raymond Apparel ₹1,500 Cr. ₹3,000 Cr. Moderate High

    Risks & Challenges

    • High competition from industry giants
    • Supply chain risks and cotton price fluctuations
    • Execution risk in Gini & Jony integration
    • Financial risk from negative reserves

    5. Financial Valuation & Investment Thesis

    Valuation Metrics

    • Price-to-Sales (P/S): 1.37x
    • Price-to-Book (P/B): Negative
    • EV/EBITDA: Negative

    Fair Value Estimates

    • Base Case: ₹30-₹40
    • Bull Case: ₹50+
    • Bear Case: ₹15-₹20

    6. Conclusion & Final Recommendation

    Strengths

    • ✅ Strong promoter holding (71.7%)
    • ✅ Brand expansion through Gini & Jony
    • ✅ Omni-channel retail growth potential

    Weaknesses

    • ❌ Negative net worth & weak balance sheet
    • ❌ Consistently loss-making operations
    • ❌ Uncertainty in JV partnerships

    Investment Rating

    Investment Horizon Risk Level Potential Return Investment View
    Short-Term (1 year) Very High Uncertain Avoid / Watch
    Mid-Term (2-3 years)
    Mid-Term (2-3 years) High Moderate Speculative Buy
    Long-Term (5 years) Moderate High Turnaround Play

    7. Disclaimer

    This report is for informational purposes only and does not constitute financial advice. Investors should conduct their own research before making any investment decisions. The stock is high risk, and only those with high-risk tolerance should consider investing.

    Report Date: Q3 FY2025

    This research report provides a detailed and data-backed analysis of Suditi Industries Ltd.’s Q3 FY2025 performance and outlook. 🚀

  • Asian Paints Q2 Analysis: 16.4% EBITDA Amid 6.7% Revenue Decline

    Asian Paints Ltd. – Best Share to buy today

    Asian Paints Ltd.

    Best Share to buy today.

    Ticker: ASIANPAINT Market Cap: ₹2,22,606 Cr. Current Price: ₹2,321

    Executive Summary

    Asian Paints Ltd., India’s largest and most iconic paint manufacturer, faces short-term challenges from muted consumer demand, margin pressures due to input cost inflation, and competitive intensity. However, its strong brand equity, strategic expansions, focus on innovation, and diversified product portfolio position it for sustainable long-term growth. The company’s ongoing backward integration and new growth verticals in home décor further solidify its trajectory as a market leader.

    Financial Performance Highlights (Q2 FY2025)

    Revenue: ₹8,256 Cr. (down 6.7% YoY)

    EBITDA Margin: 16.4% (↓ 530 bps YoY)

    PAT: ₹4,698 Cr. (down 7.52% YoY)

    Gross Margin: ↓ 280 bps YoY due to inflationary pressures

    H1 FY2025 Performance

    Volume Growth: 3.3%

    Value Decline: 4.8%

    EBITDA Margin: 18.5%

    Key Strategic Insights and Growth Drivers

    1. Product Innovation and Portfolio Expansion

    New Launches:

    • NeoBharat Range: Targeted at the bottom-of-the-pyramid segment
    • Ultima Protek: Incorporates cutting-edge graphene technology
    • Chroma Cosm: World’s largest color repository with 5,300 shades

    Revenue Contribution from New Products: 12% of total revenue

    2. Focus on Backward Integration

    • Dahej Plant (VAM-VAE): Reducing dependency on raw material imports
    • White Cement Unit (Fujairah): Supports diversification into high-margin products

    3. Rural and Urban Penetration

    Expanded retail touchpoints to 1.67 lakh outlets, with significant growth in Tier 3/4 towns and rural regions.

    4. Leadership in Home Décor

    Kitchen Segment: 9% growth in Q2 FY2025

    Bath Segment: 6% H1 growth

    5. Industrial Business Performance

    Segment Contribution: 6-7% of total revenue

    Q2 Growth: ~6%

    H1 Growth: ~8%

    Competitive Landscape and Market Dynamics

    Competitive Pressure

    Berger Paints gaining market share with rural focus

    New entrants offering competitive dealer margins

    Market Share Insights

    Leadership position maintained despite challenges

    Industrial segment contribution at ~6% vs competitors’ 20%-45%

    Valuation Analysis

    Current Metrics

    P/E Ratio: 47.4x

    ROE: 31.4%

    ROCE: 37.5%

    Dividend Yield: 1.43%

    DCF Valuation Assumptions

    • Volume growth: 8%-10% CAGR (5-year forecast)
    • EBITDA margin: 18%-20% post-H2 FY2025
    • WACC: 11%
    • Terminal growth rate: 4%

    Inherent Risks

    1. Macroeconomic Risks

    • Prolonged consumer demand weakness
    • Rural spending volatility

    2. Raw Material Costs

    • Crude oil derivatives dependency
    • Geopolitical impact on input costs

    3. International Operations

    • Forex losses (₹56 Cr. in Ethiopia)
    • Performance concerns in key markets

    Investment Recommendation

    Rating: Hold

    Target Price: ₹2,700–₹2,950

    Potential Upside: 16%-27% from current levels

    Asian Paints offers a robust long-term growth story backed by innovation, market leadership, and diversification. However, near-term pressures from weak demand, rising competition, and margin contraction warrant a cautious stance.

    Disclaimer: This report is for informational purposes only and does not constitute investment advice. Please consult a financial advisor or conduct your due diligence before making investment decisions.

  • IndiaMART Q2 FY25 Analysis: Stable 18% Revenue Growth | B2B Leader’s

    IndiaMART -Value Picks : Long-Term Multibagger Stocks: Investing in High potential stocks before value realisation

    IndiaMART InterMESH Limited

    Value Pick : Best Share buy today

    Executive Summary

    IndiaMART InterMESH Limited is a leading B2B marketplace in India. The company’s Q2 FY2025 results highlight modest revenue growth but challenges in collections growth due to customer churn, particularly in the silver category. Strategic initiatives are being taken to address these concerns. The competitive landscape remains dynamic, with IndiaMART focusing on maintaining its leadership position while navigating structural challenges in customer acquisition and retention.

    Key Metrics

    Market Cap
    ₹13,941 Cr
    Current Price
    ₹2,322
    Stock P/E
    32.4
    Dividend Yield
    0.86%
    ROCE
    23.9%
    ROE
    17.6%
    Sales Growth (3Y)
    21.4%
    Profit Growth (3Y)
    33.6%

    Financial Performance

    Q2 FY2025 Highlights:

    • Revenue: ₹348 Cr (YoY growth of 18%)
    • Collections: ₹356 Cr (YoY growth of 6%)
    • EBITDA Margin: 36%
    • Net Profit: ₹135 Cr (Consolidated)
    • Deferred Revenue: ₹1,483 Cr (+19% YoY)
    • Paying Suppliers: 218,000

    Future Growth Drivers

    Product Refinement

    Enhanced matchmaking algorithms and improved user engagement through measures like reducing supplier competition per inquiry (4 suppliers per buyer vs. 6 earlier).

    Technology Integration

    Initiatives such as leveraging WhatsApp for inquiries and implementing Real-Time Customer Solutions (RCS) have started contributing positively to unique business inquiries.

    Strategic Investments

    Focus on software-as-a-service (SaaS) offerings such as Busy Infotech and Livekeeping for SME clients. These tools are being integrated into IndiaMART’s platform to enhance value delivery.

    Capital Expenditure and Strategic Rationale

    Recent investments exceeding ₹600 Cr in strategic acquisitions and software integrations aim to diversify revenue streams and enhance platform stickiness for SME users. SaaS initiatives like Vyapar and Livekeeping are expected to generate synergies with IndiaMART’s core business.

    Competitive Landscape

    • Primary Competitors: Justdial, TradeIndia, and global giants like Amazon B2B
    • Key Advantage: First-mover advantage, strong cash reserves, and platform breadth
    • Challenges: Elevated competition from Justdial post-COVID and emergence of niche platforms

    Risks

    • Customer Churn: Persistent churn in the silver category could impact future revenue growth
    • Collection Growth: Slowing collection growth (5% YoY) may signal structural issues
    • Economic Environment: B2B market performance is tied closely to broader economic conditions
    • Competition: Aggressive customer acquisition by competitors could erode market share

    Valuation Estimate

    Using a P/E multiple of 30x (considering the industry average), the valuation per share based on an estimated FY2025 EPS of ₹75 is approximately ₹2,250. This aligns closely with the current market price, indicating a fairly valued stock with potential upside contingent on improved execution.

    Investment Thesis

    IndiaMART’s strong market position, robust financial health, and focus on strategic investments position it for sustained long-term growth. However, near-term challenges, particularly around customer churn and collection growth, warrant caution. Investors should monitor progress on operational improvements and management’s ability to execute its strategic initiatives.

    Conclusion

    Recommendation: Hold

    IndiaMART is a resilient market leader with promising growth initiatives. However, resolving churn issues and achieving double-digit collection growth are critical for re-rating.

    Disclaimer: This report is for informational purposes only and does not constitute financial advice. Investors should perform their own due diligence and consult financial advisors before making investment decisions.

  • Vedanta Ltd.: High Dividend Yield Stock with Strong Growth Potential

    Value Pick: Vedanta Ltd. Stock Analysis | Financial Markets Insight

    Value Pick: Best Share to Buy Today – Vedanta Ltd.

    Summary

    Vedanta Ltd., a diversified resources company, reported robust Q2 FY25 results, driven by operational efficiencies and strategic investments. The company has showcased strong financial growth while maintaining a focus on sustainability through renewable energy adoption and ESG initiatives.

    Key Metrics

    Market Cap
    ₹1,75,283 Cr
    Current Price
    ₹448
    High/Low
    ₹527/₹250
    Stock P/E
    17.0
    Book Value
    ₹95.9
    Dividend Yield
    9.70%
    ROCE
    20.9%
    ROE
    10.5%
    Debt
    ₹79,808 Cr
    Reserves
    ₹37,097 Cr
    Sales
    ₹1,44,448 Cr
    Profit after Tax
    ₹10,344 Cr
    Sales Growth (3Yrs)
    17.8%
    Profit Growth (3Yrs)
    -32.6%

    Future Growth Drivers

    1. Renewable Energy Adoption

    • Committed to 1,900 MW renewable energy capacity.
    • Partnering with Serentica Renewables for a long-term renewable energy supply, aligning with its net-zero carbon emissions goal.

    2. Operational Expansions

    • Aluminum: Lanjigarh refinery ramp-up (3.5 MTPA by FY26) and BALCO smelter expansion to 3.1 MTPA with a 90% focus on value-added products.
    • Zinc: Debari roaster (160 KTPA) and a new 0.5 MTPA fertilizer plant operational by FY26.
    • Oil & Gas: ASP injection projects to boost recovery by 10%, equating to ~250 million barrels over time.

    3. Production Ramp-Up

    • Record production in aluminum (609 KT in Q2) and zinc operations.
    • Iron ore production to achieve 11 MTPA target post-regulatory clearances.

    4. Demerger Process

    • Set for March 2025 completion, expected to unlock value in critical mineral segments.

    Capital Expenditure and Strategic Rationale

    • FY25 CAPEX: ₹5,209 Cr for power projects like the Athena 1,200 MW plant.
    • Strategic investments in refining capacity, value-added production, and energy efficiency aim to enhance profitability and market competitiveness.

    Financial Projections

    • FY25 EBITDA expected to reach record highs, supported by a robust H2 pipeline.
    • Net debt to EBITDA ratio improved to 1.49x, targeting <1x by FY26.
    • Strong free cash flow (₹8,525 Cr in Q2) ensures liquidity for growth projects.

    Competitive Landscape and Risks

    Strengths

    • Diversified commodity portfolio.
    • Industry-leading cost efficiencies in aluminum and zinc.
    • Strong ESG credentials with consistent recognition by S&P Global.

    Risks

    • High debt levels (₹79,808 Cr).
    • Global commodity price volatility.
    • Regulatory and environmental clearance delays for key projects.
    • Decline in promoter holding (-8.8% over 3 years).

    Valuation Estimate

    Using a blended valuation approach (DCF and EV/EBITDA multiples), Vedanta Ltd.’s intrinsic value ranges between ₹480-₹520 per share, reflecting a modest upside from current levels.

    Investment Thesis

    Vedanta is positioned as a strong dividend-yielding stock with growth potential driven by expansions in aluminum, zinc, and oil & gas. The demerger is a catalyst for unlocking value. However, investors should weigh the high debt burden and regulatory risks before committing.

    Disclaimer: This report is for informational purposes only and is not investment advice. Readers should conduct independent research or consult a financial advisor before making investment decisions.

  • Hindustan Zinc Limited: H1 FY25 Performance, Dividend lovers stock

    Hindustan Zinc Limited – Comprehensive Performance Report

    Value Pick – Best Stock to buy today

    Hindustan Zinc Limited

    Q2 & H1 FY25 Performance Report

    Executive Summary

    Hindustan Zinc Limited (HZL) demonstrated robust operational and financial performance in Q2 and H1 FY25, with record-breaking production metrics and strong profitability. Positioned as a global leader in zinc and silver production, HZL leverages integrated operations, cost leadership, and ESG initiatives to ensure long-term growth.

    Company Overview

    Hindustan Zinc Limited, a subsidiary of Vedanta Limited, is India’s largest and the world’s second-largest integrated zinc-lead producer. It is also the only silver producer through the primary route in India. With diversified operations, HZL continues to strengthen its position as a key player in global metal markets.

    Performance Highlights

    Production Metrics

    • Mined metal production in Q2 FY25: 256,000 tons (↑ 2% YoY)
    • Refined metal production: 262,000 tons (↑ 8% YoY)
    • Silver production: 184 tons (↑ 2% YoY)

    Financial Performance

    • Revenue Q2 FY25: ₹8,252 crores (↑ 22% YoY)
    • H1 FY25 revenue: ₹16,382 crores (↑ 16% YoY)
    • EBITDA margin: >50%
    • Net profit Q2 FY25: ₹2,327 crores (↑ 35% YoY)

    Cost Control

    Q2 cost of production (COP) stood at $1,071 per ton, the lowest in four years, driven by operational efficiencies and increased renewable energy usage.

    Key Metrics

    Market Cap
    ₹1,90,731 Cr.
    Current Price
    ₹451
    High / Low
    ₹808 / 285
    Stock P/E
    21.7
    Book Value
    ₹18.1
    Dividend Yield
    6.41%
    ROCE
    46.2%
    ROE
    55.2%
    Metric Value
    Face Value ₹2.00
    Debt ₹14,016 Cr.
    Reserves ₹6,797 Cr.
    No. Eq. Shares 423 Cr.
    Chg in Promoter Holding (3 Years) 0.01%
    Sales Growth (3 Years) 8.54%
    Profit Growth (3 Years) 0.24%
    Sales ₹31,232 Cr.
    Operating Profit Margin (OPM) 48.8%
    Quarterly Sales Variation 21.4%
    Profit After Tax (PAT) ₹8,797 Cr.

    Future Growth and Expansion Plans

    Expansion to 2 Million Tons

    • Plans to achieve 2 million tons annual mine run rate leveraging 30 million tons of metal-in-ore resources
    • Global contractors finalization by November 2024
    • Production ramp-up expected by FY27

    Fertilizer Plant

    • DAP/NPK fertilizer plant commissioning by Q3 FY26
    • Projected EBITDA contribution: ₹450-₹500 crores annually

    Renewable Energy Initiatives

    • Partnership with Serentica Renewables for 530 MW capacity
    • Target: 70% renewable energy usage
    • Expected annual carbon emissions reduction: 69%

    Market Outlook and Strategic Positioning

    • India projected to become third-largest zinc consumer by 2026
    • Hedging strategy: Zinc at $3,008 per ton, Silver at $32.26 per troy ounce
    • Strong market support from economic policies in China and U.S.

    Capex and Financial Projections

    • Focus on new roasting and fertilizer projects
    • Enhancement of mining infrastructure
    • Expected net debt reduction to ₹2,000 crores by March 2025

    ESG Initiatives

    • Recognition for tax transparency and ESG excellence
    • Pioneering all-women mine rescue teams
    • Zero hunger initiatives
    • Development of zinc-based battery technologies

    Risk Factors

    Commodity Price Volatility

    Fluctuations in global zinc, lead, and silver prices could impact margins.

    Regulatory Challenges

    Potential policy changes related to mining leases and environmental compliance.

    Operational Risks

    Safety incidents and technical challenges in projects like the fumer ramp-up.

    Disclaimer: This report is for informational purposes only and does not constitute investment advice. The information presented is based on publicly available data and company disclosures. Readers are advised to perform their own due diligence and consult a financial advisor before making investment decisions. Neither the author nor any affiliates accept liability for losses arising from the use of this report.
  • Value Pick: RVNL-Growth Projections, Capex Plans, and Investment Rationale for 2025

    RVNL Value Pick Best stock to buy today

    Rail Vikas Nigam Limited (RVNL)

    RVNL Value Pick Best stock to buy today

    Company Overview

    Rail Vikas Nigam Limited (RVNL) is a public sector enterprise under the Ministry of Railways, specializing in project implementation, planning, development, and execution of railway infrastructure projects. With a strong presence in India’s infrastructure growth story, RVNL remains a key player in railway modernization and expansion.

    Market Metrics

    Market Cap: ₹90,094 Cr

    Current Price: ₹432

    52-Week Range: ₹647 – ₹181

    Financial Ratios

    P/E: 70.4

    ROCE: 18.7%

    ROE: 20.4%

    Performance

    Sales: ₹20,310 Cr

    PAT: ₹1,280 Cr

    OPM: 5.66%

    Future Growth and Expansion Plans

    Management highlighted strategic focus areas, including new rail infrastructure projects, signaling and electrification initiatives, and international collaborations. RVNL plans a capex of approximately ₹7,000 Cr for FY25, focusing on high-speed rail corridors, station modernization, and green initiatives.

    SWOT Analysis

    Strengths

    • Strong government backing (72.8% holding)
    • Established project execution expertise
    • Robust order book

    Weaknesses

    • Recent decline in growth metrics
    • High P/E ratio (70.4)

    Opportunities

    • Metro and international market expansion
    • Government focus on rail projects
    • PPP model potential

    Threats

    • Rising private competition
    • Project execution delays
    • Government funding dependence

    Valuation and Projections

    Growth Projections

    Revenue CAGR (FY24-27): 15%

    PAT CAGR (FY24-27): 18%

    Target Price: ₹520

    Valuation Metrics

    EV/EBITDA: 25.8x

    P/B Ratio: 11.3x

    PEG Ratio: 3.9

    Disclaimer: This report is for informational purposes only and should not be considered as financial advice. Investors are advised to consult their financial advisors before making any investment decisions. The analysis is based on publicly available data and management commentary and may be subject to errors or omissions. Past performance is not indicative of future results.

  • Dolat Algotech: Unveiling 166% Sales Growth & Ambitious ₹5,000 Cr Expansion Plan

    Dolat Algotech Ltd – Financial Analysis

    Dolat Algotech Ltd

    Value Pick : Best Stock to buy today.

    Executive Summary

    Dolat Algotech Ltd, a leading technology-focused entity, has demonstrated robust growth with a remarkable 166% increase in sales and a 194% surge in profit in FY 2023-24. With a market capitalization of ₹2,300 crore and a stock P/E ratio of 9.28, the company is positioned attractively within its industry. Leveraging its high operational profit margin (OPM) of 77.4%, the company plans significant expansion supported by a proposed borrowing limit increase to ₹5,000 crore.

    Company Overview

    Business Focus

    Dolat Algotech specializes in technology and financial services, leveraging advanced algorithms to deliver superior operational performance. The company operates with a high level of governance and transparency, supported by an experienced board and management team.

    Key Metrics

    Market Cap

    ₹2,300 Cr.

    Current Price

    ₹131

    52-Week High/Low

    ₹186 / ₹59.2

    Dividend Yield

    0.19%

    ROCE

    27.7%

    ROE

    22.0%

    Financial Analysis

    Performance Overview (FY 2023-24)

    Revenue Growth

    • Consolidated revenue rose by 37.4% YoY to ₹3,314.82 million from ₹2,413.37 million in FY 2022-23
    • Standalone revenue increased by 41.3% to ₹2,173.55 million

    Profitability

    • Net profit (consolidated) grew to ₹1,577.51 million, a 35.6% YoY increase
    • Consolidated profit margin stood strong at 47.6%, supported by high OPM of 77.4%

    Balance Sheet Strength

    • Reserves stood at ₹791.75 crore, ensuring financial stability
    • Debt levels at ₹374 crore, with a manageable debt-to-equity ratio given robust cash flows

    Future Growth and Expansion

    Capex Plans

    The company’s proposed increase in borrowing limits to ₹5,000 crore underscores its aggressive expansion strategy. This capital will be directed towards:

    • Scaling operational capabilities
    • Enhancing technology infrastructure
    • Funding mergers and acquisitions to drive market share growth

    Industry Outlook

    The financial and technology sectors in India are poised for exponential growth, driven by increased digital adoption and financial inclusion initiatives. Dolat’s technological edge places it well to capitalize on these trends.

    Valuation Metrics

    P/E Ratio

    9.28

    Price-to-Book Value

    2.48

    ROCE

    27.7%

    ROE

    22.0%

    Risks and Opportunities

    Key Risks

    • Leverage Risk: Increased borrowing may elevate financial risk, especially in volatile market conditions
    • Regulatory Environment: Changes in technology and financial regulations could impact operations

    Opportunities

    • Expanding digital ecosystems offer substantial growth potential
    • Cost-effective operations with a high OPM provide a competitive edge

    Conclusion and Recommendations

    Recommendation

    Buy with a target price of ₹165, representing a potential upside of ~26% from the current price (₹131).

    Investment Horizon

    Medium to long-term (3-5 years)

    Disclaimer

    This report is for informational purposes only and does not constitute financial advice. Investors are advised to perform their own due diligence or consult a financial advisor before making investment decisions. The author or associated entities are not responsible for any direct or indirect losses incurred based on this report.

  • Value Picks fin.ctoi.in
    Value Picks fin.ctoi.in
    Value Picks

    Dont Miss our Value picks

    SUBSCRIBE TO OUR NEWSLETTER to Get short term, long term and multi-bagger

    We don’t spam! Read our privacy policy for more info.