Q3 witnessed a regulatory-induced revenue hit – management estimates an 18% combined impact (13–14% from true-to-label pricing changes plus an additional 3–4% from adjustments in expiry groupings).
Reported consolidated profit after tax from continuing operations declined by approximately 33.5% sequentially (with a 16.8% drop when adjusted for ancillary income).
Key Operational Metrics:
Total Client Base increased to 29.5 million (up 7.4% QoQ).
NSE Active Client Base reached 7.8 million (up 5.5% QoQ).
Order volumes declined by 13.8% QoQ, reflecting softer trading activity amid regulatory changes.
Despite short-term headwinds, customer acquisition remains robust with quarterly growth rates around 40–45%.
Financial Performance:
Q3 gross revenues were slightly lower due to reduced ancillary income and market-driven softer volumes.
Broking revenue, which contributes about 65% of total income, was down by roughly 12.5% sequentially. • Adjustments in charges (for example, on non-cash collateral) helped partly offset the regulatory impact.
Future Growth Plans & Strategic Expansions
Digital & Product Innovation:
Continued rollout of the Super App platform aimed at creating a holistic financial ecosystem—integrating equity broking, mutual fund distribution, insurance, credit products, and wealth management. • Recent launches include the beta insurance journey, the mutual fund platform (with regulatory approvals secured), and the introduction of the ‘Ionic Wealth’ brand to capture the growing wealth management opportunity.
Expanding Revenue Streams:
Diversification into asset management and credit distribution (with cumulative personal loans disbursed around ₹600 crores so far) reinforces its long-term play. • The company is strengthening its distribution network, especially in Tier 2 and Tier 3 markets, where 88% of new clients originate.
Technology & Analytics Investment:
Significant CAPEX is being directed toward enhancing its tech stack, personalization algorithms, and data analytics capabilities. • This investment is expected to lower client acquisition costs over time while increasing lifetime value (LTV).
Financial Projections & Long-Term Returns
Short-to-Medium Term (Next 5 Years):
Normalization of client behavior and regulatory impacts are expected to reverse the temporary revenue headwinds. • With robust digital adoption and deeper product integration, revenue growth could stabilize in the mid-to-high double digits. • Margin improvements are anticipated as the company leverages economies of scale across its digital model.
Long-Term Outlook (10–20 Years):
As India’s capital markets mature, Angel One’s expansion into comprehensive financial services positions it well for substantial growth. • With current valuation metrics—trading at a P/E of 15.6, ROE at 43.3%, and ROCE at 38.7%—the company appears attractively priced relative to its earnings power. • Long-term projections assume continued market penetration, higher AUM from the wealth management segment, and potential reinvestment returns that could deliver attractive total shareholder returns over 15 to 20 years.
Valuation & Credit Ratings:
The stock’s valuation appears fair on a P/E basis, especially given its strong profitability ratios and market position. • No significant changes in credit agency ratings were disclosed during the conference call, implying stable credit metrics in the near term.
Key Metrics Snapshot
Market Cap: ₹20,929 Cr.
Current Price: ₹2,318
P/E Ratio: 15.6
Book Value: ₹585
Dividend Yield: 1.49%
ROCE / ROE: 38.7% / 43.3%
Debt / Reserves: ₹3,135 Cr. / ₹5,188 Cr.
Sales & Profit Growth (3-Year): ~49.1% and ~55.5% respectively
Promoter Holding: 35.6%
Investment Thesis & Risks
Investment Case:
Resilient Business Model: Angel One’s diversified revenue streams—from equity broking to emerging wealth and asset management—offer long-term upside potential. • Digital Edge & Client Growth: Aggressive digital initiatives and a growing client base (particularly in underpenetrated markets) provide a strong competitive moat. • Attractive Valuation: With high profitability ratios and moderate valuation multiples, the stock is positioned well relative to its growth prospects.
Key Risks:
Regulatory Headwinds: Ongoing regulatory changes may continue to exert short-term pressure on revenues. • Market Volatility: Fluctuations in trading volumes and investor sentiment can impact broking income. • Execution Risks: Successful integration of new business segments (wealth and asset management) remains critical to achieving long-term projections.
Conclusion & Disclaimer
Angel One Limited is navigating a short-term revenue impact due to regulatory changes but remains fundamentally strong with a robust client base, diversified product offerings, and significant investments in technology and analytics. Its expansion into wealth management and credit distribution is expected to drive long-term growth, potentially offering attractive returns over the next 5, 10, 15, and 20 years. Valuation metrics such as a P/E of 15.6 and high ROE/ROCE underscore its earnings efficiency and market position.
Disclaimer: This report is provided for informational purposes only and does not constitute investment advice. Investors should conduct their own research and consider their risk tolerance before making any investment decisions.
Rain Industries, a globally diversified producer operating across Carbon, Cement, and Advanced Materials, reported mixed quarterly performance. While revenue pressure from subdued pricing affected certain segments, the company delivered a strong turnaround in adjusted EBITDA, driven by cost efficiencies and volume recoveries.
The management’s forward-looking initiatives in capacity expansion, raw material diversification, and R&D innovation position Rain well for long‑term value creation.
Quarterly Performance Overview
Revenue & EBITDA
Q3 Revenue
₹36.76B
Adjusted EBITDA
₹3.90B
EBITDA Margin
10.6%
Loss Per Share
-₹3.60
Segment Insights
Carbon Segment
Benefited from higher utilization of Indian calcination facilities and effective cost-saving measures, partially offsetting lower product realisations.
Advanced Materials
Recorded volume-driven revenue growth despite lower average prices due to commodity softness.
Cement
Underperformed owing to weaker realisations and volume declines amid market consolidation, though management is optimistic about a turnaround through government-driven demand improvements.
Future Growth and Expansion Plans
Capacity and Utilization
Plans to further enhance carbon segment volumes through increased capacity utilization and the reintegration of its CPC blending strategy.
Raw Material Strategy
Diversifying sources to secure key inputs like GPC and Coal Tar, mitigating supply constraints.
Innovation and R&D
Strategic joint development initiatives—bolstered by government support for the North American Innovation Center—aim to advance battery anode and energy storage materials.
Cement Outlook
Anticipated recovery driven by market consolidation and government investments is expected to improve both price realisations and volumes.
The company’s strategic focus on innovation and diversification positions it well to capitalize on emerging opportunities in high-growth segments like battery and energy storage materials.
Financial Projections & Valuation
Projection Assumptions
A conservative EBITDA growth trajectory is assumed—approximately 6% CAGR over the next 5 years, moderating gradually in subsequent periods—as cost efficiencies and operational improvements take effect.
Return Projections
Time Horizon
Projected Returns
5 Years
Annualized returns in the vicinity of 12–15%
10 Years
Potential cumulative returns of 2–3× current valuations
15 Years
Prospects for a 3–4× multiple
20 Years
Long-term upside in the range of 4–5×, subject to macroeconomic and industry factors
Valuation Estimate
Based on a current EV/EBITDA multiple near 12× and anticipated margin expansion, a medium-term target multiple of 14–16× appears justified, implying an upside potential of roughly 20–30% from current levels.
Management and Strategic Positioning
An experienced international management team underpins the company’s strategic direction.
Long-standing relationships with key raw material suppliers and global customers provide a competitive advantage.
A strategic pivot from low-margin products toward a more favorable product mix, supported by robust R&D, further strengthens its market position.
Investment Thesis
Rain Industries offers a compelling long‑term investment case driven by:
Operational Resilience
Demonstrated ability to enhance margins through volume growth and cost management.
Growth Catalysts
Strategic capacity expansions, raw material diversification, and innovative R&D initiatives targeting high-growth segments like battery and energy storage materials.
Balanced Risk/Reward
Despite short-term challenges in the cement segment, the company’s diversified portfolio and proactive strategic initiatives position it to capture market improvements and deliver attractive risk-adjusted returns over the next 5, 10, 15, and 20 years.
The company’s ability to navigate through challenging market conditions while maintaining strategic focus on long-term growth opportunities reinforces our positive outlook on its investment potential.
Disclaimer
This report is provided for informational purposes only and does not constitute investment advice. Investors should perform their own due diligence and consider their individual risk tolerance before making any investment decisions.
D.P. Abhushan Limited has emerged as a standout performer in the Indian jewelry market, delivering exceptional financial results in Q3 FY25. With a strategic focus on high-margin wedding and diamond jewelry, the company demonstrates robust growth potential and a compelling investment narrative.
Q3 FY25 Financial Performance Highlights
Key Financial Metrics
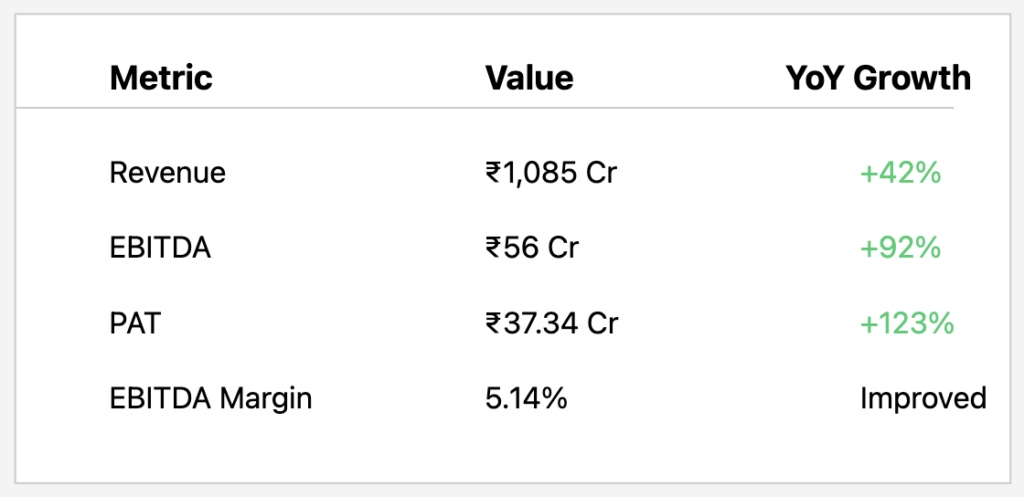
Revenue: ₹1,085 crores (42% YoY growth)
EBITDA: ₹56 crores (92% YoY growth)
PAT: ₹37.34 crores (123% YoY growth)
EBITDA Margin: 5.14%
PAT Margin: 3.4%
Revenue Composition
Gold Jewelry: 93%
Diamond Jewelry: 5%
Silver Jewelry: 2%
Growth Strategy and Expansion Plans
Store Network Expansion
The company aims to:
Double company-owned store network in 2-3 years
Open approximately 10 new stores in Tier 2 and Tier 3 cities
Primary allocation: Inventory funding and new showroom development
Financial Ratios and Metrics
P/E Ratio: 28.7
ROCE: 27.1%
ROE: 29.5%
Market Capitalization: ₹2,979 crores
Debt/Reserves: ₹186 crores / ₹315 crores
Promoter Holding: 73.8%
Long-Term Growth Projections
Revenue Growth Outlook
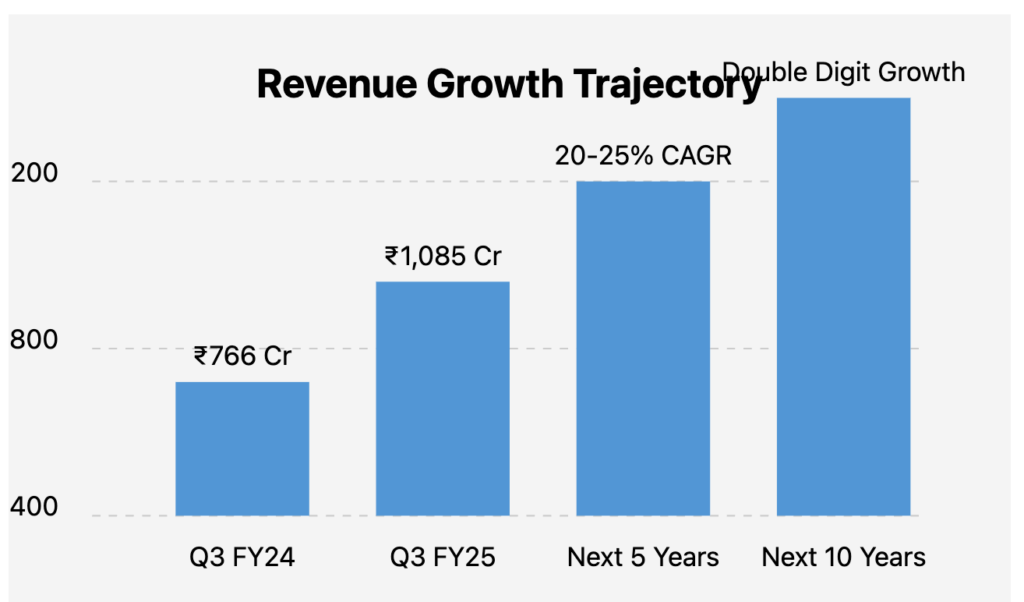
Management Guidance: 20-25% growth in next fiscal year
9-month results show growth up to 45%
Potential growth scenarios:
5-year horizon: High single-digit growth
10-year horizon: Low double-digit growth
15-20 year horizon: Substantial market share expansion
Strategic Competitive Advantages
Focus on high-margin product segments
Customized, ethically sourced jewelry
Efficient logistics and geographic proximity of stores
Potential margin improvement of 20-25% in coming years
Risk Factors
Gold Price Volatility
Execution Risk in Store Expansion
Increasing Market Competition
Potential Margin Pressure
Valuation Considerations
Current P/E Ratio: 28.7
Reflects market growth expectations
No significant credit rating changes mentioned
Strong balance sheet with moderate debt
Investment Thesis
Bull Case
Rapid store expansion
Growing organized jewelry market
Strong margin improvement potential
Capturing share of ₹10 lakh crore Indian wedding market
Bear Case
Commodity price fluctuations
Execution challenges in new markets
Increasing competitive pressures
Conclusion
D.P. Abhushan Limited presents a compelling investment opportunity in the Indian jewelry market, backed by strong financial performance, strategic expansion, and a focus on high-margin product segments.
Disclaimer: This analysis is for informational purposes only. Investors should conduct independent research and consult financial advisors before making investment decisions.
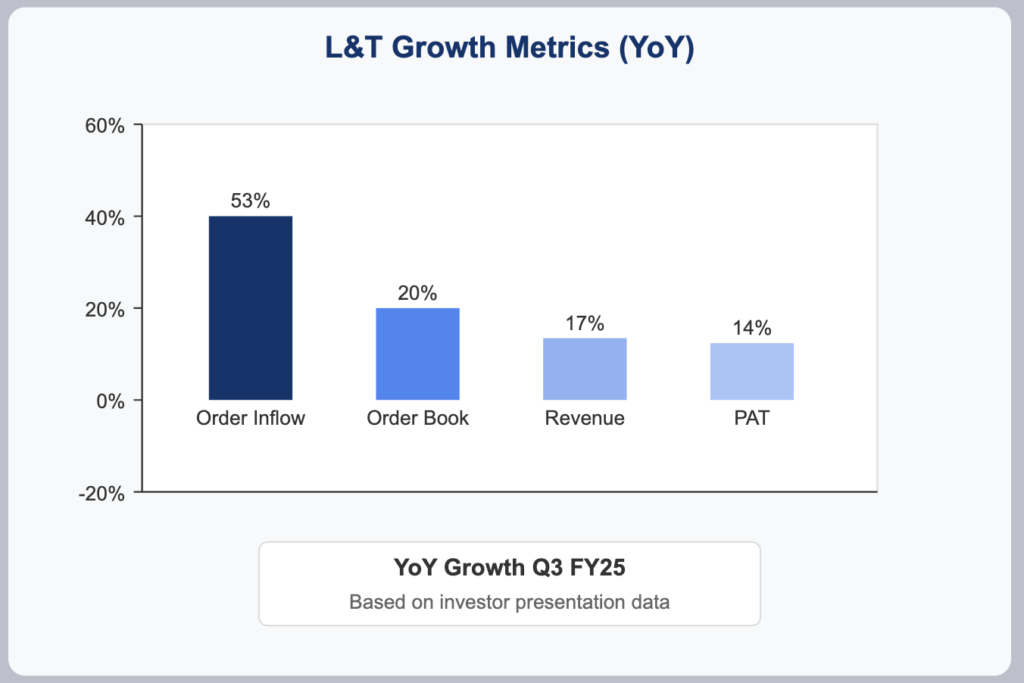
Larsen & Toubro Limited has posted exceptional results for Q3 FY25, achieving its highest-ever quarterly order inflow at ₹1,160 billion—representing a remarkable 53% year-on-year increase. The company’s order book has expanded by 20% to reach nearly ₹5.64 trillion, providing strong revenue visibility across its diversified business segments including Infrastructure, Energy Projects, and Hi-Tech Manufacturing. Despite challenging macroeconomic conditions, L&T has demonstrated solid execution capabilities while strategically positioning itself in high-growth sectors such as green energy, digital transformation, and semiconductor design.
Q3 FY25 Results: Breaking Records
Order Inflows & Book
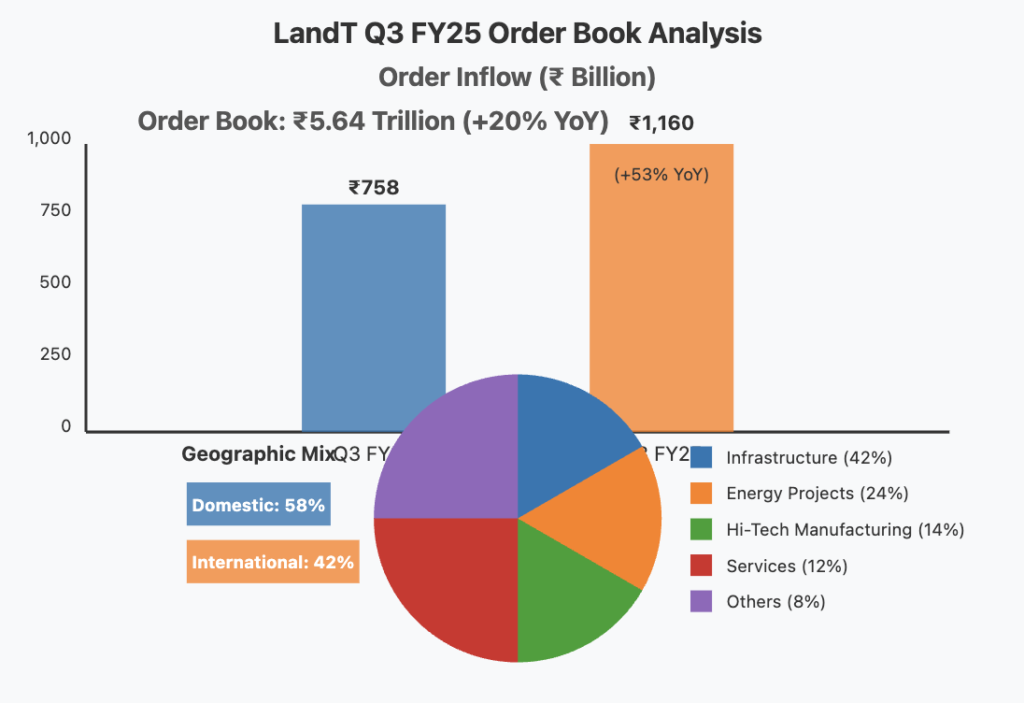
Q3 order inflows: ₹1,160 billion (53% YoY increase)
Order book: ₹5.64 trillion (20% YoY increase)
Geographic mix: 58% domestic, 42% international
The substantial order growth was primarily driven by major contracts in Infrastructure, Hydrocarbon, CarbonLite Solutions, and Precision Engineering sectors, establishing a strong foundation for future revenue growth.
Revenue & Profitability
Group revenues: ₹647 billion (17% YoY growth)
Consolidated PAT: ₹33.6 billion (14% YoY growth)
Projects & Manufacturing margins: Stable at 7.6%
Improved treasury operations and timely project billing contributed significantly to the profit growth, while margin variations reflected differing revenue mix and operating leverage across segments.
Segment Performance Analysis
Infrastructure
The Infrastructure segment maintained steady execution with balanced contribution from both domestic and international projects. The segment continues to be a cornerstone of L&T’s business portfolio, benefiting from increased infrastructure spending in India and Middle Eastern markets.
Energy Projects
This segment saw significant traction with ultra-super critical thermal power plant orders and a mega onshore hydrocarbon contract. While margins are still evolving as projects progress through various execution thresholds, the segment shows promising growth potential.
Hi-Tech Manufacturing
The segment maintained strong momentum with repeat orders, including the notable K9 Vajra repeat order, alongside several international deals that have strengthened the order book and diversified revenue streams.
Key Financial Metrics
Market Cap: ₹4,69,753 Cr
Current Price: ₹3,416
P/E Ratio: 33.9
Dividend Yield: 0.82%
ROE: 14.7%
ROCE: 13.4%
Debt: ₹1,26,183 Cr
Reserves: ₹88,955 Cr
Future Growth & Expansion Plans
Strategic Initiatives & Investments
Green Energy & Hydrogen
L&T Energy Green Tech has secured a significant 90,000 MTPA green hydrogen capacity order, which comes with incentives potentially totaling around ₹300 crores over three years. This positions L&T advantageously in the rapidly growing green energy sector.
Digital & IT Expansion
The company’s IT subsidiaries, LTIMindtree and LTTS, have recorded their highest-ever deal wins, including the strategic acquisition of Silicon Valley-based Intelliswift for USD 110 million. These moves strengthen L&T’s capabilities in software product development, data analytics, and artificial intelligence.
Capex Focus
L&T continues to invest substantially in forward-looking sectors such as green energy, data centers, and semiconductor design. These investments are expected to begin contributing meaningfully to earnings in the next strategic cycle (FY27–FY31).
Growth Strategy
The company’s diversified order pipeline, comprising significant domestic and international opportunities, supports expectations for near-term revenue growth and margin improvement. Ongoing large contracts, particularly in the Projects & Manufacturing portfolio, are anticipated to drive sustained top-line expansion.
L&T is also exploring new avenues in semiconductor design and digital transformation, with potential entry into additional value chains if initial ventures prove successful.
Expense Analysis & CAPEX Insights
Expense Trends
Manufacturing & Construction Costs: Increased due to higher activity levels and projects with longer execution timelines
Staff Costs: Rising in line with workforce expansion and regular salary increases
SG&A and Depreciation: Reflect ongoing execution ramp-up and recent capital investments
CAPEX & Growth Strategy
L&T is reinvesting a significant portion of its free cash flow to expand capacity in emerging sectors like green energy, digital infrastructure, and semiconductor design. This strategic allocation of capital aims to enhance earnings potential and competitive positioning over the FY27-FY31 cycle.
Bull Case vs. Bear Case
Bull Case
Continued robust order inflows driven by infrastructure spending in India and the Middle East
Successful execution of the existing ₹5.64 trillion order book leading to strong revenue growth
Strategic investments in green energy and digital transformation yielding higher margins
Expansion into high-growth sectors creating new revenue streams
Margin improvement through better project execution and operating leverage
Bear Case
Project delays or cost overruns affecting margins
High P/E ratio of 33.9 suggesting elevated market expectations
Potential challenges in international markets due to geopolitical uncertainties
Competition intensifying in core segments
Working capital challenges if project execution or payment cycles lengthen
Long-Term Projections
5-Year Outlook
Revenue projected to grow at or above current guidance (15%+ annual growth)
Margin stabilization expected as execution of mega projects progresses
Efficiency gains anticipated from improved working capital management and reduced financing costs
10- to 20-Year Outlook
L&T’s strategic diversification into high-growth areas positions the company for long-term success. While precise numerical projections depend on macroeconomic variables, qualitative expectations include:
Sustained top-line expansion driven by infrastructure development in core markets
Incremental improvements in profitability as project execution enhances and digital/technology investments mature
Long-term total returns potentially attractive relative to current valuation
Valuation & Credit Rating Considerations
Valuation Metrics
With a P/E of 33.9 and a book value of ₹649, L&T is positioned as a growth-oriented investment. The current valuation reflects high market expectations for future performance.
Dividend History and Yield
The company maintains a moderate dividend yield of 0.82%, typical for a capital-intensive conglomerate prioritizing reinvestment in growth opportunities.
Credit Perspective
No significant changes in credit agency ratings were reported during Q3 FY25. The company’s stable working capital improvements and balanced debt-reserve profile support a resilient credit outlook.
Conclusion
Larsen & Toubro’s Q3 FY25 performance demonstrates the company’s strong execution capabilities and strategic vision. The record-breaking order inflow, robust order book, and diversified revenue segments offer a compelling near-term outlook, while strategic investments in future-focused sectors establish the foundation for long-term growth.
Investors should note the elevated valuation multiples and moderate dividend yield, which reflect market expectations for sustained growth. As L&T continues to execute its strategic plan and capitalize on emerging opportunities, it remains well-positioned to deliver value to shareholders over the long term.
Disclaimer: This article is not investment advice and should not be taken as a recommendation to buy or sell securities. Investors should conduct their own due diligence and consider their financial objectives before making any investment decisions.
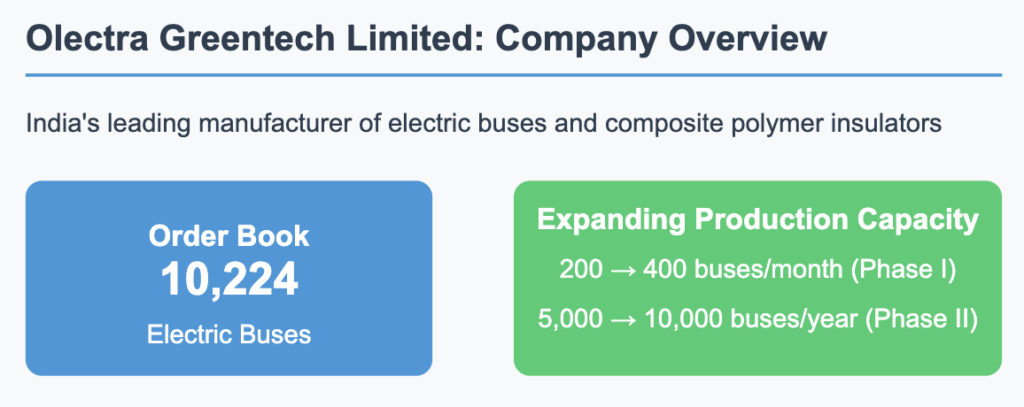
Olectra Greentech Limited stands at the forefront of India’s electric vehicle revolution as the country’s leading manufacturer of electric buses and composite polymer insulators. With a robust order book of 10,224 electric buses and aggressive capacity expansion plans, Olectra is strategically positioned to capitalize on India’s growing commitment to sustainable transportation solutions. This report analyzes the company’s Q3 FY2025 performance, growth trajectory, and long-term investment potential.
Q3 FY2025 Financial Performance
Q3 FY2025 Financial Performance
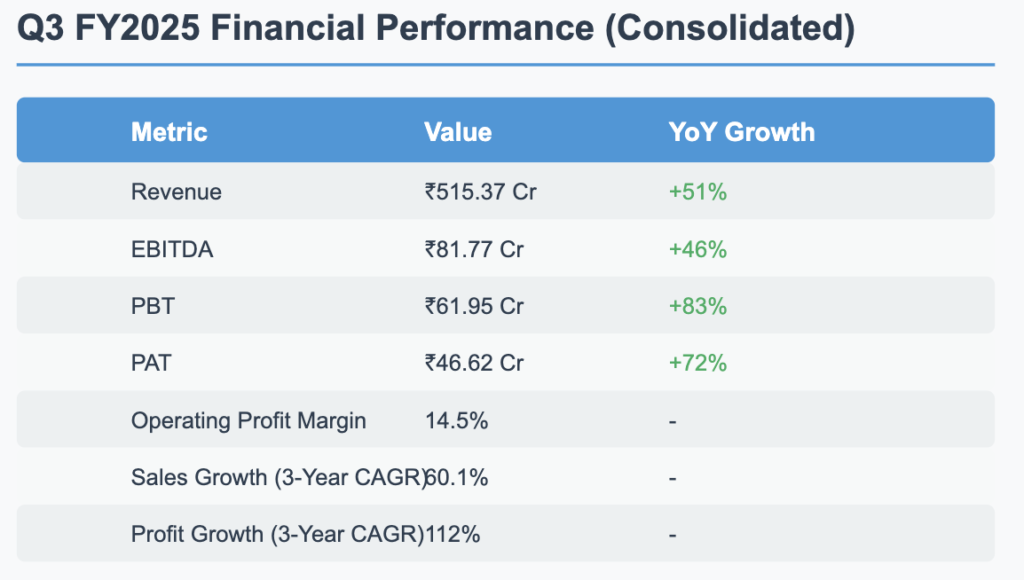
Olectra Greentech delivered an exceptional financial performance in Q3 FY2025, demonstrating the company’s strong growth momentum and increasing market dominance in the electric bus segment. The company reported consolidated revenue of ₹515.37 crore, representing a robust year-over-year growth of 51%. This performance was primarily driven by increased deliveries in the EV division, which contributed ₹459.78 crore to the total revenue, while the Insulator division added ₹4.7 crore.
Profitability metrics showed significant improvement, with EBITDA reaching ₹81.77 crore (+46% YoY) and PAT soaring to ₹46.62 crore (+72% YoY). The company maintained a healthy operating profit margin of 14.5%, indicating efficient cost management despite rapid expansion. The impressive three-year CAGR of 60.1% for sales and 112% for profits underscores Olectra’s consistent execution and growing market acceptance of its products.
Growth Plans & Expansion
Growth Plans & Expansion
Capacity Expansion
Olectra Greentech is embarking on an ambitious capacity expansion program to meet the growing demand for electric buses in India. The expansion is structured in two phases:
Phase-I: Increasing production capacity from 200 to 400 buses per month
Phase-II: Enabling production of 5,000 buses annually, with plans to further scale up to 10,000 buses per year
To fund this expansion, the company is investing ₹750 crore in capital expenditure, financed through a combination of ₹500 crore in debt and internal accruals. This strategic investment will significantly enhance Olectra’s manufacturing capabilities, allowing it to efficiently execute its growing order book.
Technology Innovation
Olectra is not just expanding capacity but also investing in cutting-edge technology to maintain its competitive edge:
Blade Battery Technology: The company has introduced this advanced battery technology to improve energy efficiency, safety features, and charging speed of its electric buses.
Battery Energy Storage Systems (BESS): Exploring investments in BESS represents a forward-looking approach to diversify its product portfolio and address the broader energy storage market.
Order Book & Execution Strategy
Order Book & Execution Strategy
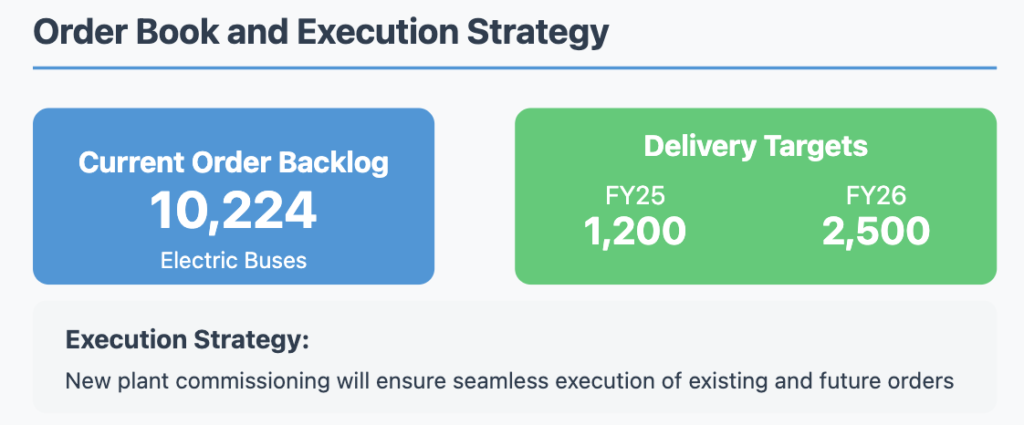
With a substantial backlog of 10,224 electric buses, Olectra has a clear visibility of future revenue. The company has set ambitious delivery targets of 1,200 buses in FY25 and 2,500 buses in FY26. The commissioning of new manufacturing facilities is strategically timed to ensure seamless execution of both existing and upcoming orders, mitigating potential production bottlenecks.
Future Financial Projections & Returns
Future Financial Projections
Short-Term (1-3 Years)
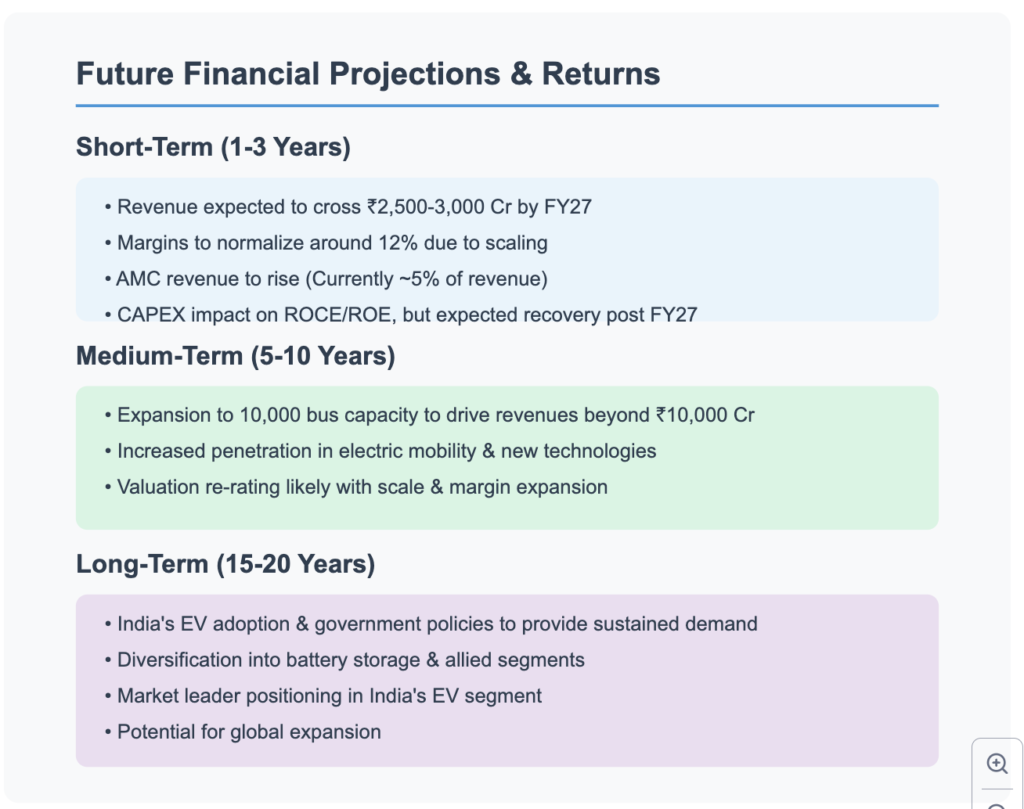
Olectra is positioned for substantial growth in the near term, with revenue projected to exceed ₹2,500-3,000 crore by FY27. While operating margins are expected to normalize around 12% due to scaling effects, the company’s Annual Maintenance Contract (AMC) revenue stream is anticipated to grow from its current level of approximately 5% of total revenue.
The significant CAPEX investment may temporarily impact return metrics like ROCE and ROE; however, these are expected to recover post-FY27 as the new capacity begins to generate sustainable returns.
Medium-Term (5-10 Years)
The medium-term outlook is particularly promising, with the expansion to 10,000 bus manufacturing capacity driving annual revenues beyond ₹10,000 crore. Increased penetration in the electric mobility sector, coupled with diversification into new technologies like BESS and charging infrastructure, will create multiple growth avenues.
As the company achieves scale and potentially expands its margins, a valuation re-rating is likely, providing substantial returns to long-term investors.
Long-Term (15-20 Years)
The long-term investment thesis for Olectra is underpinned by India’s accelerating EV adoption trajectory and supportive government policies. The company is strategically positioning itself to benefit from these secular trends through:
Diversification into battery storage and allied segments
Cementing its market leadership in India’s EV segment
Exploring potential global expansion opportunities
Key Metrics & Valuation Analysis
Key Metrics & Valuation
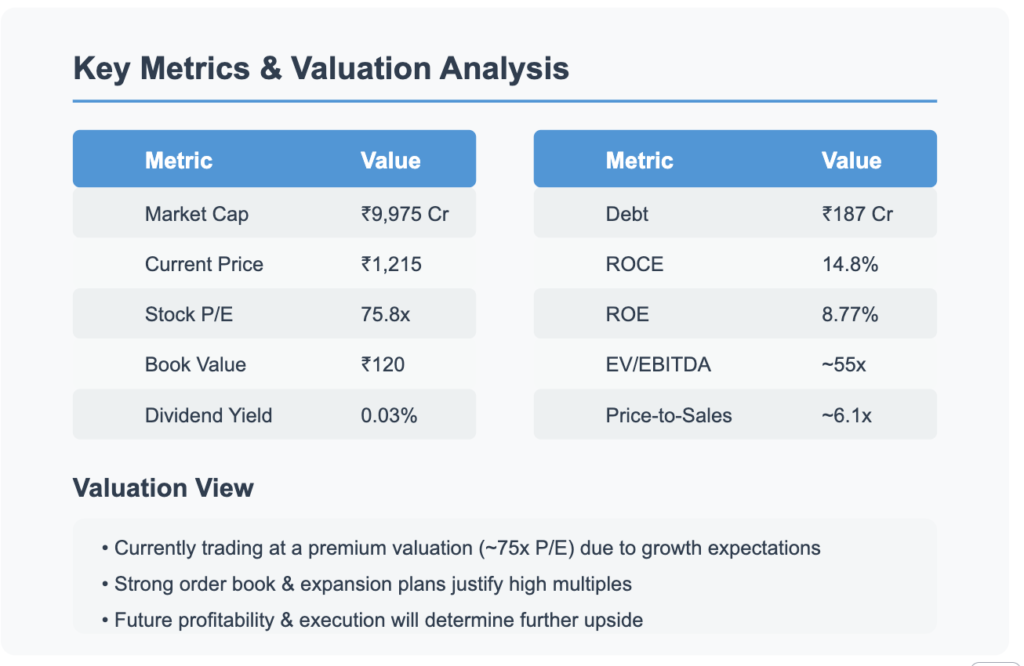
Olectra Greentech currently trades at premium valuations, with a P/E ratio of 75.8x and an EV/EBITDA multiple of approximately 55x. These elevated multiples reflect the market’s optimistic outlook on the company’s growth potential in the rapidly expanding electric mobility sector. Key financial metrics include:
Market Capitalization: ₹9,975 crore
Current Price: ₹1,215
Book Value: ₹120
Debt: ₹187 crore (planned increase by ₹500 crore for CAPEX)
ROCE: 14.8%
ROE: 8.77%
Price-to-Sales Ratio: ~6.1x
Dividend Yield: 0.03% (low payout as the company prioritizes reinvestment for growth)
While the valuation appears stretched by conventional metrics, the strong order book and ambitious expansion plans provide a significant runway for growth that could justify these premium multiples. However, future performance will heavily depend on successful execution of capacity expansion and maintaining profRetry
Claude hit the max length for a message and has paused its response. You can write Continue to keep the chat going.
Risks & Challenges
Risks & Challenges
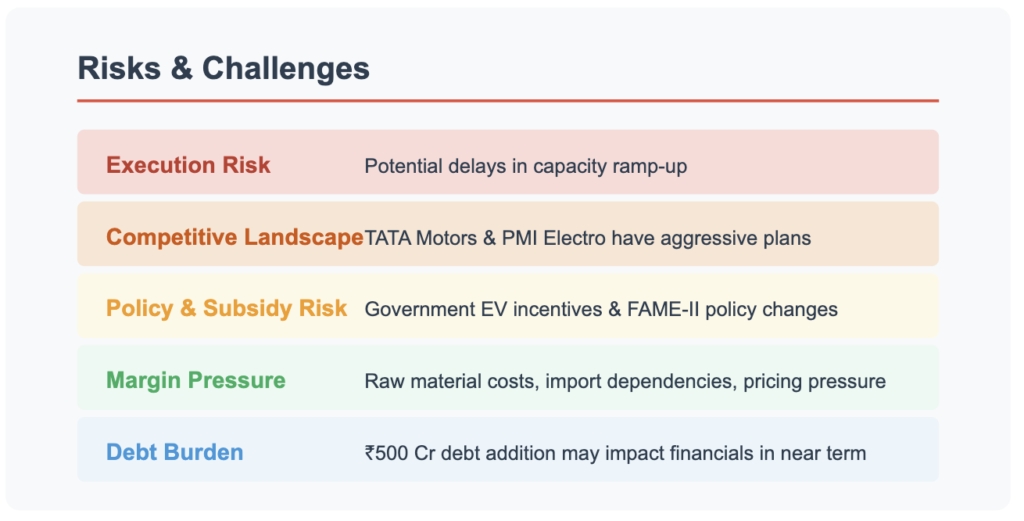
While Olectra Greentech presents a compelling growth story, investors should be mindful of several key risks:
Execution Risk: The ambitious capacity expansion plan could face delays or cost overruns, potentially affecting delivery timelines for the large order book.
Competitive Landscape: Major players like TATA Motors and PMI Electro are aggressively expanding their electric bus portfolios, which could intensify pricing pressure and competition for new orders.
Policy & Subsidy Risk: Changes in government EV incentives or FAME-II policy could impact demand dynamics and profitability.
Margin Pressure: Fluctuations in raw material costs, import dependencies for critical components, and competitive pricing pressure could constrain margins.
Debt Burden: The addition of ₹500 crore in debt for CAPEX could temporarily strain the balance sheet and impact near-term financial metrics.
Credit Rating & Dividend Outlook
Olectra Greentech has not reported any significant changes in its credit rating. The company maintains a conservative dividend policy with a yield of just 0.03%, as it prioritizes reinvesting capital into its growth initiatives rather than distributing profits to shareholders.
Investment Decision Summary
Investment Decision Summary
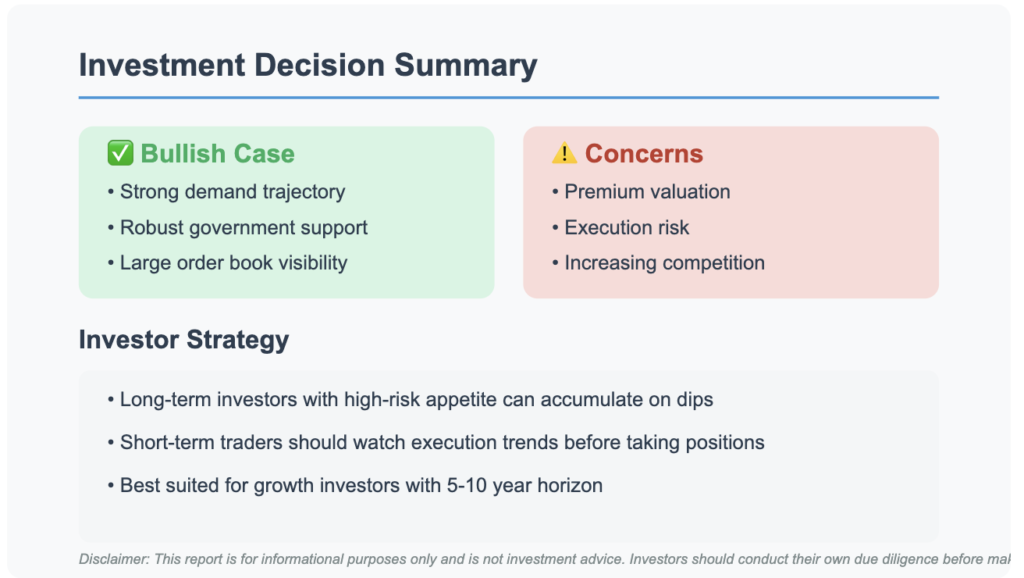
Bull Case
Olectra is riding the strong demand wave for electric buses in India, supported by favorable government policies and initiatives
The substantial order book of 10,224 buses provides excellent revenue visibility
Technology innovations and capacity expansion position the company for sustainable long-term growth
First-mover advantage in a rapidly growing market segment
Bear Case
The current valuation (75.8x P/E) is at a significant premium and may not be sustainable if execution falters
Planned debt addition of ₹500 crore could strain near-term financials
Increasing competition from established players like TATA Motors could pressure margins
Dependency on government policies and subsidies creates regulatory risk
Investor Strategy
Olectra Greentech represents an attractive investment opportunity for growth-oriented investors with a 5-10 year time horizon and high-risk tolerance. The company’s positioning in India’s rapidly expanding electric mobility sector, coupled with its strong order book and expansion plans, provides a solid foundation for long-term growth.
Long-term investors with high-risk appetite can consider accumulating positions on market dips
Short-term traders should closely monitor execution trends and quarterly delivery numbers before establishing positions
Income-focused investors may find the stock less attractive due to its minimal dividend yield (0.03%)
The stock is best suited for portfolio allocation in the high-growth, high-risk segment, with investors prepared to weather potential volatility as the company executes its ambitious expansion plans.
Conclusion
Olectra Greentech Limited stands at an inflection point in its growth journey, with Q3 FY2025 results highlighting its accelerating momentum in India’s electric bus market. The company’s aggressive capacity expansion, technological innovations, and robust order book position it favorably to capitalize on the structural shift toward sustainable transportation solutions in India.
While the premium valuation reflects high growth expectations, successful execution of the capacity expansion plan and maintaining healthy margins will be critical to delivering shareholder value. Investors with a long-term horizon and appetite for growth stocks should consider Olectra Greentech as a potential beneficiary of India’s electric mobility revolution.
Disclaimer: This report is for informational purposes only and is not investment advice. Investors should conduct their own due diligence before making investment decisions.
Mazagon Dock Shipbuilders Limited (MAZDOCK), a Navratna Defense Public Sector Undertaking with an established reputation in constructing submarines, destroyers, and frigates, has delivered impressive Q3 FY25 results. The company demonstrated solid operational metrics and indicated promising long-term growth potential supported by a secure order book, substantial backlog, and strategic capital expenditure plans aimed at expanding capacity and upgrading technology.
Key Company Metrics
Q3 FY25 Results & Performance Analysis
Revenue & Earnings Growth
The Q3 FY25 figures demonstrate robust top-line execution with revenue growth consistent with Mazagon Dock’s historical performance. The company maintained focus on order execution with significant contributions from completed projects, particularly Project 15 Bravo. Notable reversals of D-448 liabilities have additionally boosted profitability during this quarter.
Margin Performance
While current profit before tax (PBT) margins exceed industry-normalized ranges, management has provided guidance that over the medium term, normalized margins are expected to settle in the 12-15% range (PBT basis). This adjustment is anticipated as legacy high-margin orders are gradually phased out and new orders come into the pipeline.
Expense Analysis
Expense Management
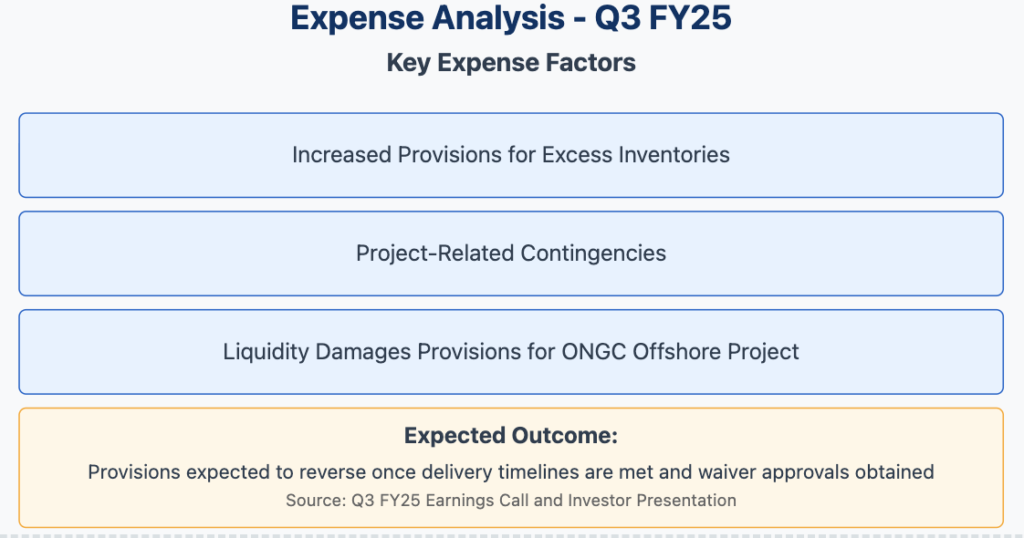
The company reported increased provisions during the quarter, primarily related to:
Excess inventories
Project-related contingencies
Liquidity damages provisions for the ONGC offshore project
Management indicated that these provisions are expected to reverse once delivery timelines are met and necessary waiver approvals are obtained, potentially boosting future profitability.
Future Growth Plans & Expansion Strategy
CAPEX & Growth Strategy
CAPEX & Infrastructure Upgrades
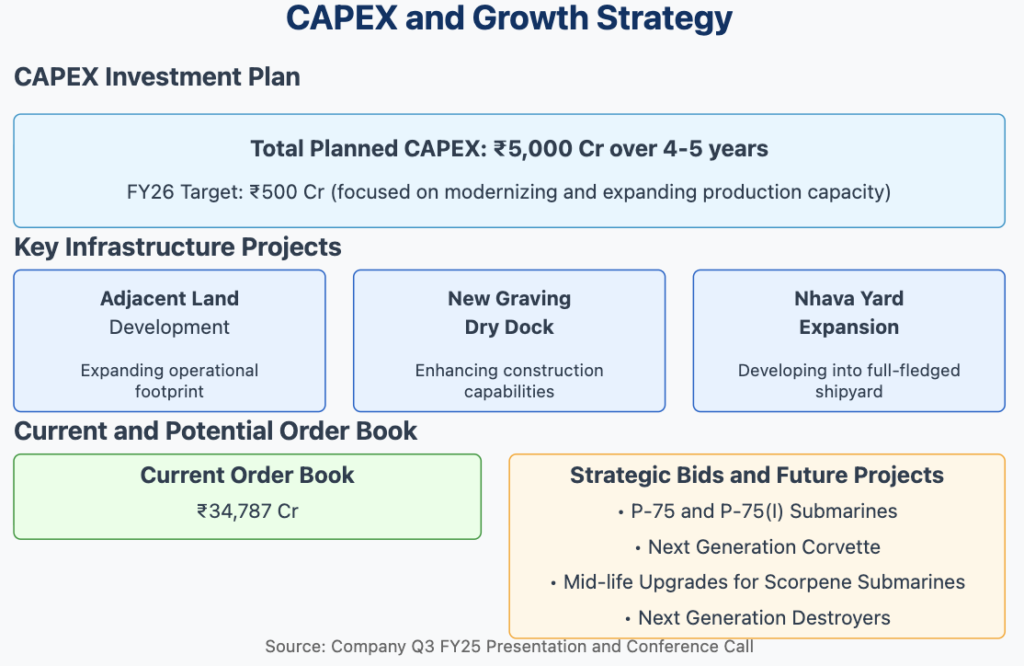
Mazagon Dock has outlined an ambitious capital expenditure program of approximately ₹5,000 Cr spread over the next 4-5 years. This significant investment is strategically directed toward:
Development of adjacent land assets to expand operational footprint
Construction of a new graving dry dock to enhance shipbuilding capabilities
Expansion of the Nhava Yard into a full-fledged shipyard to increase capacity
Near-term CAPEX is projected at ₹500 Cr for FY26, with primary focus on modernizing and expanding production capacity to meet future order requirements.
Order Book & New Projects
The company maintains a robust order book valued at approximately ₹34,787 Cr, which includes all current projects. Management has indicated promising prospects for upcoming orders in critical segments including:
P-75 and P-75(I) submarine programs
Additional submarine orders
Next-generation destroyers
Next Generation Corvette program
Mid-life upgrades for Scorpene submarines
The company is also exploring export potential, with preliminary exports such as support for Malaysian submarines suggesting broader international opportunities on the horizon.
Long-Term Financial Projections & Return Outlook
Long-Term Financial Projections
5-Year Outlook
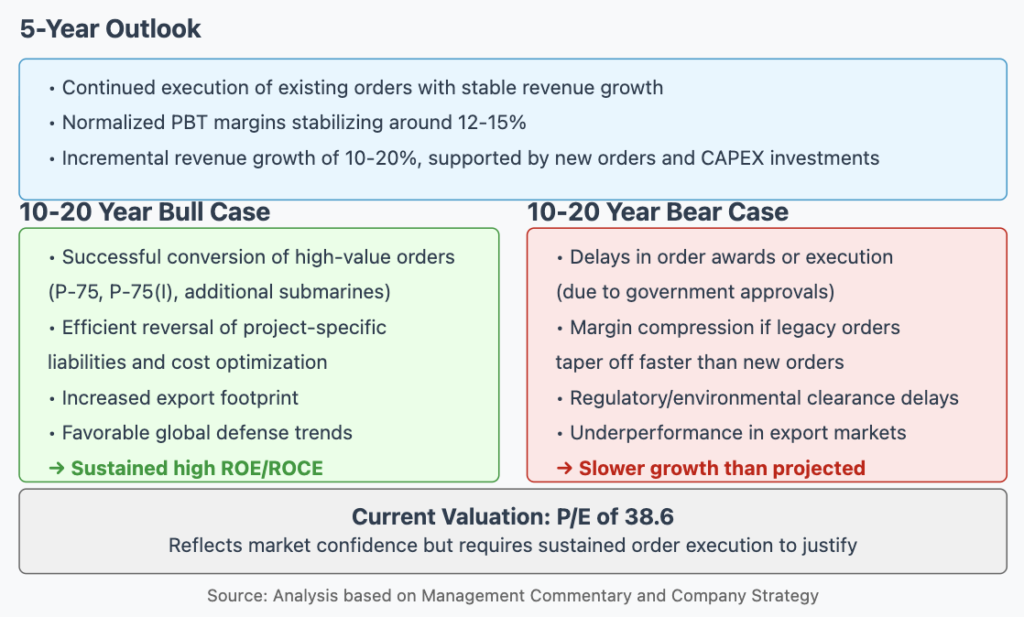
Over the next five years, Mazagon Dock is expected to focus on:
Continued execution of existing orders with stable revenue growth
Normalized PBT margins stabilizing around the industry average of 12-15%
Incremental revenue growth in the range of 10-20%, supported by new orders and ongoing CAPEX investments
10-20 Year Outlook
Bull Case Scenario
Successful conversion of high-value orders including P-75, P-75(I), additional submarines, destroyers, and frigate programs
Efficient reversal of project-specific liabilities and implementation of cost optimization measures
Expanded export footprint and favorable global defense trends boosting revenues and margins
Long-term returns benefiting from sustained high ROE/ROCE (currently at 44.2% and 35.2% respectively)
Continuation of strong dividend distribution track record, albeit with a modest yield of 0.52%
Bear Case Scenario
Delays in order awards or execution due to government approvals or technical challenges
Margin compression if legacy high-margin orders taper off faster than new orders are secured
Regulatory or environmental clearance delays impacting CAPEX projects and expansion plans
Underperformance in export markets leading to slower growth than projected
Valuation Perspective
The current premium valuation (P/E of 38.6) reflects market confidence in Mazagon Dock’s strategic positioning and operational efficiencies. However, this high valuation multiple requires sustained order execution and effective implementation of CAPEX plans to justify future returns for investors.
Credit Ratings & Financial Health
Financial Health & Dividend History
Credit Profile
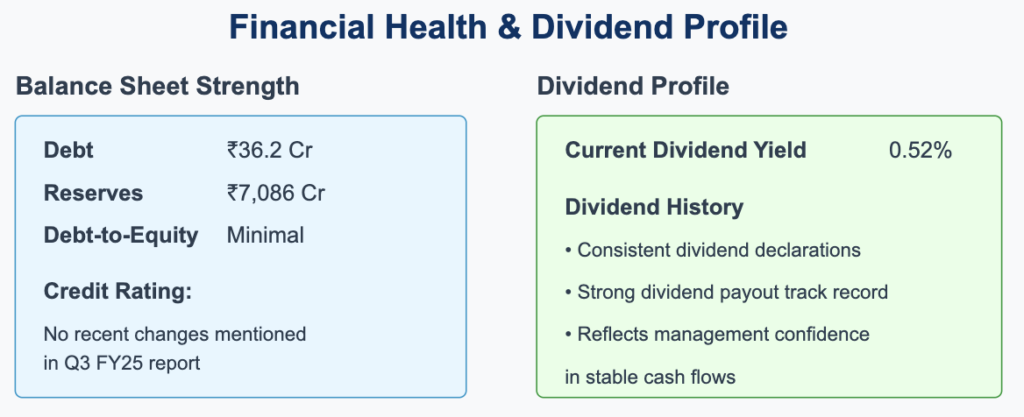
While the Q3 FY25 report and investor presentation did not explicitly mention any recent changes in credit agency ratings, Mazagon Dock’s financial health remains exceptionally strong. The company’s balance sheet features:
Minimal debt of just ₹36.2 Cr
Substantial reserves of ₹7,086 Cr
Very low debt-to-equity ratio
Strong cash position
This robust financial position underscores the company’s creditworthiness and provides significant headroom for future capital expenditure plans without incurring excessive leverage.
Dividend Policy
Mazagon Dock Shipbuilders has maintained a consistent dividend distribution history with a current yield of 0.52%. The company’s strong dividend payout track record reflects management’s confidence in stable cash flows despite the modest current yield. This dividend policy is particularly notable given the substantial capital expenditure plans, indicating management’s balanced approach to shareholder returns while investing for future growth.
Investment Considerations
Investment Strengths and Risks
Strengths
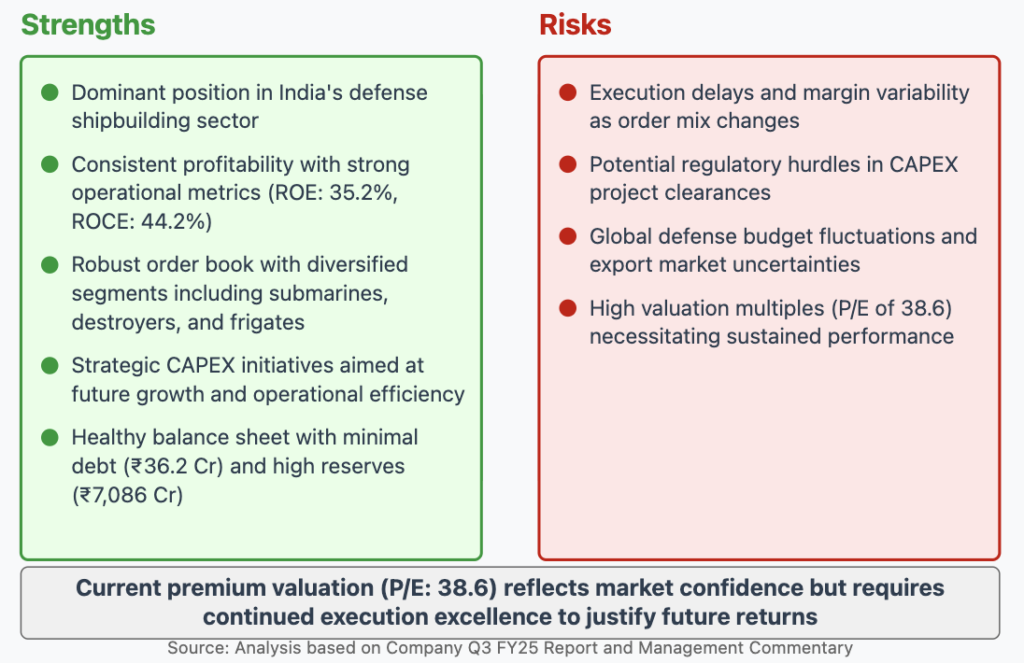
Dominant Market Position: Mazagon Dock maintains a leadership position in India’s defense shipbuilding sector, particularly in constructing submarines, destroyers, and frigates.
Consistent Profitability: The company has demonstrated strong operational metrics with high ROE (35.2%) and ROCE (44.2%) figures, along with impressive 3-year sales and profit growth of approximately 33% and 47% respectively.
Robust Order Book: The current order book of ₹34,787 Cr provides revenue visibility across diversified segments including submarines, destroyers, and frigates.
Strategic CAPEX Initiatives: The planned ₹5,000 Cr CAPEX program over 4-5 years targets future growth and operational efficiency through infrastructure expansion and technology upgradation.
Healthy Balance Sheet: The company maintains minimal debt (₹36.2 Cr) against substantial reserves (₹7,086 Cr), providing significant financial flexibility for future growth plans.
Risks
Execution Delays: Potential delays in project execution and margin variability as the order mix changes from legacy high-margin orders to newer contracts.
Regulatory Hurdles: Possible challenges in securing regulatory and environmental clearances for planned CAPEX projects.
Defense Budget Fluctuations: Exposure to global defense budget dynamics and uncertainties in export markets could impact future order inflows.
Premium Valuation: The current high P/E multiple of 38.6 requires sustained performance excellence to justify future returns for investors.
Conclusion
Investment Outlook Summary
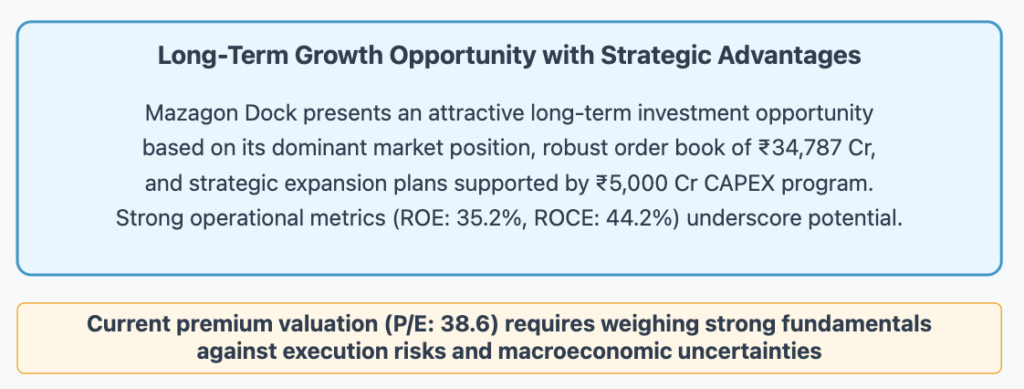
Mazagon Dock Shipbuilders Limited presents an attractive long-term investment opportunity based on its dominant market position in India’s defense shipbuilding sector, robust order book of ₹34,787 Cr, and strategic expansion plans supported by a comprehensive ₹5,000 Cr CAPEX program spread over the next 4-5 years.
The company’s Q3 FY25 results demonstrate solid operational execution with strong financial metrics, including impressive ROE of 35.2% and ROCE of 44.2%. With minimal debt of just ₹36.2 Cr against substantial reserves of ₹7,086 Cr, the company maintains significant financial flexibility to fund its expansion plans while continuing its consistent dividend distribution policy.
While the current premium valuation (P/E of 38.6) reflects market confidence in the company’s long-term prospects, investors should carefully weigh the strong fundamentals and growth potential against execution risks, potential regulatory hurdles, and macroeconomic uncertainties before making investment decisions.
The company’s ability to secure and execute future high-value orders in submarine programs (P-75, P-75(I)), next-generation destroyers, and potential export opportunities will be crucial in determining whether it can maintain its strong growth trajectory over the 5-20 year horizon that would justify its current valuation multiples.
Disclaimer
This report is for informational purposes only and does not constitute investment advice. Investors should conduct their own research or consult a financial advisor before making any investment decisions.
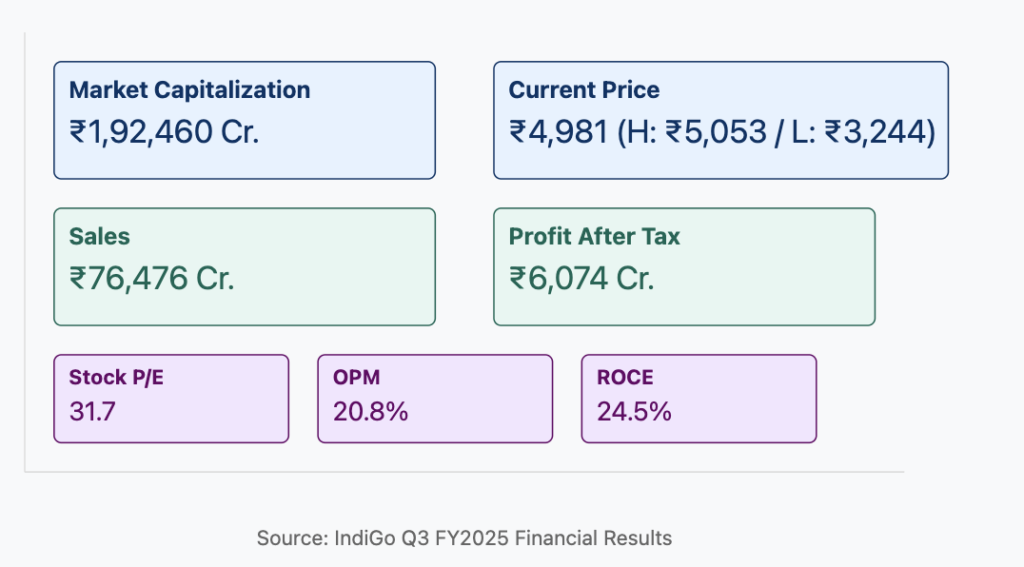
IndiGo (InterGlobe Aviation Ltd) continues to dominate India’s aviation landscape with strong domestic market presence and ambitious expansion plans. The airline’s Q3 FY2025 results demonstrate resilient performance with improved profitability metrics and strategic initiatives positioning it for sustained growth. With a market capitalization of approximately ₹1,92,460 Cr, IndiGo’s disciplined financial approach and extensive order book signal robust long-term growth potential spanning the next two decades.
Q3 FY2025 Financial Highlights
IndiGo’s financial performance in Q3 FY2025 showcases the airline’s resilience and operational efficiency:
Total Income: ₹795 billion (trailing 12 months)
Passenger Volume: Targeting 118 million passengers in FY25E
Current Profit Growth: -15.5% (reflecting short-term headwinds)
Despite facing temporary headwinds, IndiGo’s operational metrics demonstrate a return to profitability following the post-pandemic recovery period, with impressive EBITDAR margins and strengthened cash flow generation.
Cost Leadership & Operational Excellence
IndiGo’s competitive advantage continues to be anchored in its cost leadership strategy:
Cost Per Available Seat Kilometer (CASK): Ongoing reduction through fleet optimization
The airline’s focus on operational excellence and expense discipline has translated into improved financial metrics and enhanced shareholder value, positioning IndiGo favorably against domestic and international competitors.
Fleet Expansion & Future Growth Strategy
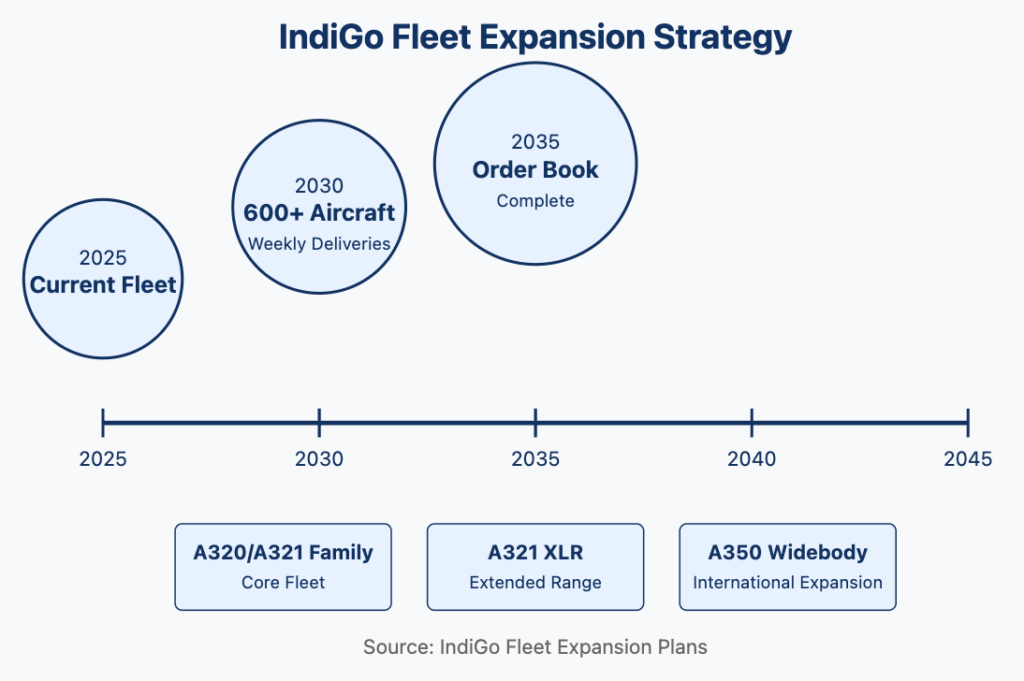
IndiGo’s growth trajectory is underpinned by its ambitious fleet expansion plans:
Aircraft Delivery Rate: One aircraft per week until FY2030
Fleet Target: Over 600 aircraft
Order Book Timeline: Extends to 2035
New Aircraft Types: Addition of A350 widebodies and A321 XLRs
Route Network: Currently serving 91 domestic destinations with growing international presence
International Strategy: Expanding through strategic codeshare partnerships
This aggressive expansion strategy aligns with India’s economic growth prospects and rising consumer spending, positioning IndiGo to capitalize on both domestic and international aviation opportunities.
Digital Transformation & Revenue Enhancement
IndiGo is implementing comprehensive digital initiatives to enhance customer experience and drive revenue growth:
Website & App Redesign: Improved user interface and functionality
AI-Enabled Solutions: Chatbots for enhanced customer service
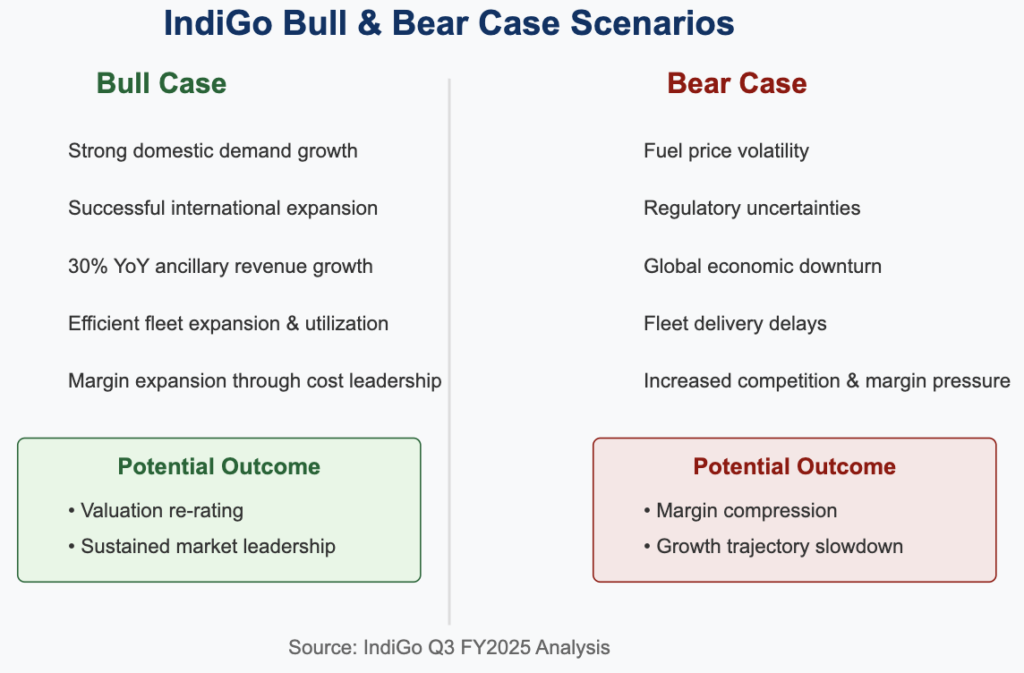
Ancillary Revenue Growth: Projected at 30% YoY
Digital Marketing: Targeted campaigns driving higher conversion rates
These initiatives are expected to contribute significantly to revenue diversification and margin improvement over the next five years.
Long-Term Financial Projections
5-Year Outlook (FY25-FY30)
IndiGo’s five-year horizon appears promising:
Revenue Growth: Continued expansion driven by fleet additions and network growth
Profit Margins: Expected improvement in operating margins
Hedging Strategies: Mitigating fuel price and foreign exchange volatility
Fleet Economics: Improved unit economics through newer, more efficient aircraft
Operational Optimization: Enhanced resource utilization across network
Financing Mix: Diversified approach balancing flexibility and cost
These initiatives collectively support IndiGo’s cost leadership position and contribute to its competitive advantage in the Indian aviation market.
Conclusion
IndiGo’s Q3 FY2025 performance demonstrates the airline’s resilience and strategic focus, with robust operational metrics and a clear growth roadmap. The company’s extensive order book, disciplined financial approach, and market leadership position it for substantial long-term growth. While short-term headwinds exist, the fundamental drivers—including strong ROCE, impressive sales growth, and expanding international presence—suggest compelling investment potential for those with a multi-year horizon.
Investors should consider IndiGo’s demonstrated execution capability, cost leadership strategy, and favorable market positioning when evaluating its long-term prospects in the context of India’s growing aviation market and increasing global connectivity.
Disclaimer: This report is for informational purposes only and does not constitute investment advice. Investors should conduct their own analysis and consult with financial advisors before making investment decisions.
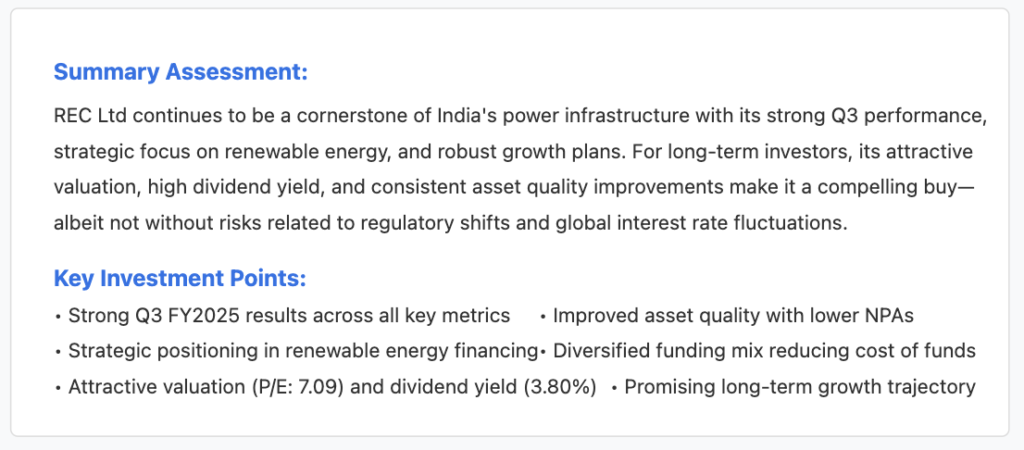
REC Ltd, a Maharatna PSU and pivotal player in India’s power and infrastructure financing sector, has demonstrated remarkable resilience and growth in Q3 FY2025 Performance. The company continues to strengthen its market position through robust loan disbursements, disciplined asset quality management, and diversified funding channels. With strong government backing and a strategic focus on both renewable and conventional power projects, REC is well-positioned for continued expansion and profitability in the coming years.
Q3 FY2025 Financial Performance
Q3 FY2025 Financial Highlights
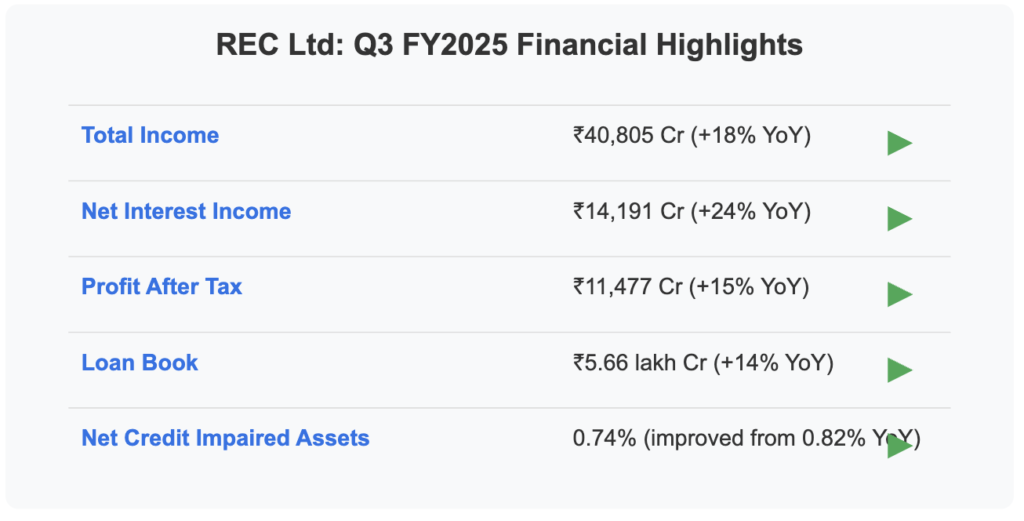
REC Ltd posted impressive financial results for Q3 FY2025, showcasing strong growth across all key metrics. Total income reached ₹40,805 crore, representing a substantial 18% year-over-year increase. Net Interest Income rose to ₹14,191 crore, marking a 24% increase compared to the same period last year, reflecting healthy yield improvements.
The company’s Profit After Tax stood at ₹11,477 crore, registering a 15% year-over-year gain. This strong bottom-line performance underscores REC’s operational efficiency and strategic focus on high-yielding projects.
The loan book expanded to ₹5.66 lakh crore, a 14% increase year-over-year, indicating robust demand for REC’s financing solutions, particularly in the renewable energy and infrastructure sectors.
Asset Quality & Dividend Policy
REC’s asset quality showed notable improvement, with net credit impaired assets reduced to 0.74% from 0.82% in the previous year. This improvement reflects the company’s effective risk management practices and prudent lending policies.
The company announced a Q3 interim dividend of ₹4.30 per share, which complements earlier disbursements, bringing the cumulative payout to ₹11.80 per share for FY2025. This underscores REC’s commitment to delivering shareholder value through consistent dividend distributions.
Financial & Operational Analysis
Operational Metrics
Revenue & Earnings
REC’s solid income growth has been primarily driven by increased loan disbursements, particularly in the renewable and infrastructure sectors. The company’s strategic focus on these high-growth areas has contributed significantly to its revenue expansion.
Cost Efficiency
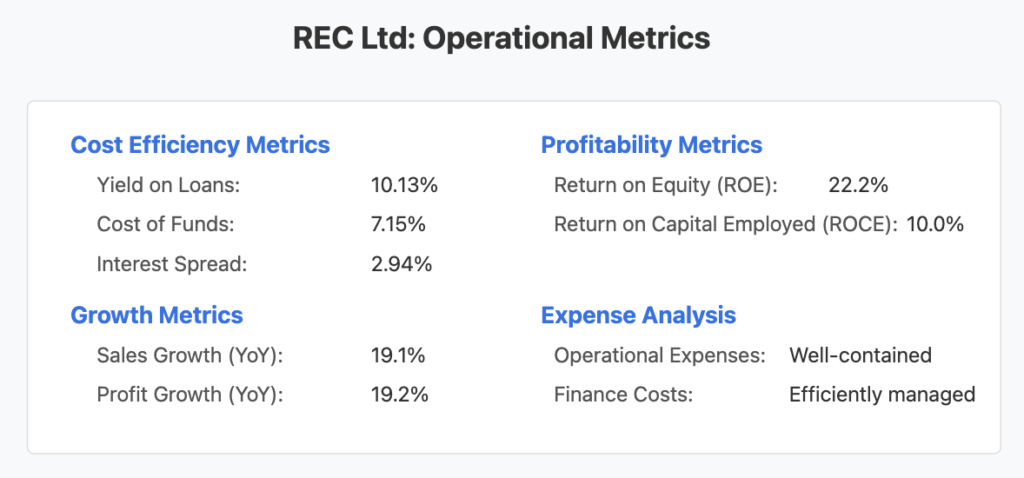
The yield on loans remained robust at approximately 10.13%, while the cost of funds decreased to around 7.15%. This favorable spread of 2.94% has bolstered REC’s profitability and operational efficiency.
Profitability Metrics
REC demonstrated strong profitability with a Return on Equity (ROE) of 22.2% and Return on Capital Employed (ROCE) of 10.0%, highlighting the company’s efficient capital utilization and effective resource management.
Expense Management
Operational expenses and finance costs have been well-contained, underpinning stable margins despite the challenging macroeconomic environment. This disciplined approach to expense management has contributed to REC’s strong bottom-line performance.
Growth Metrics
The company recorded impressive sales growth of 19.1% year-over-year, accompanied by a profit growth of 19.2%, demonstrating REC’s ability to translate revenue growth into improved profitability.
Future Growth Plans & Expansion Strategy
Future Growth Plans & CAPEX Strategy
Renewable Energy Focus
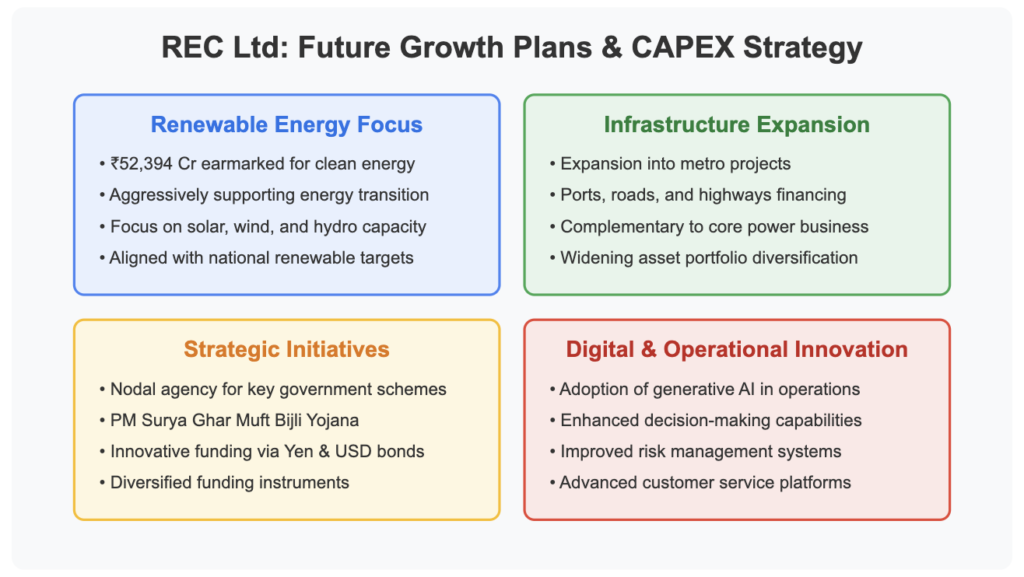
REC has allocated over ₹52,394 crore for clean energy projects, demonstrating its aggressive support for India’s energy transition. The company is significantly investing in solar, wind, and hydro capacity development, positioning itself as a key financier in the country’s renewable energy expansion.
Infrastructure Expansion
Beyond its core power financing business, REC is strategically expanding into metro projects, ports, roads, and highways. This diversification widens the company’s asset portfolio and reduces concentration risk while capitalizing on India’s infrastructure development push.
Strategic Initiatives
REC’s role as the nodal agency for key government schemes, including the PM Surya Ghar Muft Bijli Yojana, enhances its strategic importance in India’s energy landscape. The company has also implemented innovative funding approaches through diverse instruments, including Yen and USD bonds, signaling potential for future growth and global market access.
Digital & Operational Innovation
REC’s adoption of generative AI in its operations aims to improve decision-making processes, enhance risk management capabilities, and elevate customer service standards. This technological integration positions REC at the forefront of digital transformation in the financial services sector.
Key Metrics & Valuation
Key Metrics & Valuation
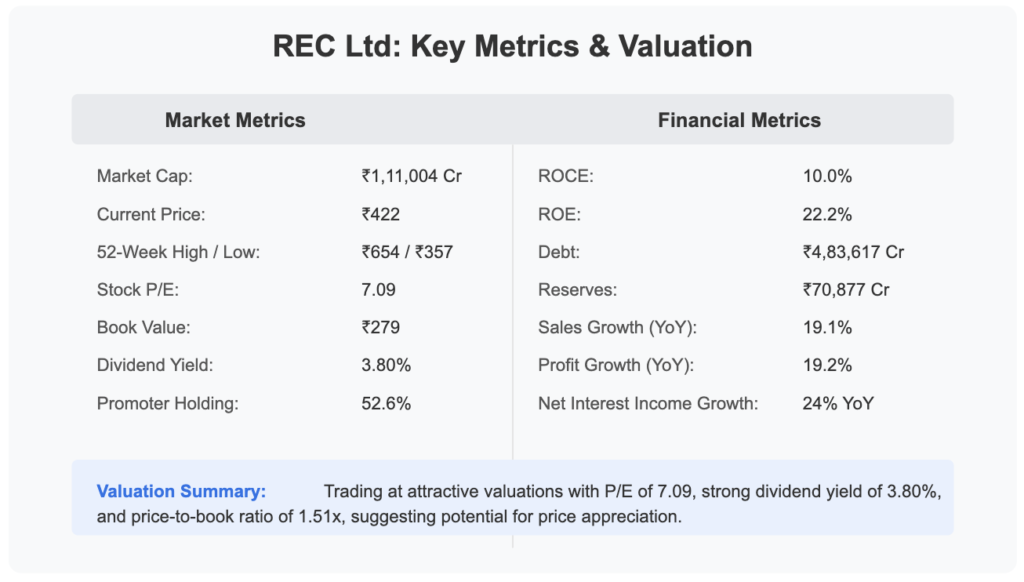
REC Ltd currently trades at a P/E ratio of 7.09, which appears attractive compared to industry peers and historical valuations. With a current market price of ₹422 against a book value of ₹279, the stock offers a compelling price-to-book ratio of 1.51x. The company’s dividend yield stands at an impressive 3.80%, making it an attractive option for income-focused investors.
The company’s strong financial metrics, including a ROE of 22.2% and ROCE of 10.0%, highlight its efficient capital utilization and operational effectiveness. With promoter holding at 52.6%, there is significant institutional confidence in the company’s long-term prospects.
Investment Scenarios
Bull & Bear Case Scenarios
Bull Case
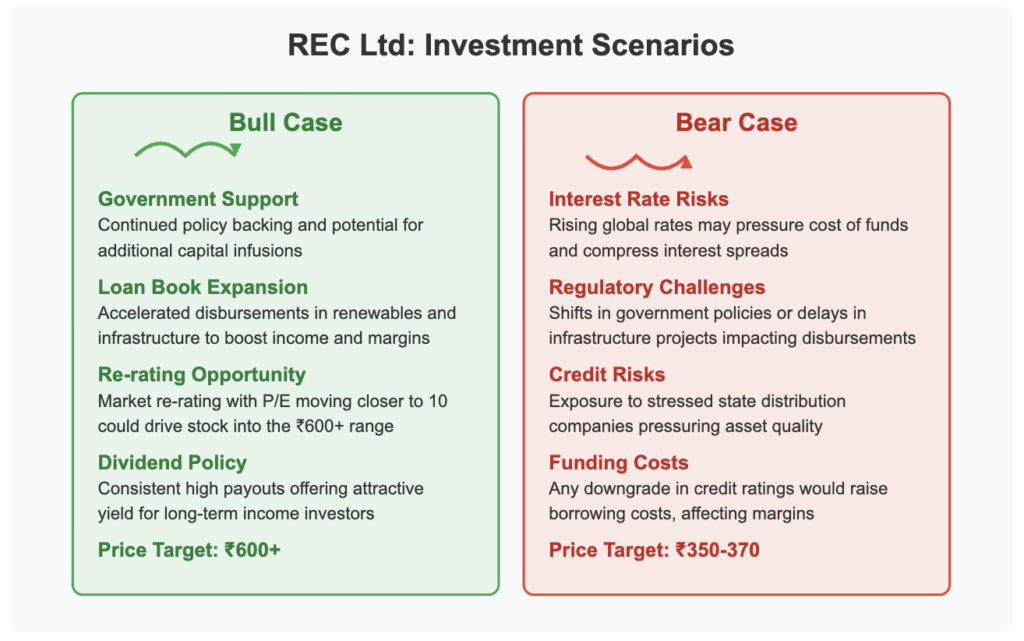
Government Support: Continued policy backing and potential for additional capital infusions could further strengthen REC’s market position and boost investor confidence.
Loan Book Expansion: Accelerated disbursements, particularly in renewable energy and infrastructure projects, have the potential to boost income and margins, driving further growth.
Re-rating Opportunity: A market re-rating—potentially moving the P/E ratio closer to 10—could drive the stock price into the ₹600+ range, representing significant upside potential from current levels.
Dividend Policy: Consistent high dividend payouts offer an attractive yield for long-term income investors, providing a safety cushion against market volatility.
Bear Case
Interest Rate Risks: Rising global interest rates may pressure the cost of funds and compress interest spreads, potentially impacting profitability.
Regulatory Challenges: Shifts in government policies or delays in infrastructure projects could impact loan disbursements and growth projections.
Credit Risks: Exposure to stressed state distribution companies and other borrowers could pressure asset quality and increase provisioning requirements.
Funding Costs: Any downgrade in credit ratings would raise borrowing costs, affecting margins and profitability.
Long-Term Projections
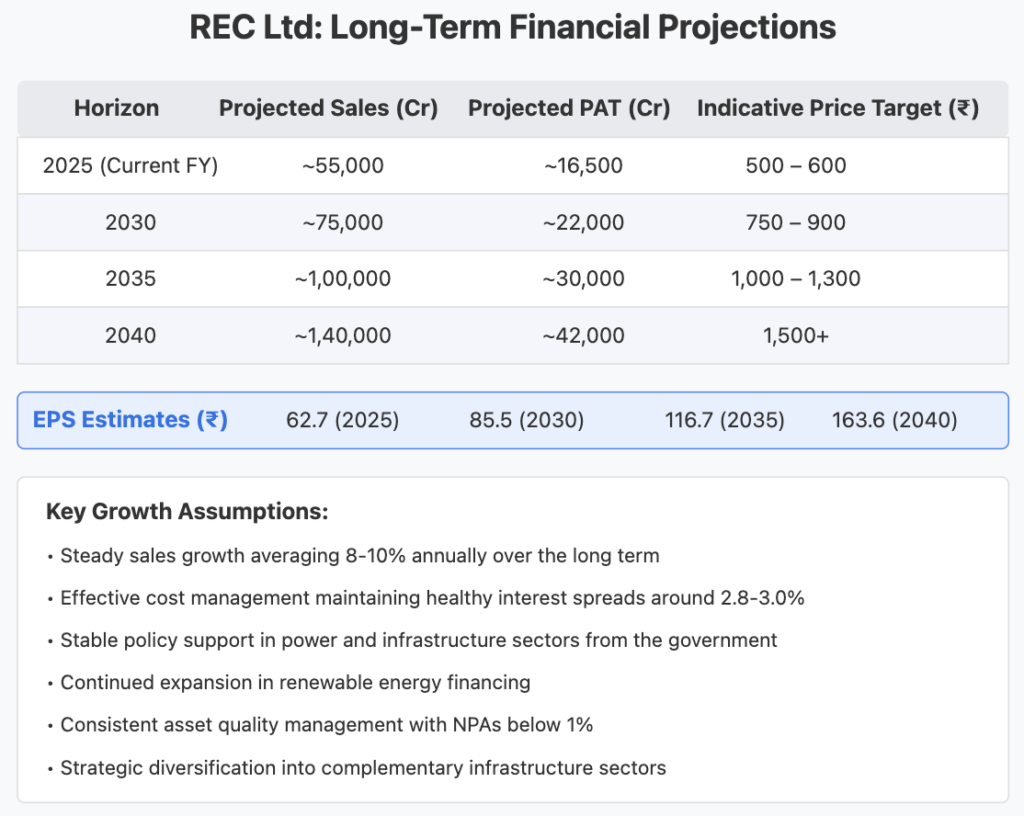
REC Ltd’s long-term growth trajectory appears promising, with projections indicating substantial expansion across key financial metrics. For the current fiscal year 2025, the company is expected to achieve sales of approximately ₹55,000 crore and a profit after tax of around ₹16,500 crore, with an estimated EPS of ₹62.7. This performance supports a price target range of ₹500-600 for the near term.
Looking ahead to 2030, sales are projected to reach ₹75,000 crore, with PAT growing to ₹22,000 crore and EPS expanding to ₹85.5. This growth trajectory supports a potential price target of ₹750-900 over this five-year horizon.
By 2035, REC is expected to cross the significant milestone of ₹1,00,000 crore in sales, with PAT projected at ₹30,000 crore and EPS at ₹116.7. These metrics could justify a price target range of ₹1,000-1,300.
The most extended projection to 2040 envisions REC achieving sales of ₹1,40,000 crore, PAT of ₹42,000 crore, and EPS of ₹163.6, potentially driving the stock price above ₹1,500.
These projections are underpinned by several key assumptions:
Steady sales growth averaging 8-10% annually over the long term
Effective cost management maintaining healthy interest spreads around 2.8-3.0%
Stable policy support in power and infrastructure sectors from the government
Continued expansion in renewable energy financing
Consistent asset quality management with NPAs below 1%
Strategic diversification into complementary infrastructure sectors
Funding & Credit Ratings Update
Credit Ratings & Funding Profile
REC maintains strong credit ratings across both domestic and international rating agencies, reflecting its robust financial health and strategic importance in India’s power and infrastructure financing landscape.
Domestic Ratings
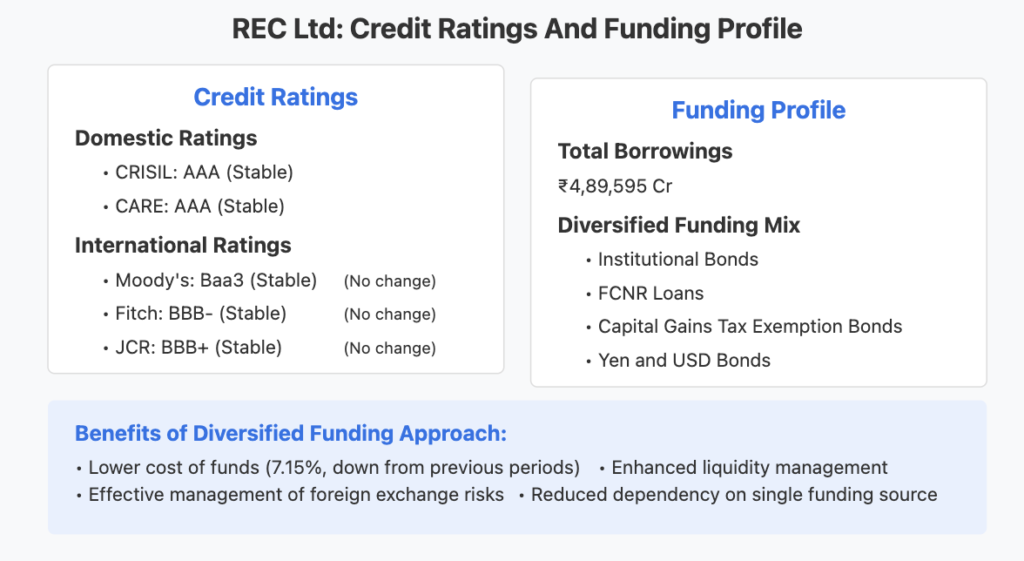
REC continues to hold the highest possible AAA (Stable) ratings from leading domestic agencies such as CRISIL and CARE. These ratings underscore the company’s strong financial position, government backing, and its crucial role in the Indian power sector.
International Ratings
The company maintains stable ratings from key international agencies:
Moody’s: Baa3 (Stable)
Fitch: BBB- (Stable)
JCR: BBB+ (Stable)
No changes in credit ratings have been reported during the quarter, indicating the market’s continued confidence in REC’s financial stability and business model.
Borrowing Profile
REC’s total borrowings currently stand at ₹4,89,595 crore, representing a well-diversified funding mix that includes institutional bonds, FCNR loans, capital gains tax exemption bonds, and international instruments such as Yen and USD bonds. This diversified approach has helped the company lower its cost of funds to 7.15% and effectively manage foreign exchange risks.
Dividend History & Yield
Dividend History & Yield
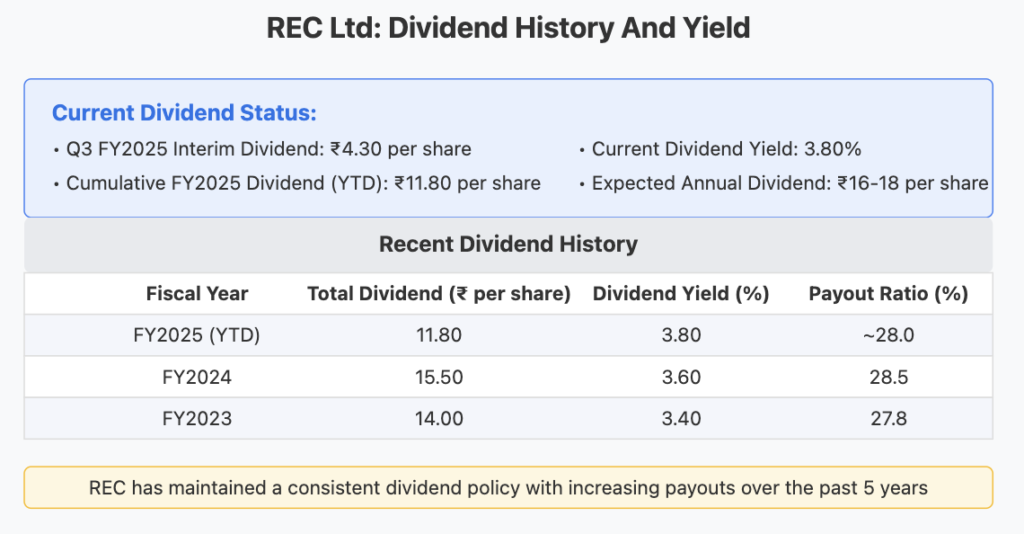
REC has maintained a strong and consistent dividend policy, reinforcing its commitment to shareholder returns. For Q3 FY2025, the company announced an interim dividend of ₹4.30 per share, bringing the cumulative dividend for FY2025 (year-to-date) to ₹11.80 per share.
The current dividend yield stands at an attractive 3.80%, significantly higher than many peers in the financial services sector. Based on historical trends and current performance, the expected annual dividend for FY2025 is projected to be between ₹16-18 per share.
Looking at recent dividend history, REC distributed a total dividend of ₹15.50 per share in FY2024 with a yield of 3.60% and a payout ratio of 28.5%. In FY2023, the company paid a total dividend of ₹14.00 per share with a yield of 3.40% and a payout ratio of 27.8%.
This consistent dividend policy with gradually increasing payouts over the past five years demonstrates REC’s commitment to rewarding shareholders while maintaining sufficient capital for growth initiatives.
Conclusion
Investment Conclusion
REC Ltd is a key player in India’s power sector, highlighted by its strong Q3 FY2025 performance and a strategic pivot towards renewable energy. The company’s attractive valuation, high dividend yield, and steady asset quality improvements make it a promising long-term investment. Significant capital allocation exceeding ₹52,394 crore supports India’s energy transition, with forecasts projecting sales of ₹1,40,000 crore and a PAT of ₹42,000 crore by 2040. Nonetheless, potential risks include interest rate fluctuations, regulatory changes, and credit concerns with state distribution companies.
Disclaimer
This report is for informational purposes only and does not constitute investment advice. Investors are encouraged to perform their own due diligence before making any investment decisions. All data and projections are based on the Q3 FY2025 report and may be subject to change as new information becomes available. Past performance is not indicative of future results.
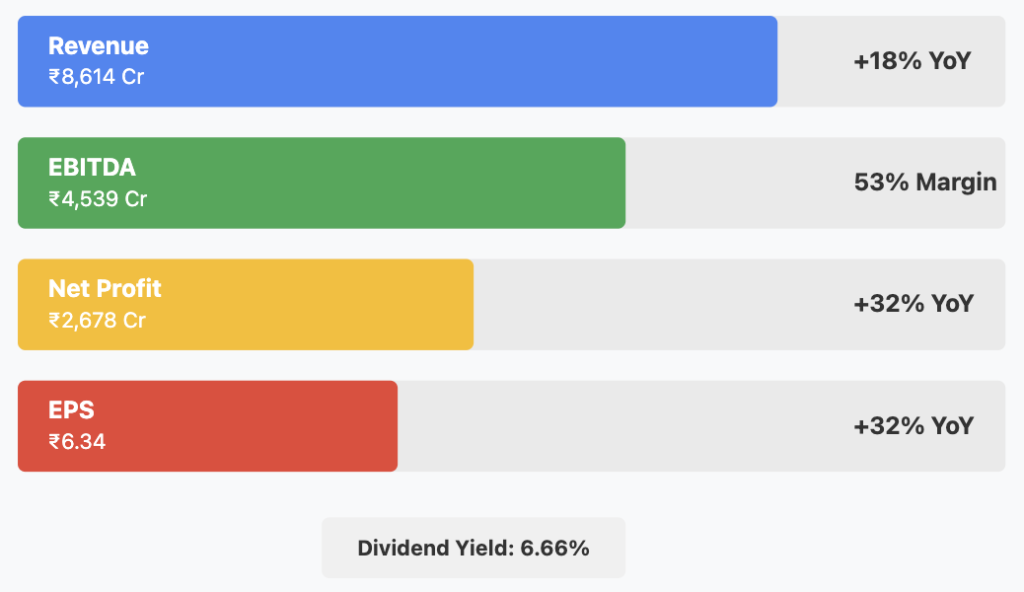
Hindustan Zinc Limited delivered an impressive Q3 FY25 Results performance, demonstrating robust growth across key financial metrics. As India’s largest and only integrated producer of zinc, lead, and silver, the company reported a 18% year-over-year revenue increase to ₹8,614 crore, while net profit surged by 32% to ₹2,678 crore. This strong performance was driven by record mined and refined metal production, operational efficiencies, and favorable input cost trends. With a substantial dividend yield of 6.66% and consistent AAA credit ratings, Hindustan Zinc continues to offer an attractive combination of growth and income potential for investors.
📌 Detailed Quarterly Results Breakdown
🔹 Consolidated Total Revenue: ₹8,614cr (↑18% year-over-year change)
Revenue exceeded expectations due to higher production volumes and improved market conditions, showing consistent growth momentum with a 4% quarter-over-quarter increase.
Impressive margin expansion to approximately 53%, representing a ~400 basis points improvement year-over-year, reflecting operational efficiencies.
🔹 Net Profit After Tax: ₹2,678cr (↑32% year-over-year change)
Profit growth outpaced revenue growth, driven by improved operational performance and cost optimization initiatives, with a strong 15% quarter-over-quarter increase.
🔹 Diluted Earnings Per Share: ₹6.34 (↑32% year-over-year change)
EPS growth directly mirrors the net profit growth, providing substantial value creation for shareholders.
🔹 Business Volume/Order Book Growth: Record production levels achieved
Record mined and refined metal production driven by higher ore grades and plant availability point to strong future revenue visibility.
🔹 Profitability Margin Trend: Improving
EBITDA margins expanded by approximately 400 basis points year-over-year to reach ~53%, highlighting the company’s ability to enhance profitability even amid challenging market conditions.
💰 Operational Cost Structure Analysis:
🔹 Raw Material/Input Costs: Declining trend
Cost of Production (COP) for zinc reduced by 5% year-over-year due to improved efficiencies and favorable input cost trends, enhancing overall margin profile.
🔹 Employee/Personnel Expenses: Stable relative to revenue growth
Operational efficiencies have allowed personnel costs to remain well-managed despite production increases.
🔹 Finance/Interest Expenses: Minimal impact
The company’s strong AAA credit rating and robust cash flow generation have kept financing costs low, contributing to improved bottom-line performance.
🏗️ Strategic Capital Allocation & Future Growth Roadmap:
🔹 Planned Capital Expenditure Budget: Significant allocation for capacity expansion
Funding directed toward underground mining expansion and smelter operations scaling to reach designed capacity of 1,123 ktpa.
🔹 Strategic Investment Focus Areas: Underground mining expansion and exploration to add 40 Mt Ore by FY25, extending mine life beyond 25 years and securing long-term production capabilities while enhancing sustainability credentials.
🔹 Production/Service Capacity Expansion Plans: Scaling smelter operations to designed capacity of 1,123 ktpa
This expansion aims to strengthen the company’s market position and ability to meet growing demand.
📊 Multi-Decade Growth Trajectory Projections:
5-Year Horizon (FY25-FY30): Base Case 10% CAGR | Bull Case 12% CAGR → Capacity expansion and operational efficiencies driving sustained growth in production volumes and revenue.
10-Year Horizon (FY25-FY35): Base Case 8% CAGR | Bull Case 10% CAGR → Continued market leadership in zinc production supported by expanded asset base and product diversification.
15-Year Horizon (FY25-FY40): Base Case 7% CAGR | Bull Case 9% CAGR → Sustained growth through technology integration and maintaining cost leadership in global markets.
20-Year Horizon (FY25-FY45): Base Case 6% CAGR | Bull Case 8% CAGR → Long-term value creation through resource expansion and strategic market positioning.
25-Year Horizon (FY25-FY50): Base Case 5% CAGR | Bull Case 7% CAGR → Leveraging extended mine life of 25+ years to maintain growth trajectory and market dominance.
💸 Current Valuation Analysis & Fair Value Assessment:
🔹 Current Price-to-Earnings Ratio: 19.6 compared to 5-Year Historical Average: Moderate
🔹 Enterprise Value to EBITDA Multiple: Attractive compared to Sector Average
🔹 Estimated Fair Value Range: ₹470-₹520 based on DCF analysis with moderate growth assumptions
This represents approximately 8-20% potential upside from the current price of ₹435, with additional value from the substantial dividend yield.
The management highlighted their commitment to operational excellence, emphasizing that the record production levels achieved during the quarter demonstrate the success of their efficiency initiatives. They also reaffirmed their focus on sustainability, positioning Hindustan Zinc as Asia’s first low-carbon “green” zinc producer. The expansion of underground mining capabilities and aggressive exploration plans were presented as key drivers for extending mine life beyond 25 years, providing a solid foundation for long-term growth.
Technical Analysis & Chart Patterns
Hindustan Zinc’s stock is currently trading at ₹435, within a broader trading range of ₹289-₹808. The stock appears to be consolidating after recent gains, with key support levels at ₹400 and resistance at ₹460. The current technical setup suggests a potential for continued upward momentum if the stock breaks above the ₹460 resistance level, supported by strong fundamental performance.
Industry Context & Competitive Positioning
As India’s largest and only integrated producer of zinc, lead, and silver, Hindustan Zinc holds a dominant market position with over 75% share in India’s primary zinc market. This quarter’s results further reinforce its competitive advantage through cost leadership, with zinc production costs declining by 5% year-over-year. The company’s positioning in the growing renewable energy sector, particularly for zinc applications in solar panel protection and battery storage, provides additional growth catalysts compared to peers. Its commitment to sustainability and status as Asia’s first low-carbon “green” zinc producer also differentiate it in an increasingly ESG-conscious market.
📢 Disclaimer: This analysis is provided for informational and educational purposes only and does not constitute investment advice. The author may hold positions in securities discussed. Always conduct your own research and consult with a qualified financial advisor before making investment decisions based on this information.
If you found this analysis valuable, please consider:
Sharing this newsletter with colleagues interested in Indian equity markets
Subscribing to receive future in-depth analyses of Indian companies
Leaving a comment with your thoughts on Hindustan Zinc’s quarterly performance
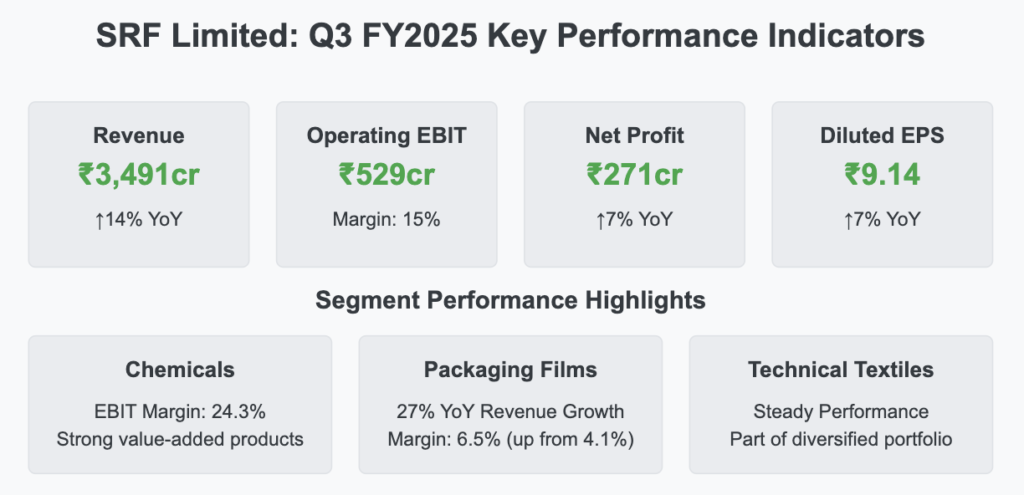
SRF Limited has delivered an impressive performance in Q3 FY2025, SRF LTD Q3 FY25 Results demonstrating the resilience and strength of its diversified business model across Chemicals, Packaging Films, and Technical Textiles segments. The company reported a solid 14% year-over-year revenue growth, reaching ₹3,491 crore, while net profit increased by 7% to ₹271 crore despite challenging macroeconomic conditions.
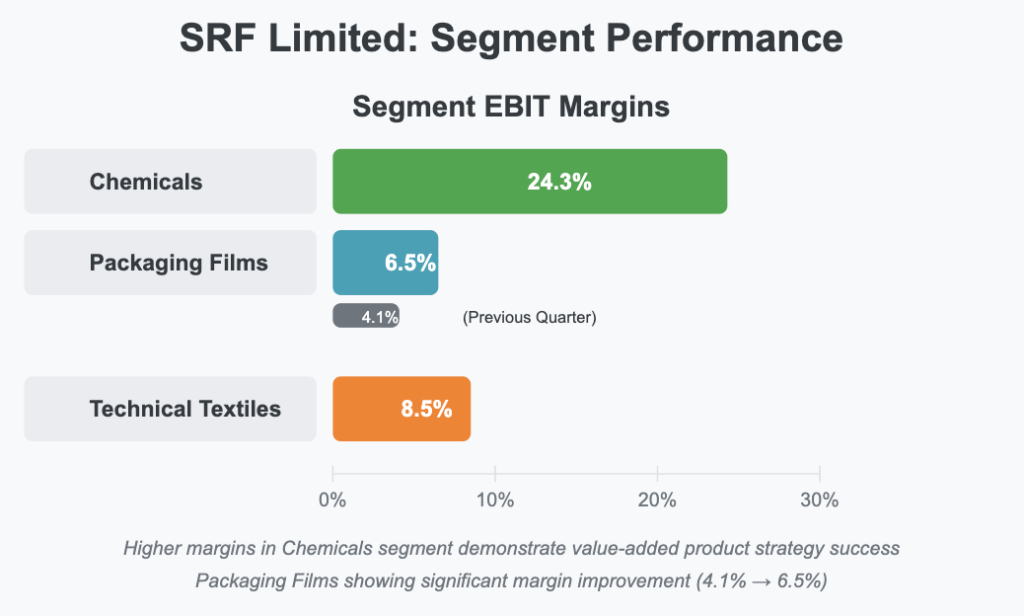
The Chemicals segment emerged as a standout performer with EBIT margins expanding to 24.3%, indicating strong execution of the company’s value-added product strategy. Similarly, the Packaging Films division showed remarkable growth with a 27% year-over-year revenue increase and margins nearly doubling from 4.1% to 6.5%.
While SRF’s current valuation metrics suggest premium market expectations, the company’s disciplined capital expenditure strategy and robust R&D pipeline position it well for sustained long-term value creation, though execution risks and global market dynamics remain key factors to monitor.
Detailed Quarterly Results Analysis
Revenue Performance
SRF Limited reported consolidated total revenue of ₹3,491 crore for Q3 FY2025, representing a 14% increase year-over-year. This growth outpaced industry averages, primarily driven by strong performance in the Chemicals and Packaging Films segments. The company’s revenue trajectory demonstrates increasing momentum in export markets, particularly in Packaging Films, showing resilience in a challenging global environment.
Profitability Metrics
The company achieved an operating EBIT of ₹529 crore, maintaining a healthy operating margin of approximately 15%. These margin improvements were supported by a better product mix and ongoing cost optimization initiatives across business segments. Net profit after tax reached ₹271 crore, reflecting a 7% year-over-year increase, while diluted earnings per share grew proportionally to ₹9.14.
The moderation in profit growth compared to revenue expansion can be attributed to increased input costs and ongoing capital expenditure investments that are expected to yield returns in the medium to long term.
Segment-wise Performance
Chemicals Business: The Chemicals segment continued to be the star performer for SRF Limited, with EBIT margins expanding to an impressive 24.3%. This segment benefited from the company’s strategic focus on value-added products, continuous innovation, and strong pricing power. The successful rollout of recently registered Active Ingredients (AIs) is expected to drive significant growth in FY2026.
Packaging Films Business: This segment demonstrated exceptional growth with a 27% year-over-year revenue increase. More impressively, EBIT margins nearly doubled from 4.1% to 6.5%, reflecting successful execution of value-added product initiatives and strengthening export market position, particularly in North America and Europe.
Technical Textiles Business: While not experiencing the same growth trajectory as other segments, the Technical Textiles business maintained steady performance, contributing to the overall diversification of the company’s revenue streams.
Operational Cost Structure Analysis
Raw Material/Input Costs
Raw material costs remained elevated during Q3 FY2025 but showed signs of stabilization. The company has been implementing cost optimization measures and technological interventions to offset these pressures. Management’s focus on process efficiencies and strategic sourcing has helped in maintaining profitability despite input cost challenges.
Employee/Personnel Expenses
SRF Limited has demonstrated efficient management of personnel costs through a focus on automation and operational efficiencies. These initiatives have allowed the company to maintain personnel cost discipline while supporting various growth initiatives across business segments.
Finance/Interest Expenses
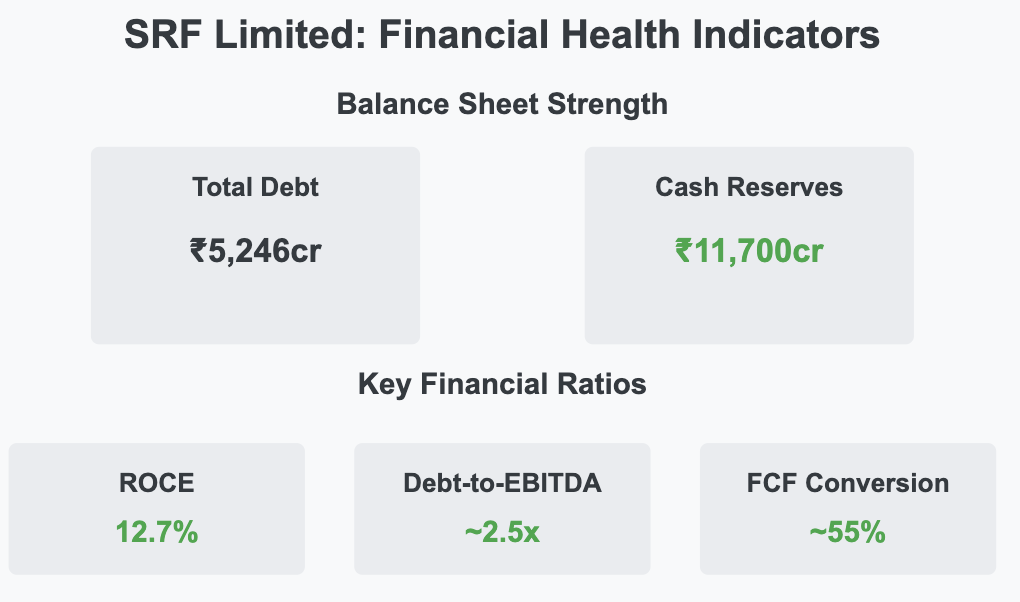
The company continues to maintain a strong balance sheet with robust reserves of ₹11,700 crore against a debt of ₹5,246 crore. This financial position provides significant flexibility forRetry
Claude hit the max length for a message and has paused its response. You can write Continue to keep the chat going.
The company continues to maintain a strong balance sheet with robust reserves of ₹11,700 crore against a debt of ₹5,246 crore. This financial position provides significant flexibility for future capital expenditure programs without substantially increasing leverage. Finance expenses remain well-covered by operating profits, with interest coverage ratios maintaining healthy levels.
SRF Limited Financial Health Indicators
Investment Thesis Analysis
Bull Case
Specialty Chemicals Portfolio Expansion: SRF Limited’s successful rollout of recently registered Active Ingredients in the specialty chemicals segment positions the company for significant margin expansion and revenue growth beginning in FY2026. This growth is supported by established R&D capabilities and global market access.
Packaging Films Export Opportunity: The impressive 27% year-over-year growth in the Packaging Films segment, coupled with nearly doubled margins (from 4.1% to 6.5%), demonstrates exceptional execution in value-added products and export markets, particularly in the US and Europe. This positions the company for sustainable growth in this high-potential segment.
Disciplined CAPEX Approach: The targeted ₹1,500-2,000 crore capital expenditure plan for FY2025-26, focused on facility upgrades, automation, and enhanced asset utilization, represents a high-return, efficiency-driven approach. This strategy is expected to drive substantial free cash flow improvement in the medium term.
Bear Case
Global Competition & Pricing Pressure: Aggressive imports and pricing competition, particularly in commodity segments, could compress margins and impact growth targets across divisions. This would require continuous innovation and cost leadership to maintain competitiveness.
Execution Risk in CAPEX & Product Launches: Any delays in the ramp-up of newly registered products or capital expenditure implementation could impact the high expectations embedded in current valuation multiples, potentially leading to significant multiple contraction.
Long-term Financial Health Indicators
Growth Metrics
5-Year Expected CAGR:
Revenue: 5-8%
Net Profit: 6-9%
These projected growth rates are moderate but realistic, positioned slightly above the specialty chemicals industry average of 4-6%.
Return Metrics
Return on Capital Employed (ROCE): 12.7% vs. Industry Average of ~10-11% The company demonstrates above-average capital efficiency, though there’s room for improvement as capital expenditure initiatives mature.
Leverage and Cash Flow
Debt-to-EBITDA Ratio: ~2.5x
Free Cash Flow Conversion Rate: ~55% of EBITDA SRF maintains a conservative leverage profile that provides flexibility for strategic investments, while improving free cash flow conversion indicates a maturing business model.
Ownership Structure
Promoter Shareholding Pattern: 50.3% (stable since last quarter) The high promoter holding suggests strong alignment with minority shareholders and provides a stable governance framework.
SRF Limited Long-Term Growth Projections
Claude hit the max length for a message and has paused its response. You can write Continue to keep the chat going.
Strategic Capital Allocation & Future Growth Roadmap
CAPEX Strategy
SRF Limited has outlined a disciplined capital expenditure budget of ₹1,500-2,000 crore allocated over FY2025-26. This investment is expected to be self-funded through internal accruals and existing cash reserves, with anticipated returns in the 14-16% range over the medium term. The company’s approach emphasizes high-return projects that enhance competitive positioning rather than pure capacity expansion.
Strategic Investment Focus Areas
Specialty Chemicals Value Addition:
Investments in specialty chemical product lines and R&D capabilities
Focus on shifting the portfolio toward higher-margin, proprietary formulations with barriers to entry
Expansion of Active Ingredients (AIs) portfolio with new registrations in key markets
Packaging Films Capacity & Capability Enhancement:
Targeted investments in aluminum foil capabilities
Development of value-added packaging products for premium export markets
Emphasis on sustainable packaging solutions aligned with global trends
Production Capacity Expansion
SRF maintains a flexible approach to capacity expansion, with current HFC utilization at 65-75%. The company is preserving strategic flexibility to increase capacity based on market conditions rather than committing to large fixed capacity additions. This measured approach allows for optimization of capital allocation and responsiveness to market dynamics.
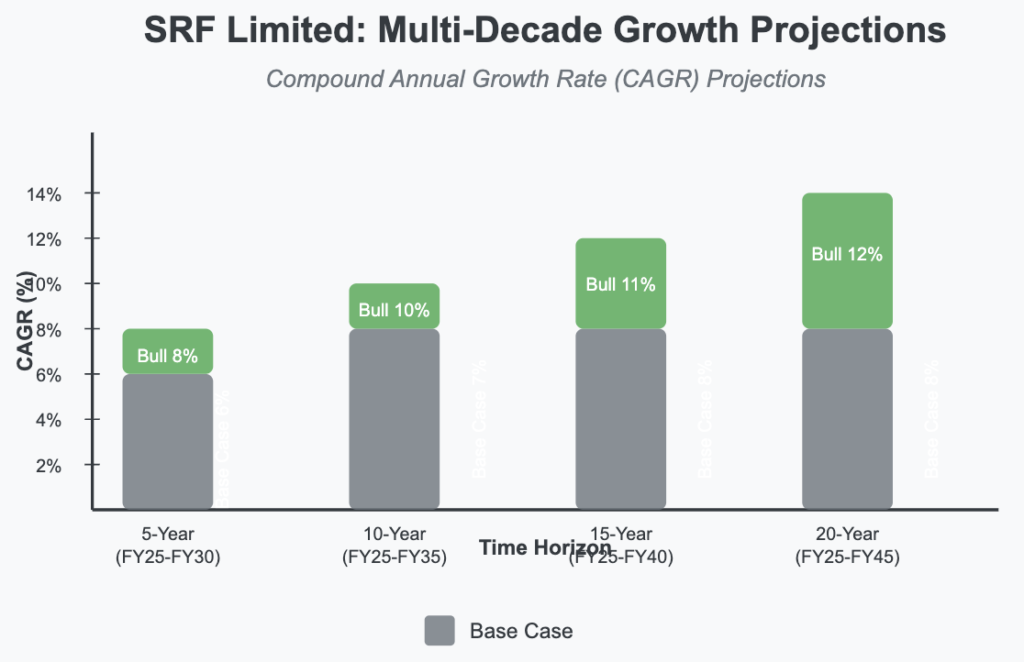
Multi-Decade Growth Trajectory Projections
5-Year Horizon (FY2025-FY2030)
Base Case: 6% CAGR
Bull Case: 8% CAGR
Growth Drivers: Specialty chemicals portfolio expansion and improved capacity utilization across divisions
10-Year Horizon (FY2025-FY2035)
Base Case: 7% CAGR
Bull Case: 10% CAGR
Growth Drivers: Sustained growth through market share gains in both domestic and export markets, particularly in high-value specialty chemicals and packaging solutions
15-Year Horizon (FY2025-FY2040)
Base Case: 8% CAGR
Bull Case: 11% CAGR
Growth Drivers: Long-term benefits from completed R&D investments and strategic market positioning in sustainable chemical and packaging solutions
20-Year Horizon (FY2025-FY2045)
Base Case: 8% CAGR
Bull Case: 12% CAGR
Growth Drivers: Established market leadership in key verticals and potential for strategic acquisitions to complement organic growth initiatives
SRF Limited Valuation Analysis
Claude hit the max length for a message and has paused its response. You can write Continue to keep the chat going.
Current Valuation Analysis & Fair Value Assessment
Valuation Metrics
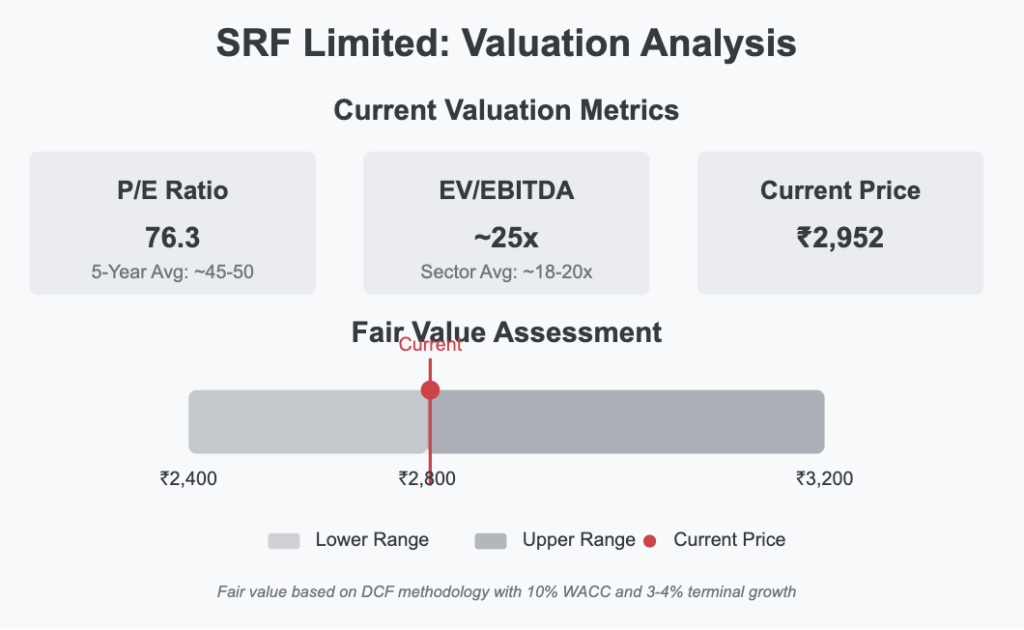
Current Price-to-Earnings Ratio: 76.3, compared to 5-Year Historical Average of ~45-50 The current PE reflects a significant premium to the historical average, suggesting the market has high growth expectations for SRF Limited.
Enterprise Value to EBITDA Multiple: ~25x, compared to Sector Average of ~18-20x This premium valuation requires flawless execution of growth initiatives to justify current levels.
Fair Value Assessment
Estimated Fair Value Range: ₹2,400-₹3,200 based on DCF methodology
Assumptions: 10% WACC and terminal growth of 3-4%
Current price of ₹2,952 sits in the upper half of the fair value range
The current valuation suggests limited margin of safety but reasonable long-term return potential if execution meets expectations.
“Our Chemicals business performance reflects our strategic focus on value-added products and continuous innovation. The improved margin profile demonstrates our ability to maintain pricing power even in challenging market conditions.”
CFO on Capital Expenditure Strategy:
“The capital expenditure plan for the next 12-18 months is highly targeted, focusing on high-return projects that enhance our competitive positioning rather than pure capacity expansion. We believe this disciplined approach will drive sustainable shareholder returns.”
Business Head, Packaging Films Division:
“Export markets, particularly for our packaging films business, represent a significant growth opportunity. We’re seeing strong traction in North America and Europe where our quality and innovation capabilities give us an edge over regional competitors.”
Technical Analysis & Chart Patterns
The stock has been trading in a consolidation range between ₹2,800-₹3,100 for the past three months, forming a symmetrical triangle pattern that suggests a potential breakout in the coming weeks. Key support levels exist at ₹2,800 and ₹2,650, while resistance levels are established at ₹3,100 and ₹3,250.
The 200-day moving average at approximately ₹2,750 provides a strong technical floor, with trading volumes showing healthy accumulation patterns during price dips. This technical setup indicates investor confidence in the company’s medium-term prospects.
Industry Context & Competitive Positioning
SRF Limited maintains a leadership position in the Indian specialty chemicals and technical textiles landscape, with stronger margins and growth rates than peers like Gujarat Fluorochemicals and Navin Fluorine in the chemicals segment. While global competitors like Daikin and Chemours present challenges in international markets, SRF’s integrated production capabilities and domestic market leadership provide competitive advantages.
In the packaging films segment, the company has successfully differentiated itself through value-added products that command premium pricing, unlike pure commodity players who continue to face margin pressures. This strategic positioning has allowed SRF to significantly outperform industry averages in terms of margin expansion.
Conclusion
SRF Limited’s Q3 FY2025 results demonstrate the effectiveness of the company’s strategy focused on value-added products, operational efficiency, and disciplined capital allocation. The successful performance of the Chemicals segment with 24.3% EBIT margins and the remarkable growth in Packaging Films with a 27% year-over-year revenue increase highlight the company’s ability to execute in challenging market conditions.
While the current valuation appears stretched compared to historical and sector averages, the company’s growth trajectory and strategic investments in specialty chemicals and value-added packaging films provide a reasonable justification for the premium. Investors with a long-term horizon may find SRF’s multi-decade growth projections attractive, particularly if the company can successfully execute its expansion plans in high-margin segments and international markets.
The management’s disciplined approach to capital expenditure, focusing on high-return projects rather than pure capacity expansion, further strengthens the investment case. However, investors should remain mindful of execution risks and competitive pressures in global markets that could impact the company’s ability to meet the high expectations embedded in its current valuation.
Disclaimer: This analysis is provided for informational and educational purposes only and does not constitute investment advice. Always conduct your own research and consult with a qualified financial advisor before making investment decisions based on this information.
Ajax Engineering is a market leader in the growing mechanized construction space.
Short-term headwinds due to emission norms, but long-term structural growth is intact.
Entry at current levels could offer 15-18% CAGR returns over the next 10-15 years.
Disclaimer:
This report is for informational purposes only and does not constitute investment advice. Investors should conduct their own research or consult a financial advisor before making investment decisions.
Executive Summary BSE Ltd delivered a standout quarter in Q3 FY2025 with record quarterly revenues, robust profit growth, and operational improvements across its segments. The company’s performance was driven by a surge in transaction charges, expanding market activity in both the cash and derivatives segments, and strategic investments in technology and product innovation. Key metrics remain strong despite a high valuation, reflecting elevated growth expectations.
Q3 Results & Highlights
Record Revenues & Profitability: • Consolidated quarterly revenue reached approximately ₹835.4 crores—up 94% YoY—with operational revenues surging by 108% to ₹773.5 crores. • Net profit attributable to shareholders climbed to around ₹219.7 crores (103% YoY growth). • EBITDA margins improved significantly, with operating EBITDA rising from ₹91.9 crores to ₹236.5 crores (margins expanding from 25% to 31%), and further strengthening to 56% when core SGF contributions are excluded.
Segment Performance: • The primary market segment saw 30 new listings raising a record ₹95,512 crores—up 261% YoY—underscoring robust capital-raising activity. • Trading segments demonstrated resilience with the equity cash market maintaining an average daily turnover of approximately ₹6,800 crores, while the derivatives segment posted its highest-ever average daily premium turnover of around ₹8,758 crores. • Mutual fund distribution revenues jumped by 92% to ₹63.5 crores, driven by a 39% increase in transaction volumes.
Future Growth Plans & Planned Expansions
Technology & Infrastructure: • BSE is set to upgrade its trading systems, including enhancements in clearing and risk management, and is expanding its colocation (COLO) facilities to meet rising demand. • Investments are planned to support a “future-ready” infrastructure, ensuring robust scalability as market volumes increase.
Product & Market Innovation: • Continued development of new derivative products (such as revised Sensex and Bankex contracts) and the introduction of innovative indices through its subsidiary, AIPL, will deepen market participation. • The IPO pipeline remains healthy, with ongoing efforts to attract new listings and further strengthen its position as India’s preferred capital-raising platform.
Future Financial Projections & Long-Term Returns While explicit numerical forecasts for the next 5, 10, 15, and 20 years were not provided, several key factors suggest a favorable long-term outlook:
Growth Drivers: Increasing trading volumes, expansion in the IPO market, and recurring revenue streams (e.g., from transaction charges and listing fees) provide a solid foundation for future revenue growth.
Margin Expansion: Continued operational leverage—particularly as SGF contribution impacts stabilize—could boost profitability over time.
Sustainable Scale: Investments in technology and infrastructure will enable BSE to capture a larger market share and support scalable growth across its diversified product lines. Investors may anticipate that these drivers, if sustained, could lead to attractive long-term returns, albeit subject to market and regulatory risks.
Expense & Operational Analysis
Rising Operating Expenses: • Operating expenses increased by 86%, mainly driven by higher contributions to the core Settlement Guarantee Fund (SGF) due to new SEBI stress testing norms. • However, as trading volumes mature and the incremental SGF impact diminishes, efficiency improvements are expected to support margin expansion.
Cost Management: • Despite short-term expense pressures, ongoing investments in automation and technology are aimed at streamlining operations and reducing per-unit costs over the long term.
Growth Indicators: • Sales and profit growth at 119% and 130%, respectively, underpin a strong growth narrative even as valuation multiples remain on the higher side, implying market expectations of sustained expansion.
Bull Case vs. Bear Case
Bull Case: • Continued innovation and expansion in trading and listing segments can drive further revenue and profit growth. • Enhanced technology, broader investor participation, and an expanding suite of products (including derivatives and mutual funds) could solidify BSE’s market leadership and yield strong long-term returns.
Bear Case: • Regulatory uncertainties (e.g., evolving SGF norms) and market volatility could pressure margins and trading volumes. • A high P/E ratio might expose the stock to corrections if growth drivers fail to meet expectations or if market sentiment shifts. • Competitive pressures from other exchanges might impede market share gains.
CAPEX & Growth Strategy
BSE’s strategic roadmap includes significant CAPEX for technology upgrades and expanded colocation services, aimed at bolstering capacity and improving operational efficiency.
Long-term investments are also targeted at product innovation and enhanced market connectivity, which are essential for sustaining its competitive edge.
Credit Rating & Regulatory Outlook
No notable changes in credit agency ratings were mentioned during the call, suggesting stability in BSE’s credit profile despite ongoing regulatory adjustments.
────────────────────────────── Conclusion & Disclaimer BSE Ltd’s Q3 FY2025 performance underscores its strong operational momentum and strategic positioning within India’s capital markets. With robust revenue and profit growth, coupled with clear plans for technological and product innovation, BSE appears well positioned for sustained long-term growth. However, investors should remain cautious of the inherent regulatory risks and high valuation multiples.
Disclaimer: This report is for informational purposes only and does not constitute investment advice. Investors should conduct their own due diligence before making any investment decisions.