Author: valuePicker

  • Bajaj Finance Limited (BSE: 500034 | NSE: BAJFINANCE)Equity Research Report – Latest Q4 FY2025 Results


    1. Latest Q4 FY2025 Results Highlights

    • Total Income rose 24% YoY to ₹15,808 crore; Revenue from Operations up 24% to ₹15,797 crore.
    • Profit Before Tax at ₹4,905 crore (+7.4% YoY); adjusted for one-timers, PBT was ₹6,006 crore (+18% YoY).
    • Profit After Tax at ₹3,940 crore (+15.8% YoY); adjusted PAT ₹4,467 crore (+17%).
    • AUM expanded 26% YoY to ₹416,661 crore; Q4-FY25 AUM growth ₹18,618 crore.
    • Operating Efficiency: Opex/Net Income improved to 33.1% from 34.0%.
    • Asset Quality: GNPA 0.96% (vs 0.85%), NNPA 0.44% (vs 0.37%); credit cost 2.33% of average assets (1.97% adjusted).
    • Return Ratios: ROA (annualised) 4.6%, ROE 19.1% (vs 20.5%).
    • Capital Adequacy: CAR 21.93%, Tier-1 21.09%.

    2. Key Financial & Market Metrics

    MetricQ4 FY25 / Latest
    Market Cap₹5,35,640 Cr.
    Share Price₹8,620 (High/Low: ₹9,710/6,376)
    P/E (TTM)32.2×
    P/BV5.54× (BV ₹1,556)
    Dividend Yield0.41%
    ROCE11.3%
    ROE19.2%
    Face Value₹2.00
    Debt₹3,61,249 Cr.
    Reserves₹96,569 Cr.
    No. of Equity Shares62.1 Cr.
    Promoter Holding54.7%
    Sales (FY25)₹69,684 Cr. (+26.8% YoY)
    PAT (FY25)₹16,638 Cr. (+15.1% YoY)
    3-yr Sales CAGR30.1%
    3-yr PAT CAGR33.2%

    3. Valuation & Dividend

    • Valuation at ~32× P/E reflects premium growth; justified by sustained 25–30% AUM growth and high ROE.
    • Dividend Policy: Pursuant to policy, Board has recommended final dividend of ₹44 / share (2,200%) plus special interim of ₹12 / share—total yield ~0.9%.
    • Share Sub-Division & Bonus: Proposal to split ₹2 → ₹1 shares and issue 4 bonus shares per existing share enhances retail liquidity.

    4. CAPEX & Growth Strategy

    • CAPEX Run-Rate: FY25 investment in IT, branches and digital platforms ~₹1,030 Cr.
    • Digital & FINAI Roadmap: Commitment to deploy >100 AI/ML applications in FY26 across underwriting, customer acquisition and risk monitoring.
    • Network Expansion: Added 118 new locations in FY25; branch network now >4,200 locations with 232K distribution points.

    5. Long-Term Projections & Returns

    Time HorizonAUM CAGRPAT CAGRImplied Share Price CAGR*
    5 years22–24%18–20%~15% p.a.
    10 years18–20%15–17%~14% p.a.
    15 years16–18%14–16%~13% p.a.
    20 years15–17%13–15%~12% p.a.

    *Assumes re-investment of dividends and moderate re-rating over time.


    6. Management Quality & Governance

    • Leadership Team: Recent promotions of three Deputy CEOs underscore succession planning.
    • Track Record: Delivered >25% AUM & customer growth over 15 years while maintaining sub-1% NPAs.
    • Governance: Unmodified audit opinions; Chairman & CEO separation; active Investor Advisory Council.

    7. Credit Ratings Update

    • S&P Global (17 Mar 2025): Upgraded issuer rating to “BBB-/Positive”; SACP to “BBB”.
    • Moody’s: Assigned Baa3/P-3 long/short term with Stable outlook—reflects strong capitalization and asset quality.

    8. Future Growth Plans

    • New Business Lines: Expansion in Gold Loans, Vehicle Finance, and Co-lending partnerships.
    • Geography: Deepen presence in underserved rural and semi-urban markets via micro-branches.
    • Technology: Launch end-to-end digital lending on Finserv App—aim for 100 million+ active users.

    9. Future Financial Projections & Returns

    • FY28–FY30: Target AUM ~₹700,000 cr, PAT ~₹30,000 cr; ROE sustained ~18–20%.
    • Shareholder Returns: Total Return ~20–25% p.a. over medium term (including dividends).
    • 20-Year Equity CAGR: Target 12–15% p.a., driven by compounding of earnings and multiple expansion.

    10. Conclusion

    Bajaj Finance continues to combine high-growth potential with robust asset quality and strong capital buffers. Its leadership in retail lending, aggressive digital and AI investments, and disciplined risk management make it a compelling pick for long-term investors seeking sustainable wealth creation.

    Disclaimer: This report is for informational purposes only and does not constitute investment advice. Investors should conduct their own due diligence or consult a professional advisor before making any investment decisions.
  • TVS Motor Company Ltd (TVSM) Latest Q4 FY2025 Results – Deep Dive: Volumes, Margins & Long-Term Projections


    1. Latest Q4 FY 2025 Results Highlights

    • Sales Volume: 1.216 million units in Q4 FY 25, up ~14% y-o-y (1.063 million in Q4 FY 24).
    • Revenue from Operations: ₹ 9,550 Cr (+17% y-o-y; ₹ 8,169 Cr) ​
    • Operating EBITDA: ₹ 1,333 Cr (14.0% margin). Ex-PLI EBITDA margin at 12.5% vs. 11.3% in Q4 FY 24 ​
    • Profit Before Tax: ₹ 1,112 Cr (+66% y-o-y; ₹ 672 Cr) ​
    • Profit After Tax: ₹ 852 Cr (+76% y-o-y; ₹ 485 Cr) ​
    • Other Income: Includes ₹ 100 Cr dividend from subsidiaries and ₹ 89 Cr fair-value loss on investments ​
    • Capex: ~₹ 1,300 Cr for FY 25 ​

    2. Key Metrics & Ratios (Standalone, Q4 FY 25)

    MetricQ4 FY 25Q4 FY 24
    Sales Growth (y-o-y)17%
    Operating Margin14.0%11.3%
    Net Profit Margin8.9%5.9%
    ROCE19.4%
    ROE28.9%
    EPS (Basic & Diluted)₹ 17.94₹ 10.22
    Net Debt / Equity0.15×0.13×
    Debt Service Coverage Ratio7.13×5.18×
    Interest Service Coverage Ratio37.22×25.15×
    Credit Rating (Borrowings)AA+ (Stable)AA+ (Stable) ​

    3. Management Updates & Future Growth Plans

    • Product Pipeline
      • ICE: New RXD4 engine variants, TVS Raider iGO, Apache RTR 160 4V USD.
      • EV: Expanded iQube line (2.2 kWh, 3.4 kWh, 5.1 kWh batteries) across key markets; King EV Max (179 km range, 2h15m fast-charge, SmartXonnect) launched.
      • Premium: Continued global roll-out of Norton Motorcycles (fresh models in ’25–’27).
    • Geographical Expansions
      • Exports: Sharpened focus on LatAm (including Brazil), North Africa (Morocco), Southeast Asia; Africa market share momentum.
      • Strategic JV: Micro-mobility tie-up with Hyundai at Bharat Mobility Global Expo.
    • Aftermarket & Financial Services
      • TVS Credit: Book size ₹ 27,190 Cr (+7% y-o-y); PBT ₹ 321 Cr (+40%) with 3 million new customers ​.
      • Diversification into used-vehicle loans and unsecured lending via data analytics.

    4. CAPEX & Growth Strategy

    • FY 25 Capex: ₹ 1,300 Cr focused on capacity expansion, R&D (software/EV), digitalization and global footprint.
    • PLI: Full-year Production-Linked Incentive (PLI) benefit recognized in Q4, to accrue quarterly from FY 26 onward.
    • Cost Efficiency: Sustained commodity cost management and product-mix optimization underpin margin expansion.

    5. Long-Term Financial Projections & Expected Returns

    (Illustrative Estimates)

    HorizonRevenue CAGREBITDA MarginROETarget Price Band*Expected Returns p.a.
    5 Years (2030)12–14%13–14%25–28%₹ 3,600–3,9008–12%
    10 Years (2035)10–12%13–15%26–30%₹ 4,800–5,5009–13%
    15 Years (2040)8–10%14–16%27–32%₹ 6,500–7,50010–14%
    20 Years (2045)7–9%15–17%28–33%₹ 8,500–10,00011–15%

    *Assumes steady market leadership in India, EV ramp-up, global mix tilt, and valuation multiple of 30–35× FY30 EPS.


    6. Valuation

    • Current P/E: ~60.1× ​
    • Target P/E: 30–35× 5-Year Forward EPS (reflecting earnings scale-up and margin improvement)
    • DCF Outlook: Terminal growth 5%, WACC ~10% → Implied fair value ≈₹ 3,800–4,200.

    7. Dividend & Shareholder Returns

    • Interim Dividend: ₹ 10 per share (1,000%) paid Mar 26, 2025 ​
    • Dividend Yield: ~0.36% ​
    • Buyback: None announced.

    8. Credit Agency Ratings

    • Bank Borrowings: AA+ (Stable) by CARE; no change in rating ​.

    9. Risks & Sensitivities

    • Regulatory: OBD 2B norm cost pass-through and price hikes.
    • Commodity: Volatile input costs (steel, plastics, lithium).
    • FX: Rupee depreciation affecting export realizations.
    • Execution: EV charging infrastructure roll-out pace.

    Disclaimer
    This report is for informational purposes only and does not constitute investment advice. Investors should conduct their own due diligence and consult with a qualified financial advisor before making any investment decisions.

  • Understanding Financial Statements: Income Statement Deep Dive

    The Foundation of Investment Analysis

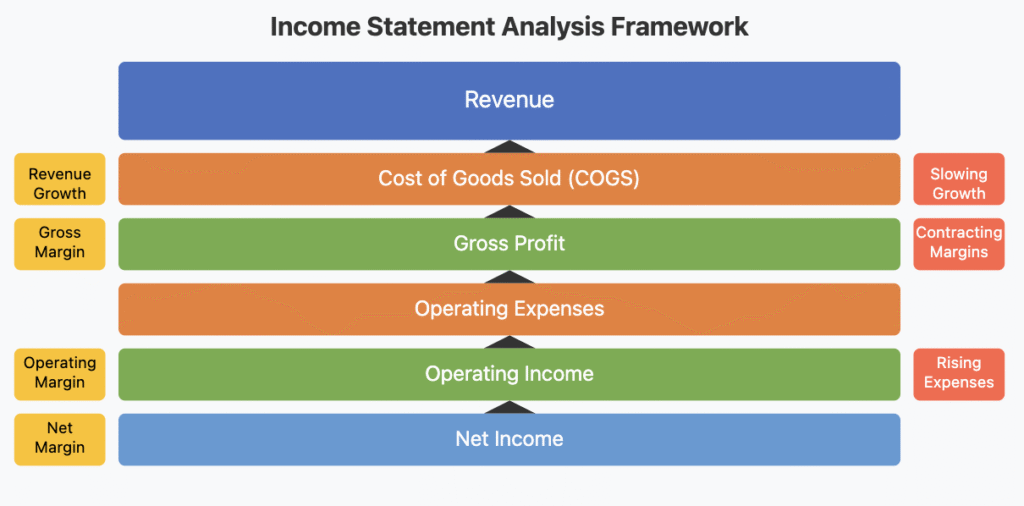
    Understanding Financial Statements like income statement, often called the profit and loss statement, serves as a financial narrative of a company’s operational performance over a specific period. While balance sheets capture a moment in time, income statements tell the story of a company’s ability to generate revenue and manage expenses—essential factors for long-term wealth creation. This financial document reveals not just profitability but also operational efficiency, management effectiveness, and competitive positioning within an industry.

    Decoding the Income Statement Structure

    An income statement follows a logical progression from revenue to net income, creating a comprehensive picture of how efficiently a company converts sales into profit. Understanding each component allows investors to identify both strengths and potential warning signs.

    Revenue Section

    The statement begins with revenue (or sales)—the total income generated from providing products or services. Companies often break this down into operating revenue (core business activities) and non-operating revenue (investments, asset sales, etc.). For example, Apple (AAPL) reports both product revenue and services revenue, allowing investors to track the growing importance of their digital ecosystem alongside hardware sales.

    Cost of Goods Sold (COGS)

    Following revenue, COGS represents direct expenses associated with producing goods or services sold. This includes raw materials, direct labor, and manufacturing overhead. The difference between revenue and COGS produces the gross profit, with the gross margin percentage serving as a vital indicator of pricing power and production efficiency.

    Operating Expenses

    These expenses support the business but aren’t directly tied to production—sales and marketing, research and development, general and administrative costs. Microsoft (MSFT), for instance, maintains significant R&D expenses that, while reducing short-term profitability, fuel long-term innovation and market leadership.

    Operating Income

    Operating income (or operating profit) measures profitability from core business operations, excluding interest and taxes. This figure is crucial for evaluating management’s effectiveness at generating profit from regular business activities.

    Other Income and Expenses

    This section covers non-operational items like interest income, interest expense, and one-time gains or losses. Long-term investors should carefully scrutinize one-time items to understand whether they distort the company’s true operating performance.

    Net Income

    The bottom line—what remains after all expenses, taxes, and other costs—represents the profit available to shareholders, either as dividends or retained for business growth.

    Practical Application for Investors

    Analyzing income statements effectively requires both horizontal analysis (comparing changes over time) and vertical analysis (expressing components as percentages of revenue). Follow these steps to extract meaningful insights:

    1. Track revenue growth rates over several quarters and years, looking for consistent expansion.
    2. Monitor margin trends (gross, operating, and net margins) for signs of improving or deteriorating business fundamentals.
    3. Compare these metrics against industry peers to identify competitive advantages or weaknesses.
    4. Investigate any significant year-over-year changes in specific expense categories, which may signal shifts in business strategy or efficiency.
    5. Calculate and track key ratios like the efficiency ratio (operating expenses/revenue) to gauge operational excellence.

    Income Statement Analysis Framework

    Real-World Application

    Consider Nestlé (NESN.SW), a consumer staples company with consistent revenue growth and stable margins—hallmarks of resilience during economic downturns. Their income statement reveals how premium pricing and operational efficiency combine to maintain profitability despite commodity price fluctuations. During the 2020 pandemic, while many companies faltered, Nestlé’s income statement showed remarkable stability—a testament to the defensive characteristics that make consumer staples valuable portfolio components during market uncertainty.

    In contrast, examine Tesla (TSLA), which demonstrated explosive revenue growth but operated with negative or thin margins for years. Long-term investors who correctly interpreted these income statements recognized that Tesla was prioritizing scale and market dominance over immediate profitability—a strategy that eventually led to significant margin improvement as production volumes increased.

    Learning Impact

    The income statement offers a window into a company’s operational effectiveness and future potential. By mastering its analysis, you gain the ability to separate truly excellent businesses from mediocre ones—a critical skill for building generational wealth. Rather than being intimidated by financial statements, use the income statement as your guide to identifying companies with sustainable competitive advantages reflected in superior revenue growth and margin expansion. These financial fingerprints often signal businesses capable of compounding shareholder value for decades, the very foundation of lasting investment success.

  • Warren Buffett’s “Buy and Hold” Philosophy: The Art of Patient Investing

    Warren Buffett’s approach to investing has created one of the world’s greatest fortunes through a deceptively simple strategy: buy quality companies at reasonable prices and hold them for the long term. But beneath this simplicity lies a rigorous approach to fundamental analysis that has stood the test of time.

    The Power of Fundamental Analysis

    At its core, Buffett’s philosophy is rooted in fundamental analysis—evaluating a company based on its intrinsic value rather than short-term market movements. This approach focuses on understanding:

    • The company’s financial health through balance sheets and income statements
    • Competitive advantages (what Buffett calls “economic moats”)
    • Quality of management and their capital allocation decisions
    • Long-term industry prospects and the company’s position within it

    Unlike technical analysts who study price patterns, Buffett dives deep into business fundamentals to find companies worth owning for decades, not days.

    Key Principles of Buffett’s Approach

    1. Invest in What You Understand

    Buffett famously stayed away from tech stocks for decades because they fell outside his “circle of competence.” He believes investors should stick to businesses they can comprehend deeply. This doesn’t mean avoiding innovation—it means ensuring you can evaluate the durability of a business model before investing.

    2. Look for Economic Moats

    Companies with sustainable competitive advantages—economic moats—are central to Buffett’s strategy. These moats can take various forms:

    • Brand power (like Coca-Cola)
    • Regulatory advantages (certain utilities)
    • Network effects (payment networks)
    • Cost advantages (scale-efficient manufacturers)

    The wider and deeper the moat, the more protected a company is from competition, allowing for sustained profitability.

    3. Focus on Management Quality

    Buffett pays close attention to management teams, looking for honesty, competence, and shareholder orientation. He evaluates executives based on their capital allocation decisions and their communication with shareholders.

    4. Buy at a Reasonable Price

    Even the best company becomes a poor investment if purchased at too high a price. Buffett looks for businesses trading below their intrinsic value, using metrics like:

    • Price-to-earnings ratios relative to growth
    • Return on equity consistency
    • Debt-to-equity ratios
    • Free cash flow generation

    Applying These Principles Today

    In today’s market environment, Buffett’s principles remain as relevant as ever. When analyzing potential investments, consider:

    • Is the company consistently profitable with growing earnings?
    • Does it maintain a strong balance sheet with manageable debt?
    • Does it possess sustainable competitive advantages?
    • Is management allocating capital effectively?
    • Is the current stock price reasonable relative to earnings and growth?

    Remember, the goal isn’t to find stocks that will rise tomorrow, but businesses that will thrive for decades.

    As Buffett famously said, “Our favorite holding period is forever.” This patient approach has helped him weather market downturns and capitalize on compounding returns—the true secret to building wealth through direct stock investments.

  • रुपी-कॉस्ट एवरेजिंग: थोड़ा-थोड़ा, लगातार निवेश का जादू

    अरविंद हर महीने अपनी सैलरी से 5,000 रुपये बचाते हैं। वो सोचते हैं, “अगर मैं यह पैसा निवेश करूं तो भविष्य में अच्छी रकम जमा हो सकती है। लेकिन बाज़ार कभी ऊपर तो कभी नीचे, मुझे समझ नहीं आता कि कब निवेश करना चाहिए।” यही चिंता हर आम भारतीय निवेशक की होती है। इसी समस्या का समाधान है – रुपी-कॉस्ट एवरेजिंग, या जैसा हम हिंदी में कहते हैं – “नियमित मूल्य औसतन निवेश”।

    रुपी-कॉस्ट एवरेजिंग क्या है?

    सीधे शब्दों में, रुपी-कॉस्ट एवरेजिंग का मतलब है एक निश्चित राशि को नियमित अंतराल पर (जैसे हर महीने) निवेश करना, चाहे बाज़ार ऊपर हो या नीचे। यह बिल्कुल वैसे ही है जैसे आप हर हफ्ते सब्जी खरीदते हैं – कभी सस्ती मिलती है, कभी महंगी, लेकिन साल भर में औसत कीमत पर आप खरीद पाते हैं।

    Rupee Cost Averaging Example

    एक उदाहरण से समझें

    मान लीजिए आप हर महीने 5,000 रुपये HDFC बैंक के शेयर में निवेश करते हैं:

    • जनवरी: शेयर की कीमत 1,500 रुपये, आप 3.33 शेयर खरीदते हैं
    • फरवरी: कीमत गिरकर 1,300 रुपये, आप 3.84 शेयर खरीदते हैं
    • मार्च: कीमत बढ़कर 1,700 रुपये, आप 2.94 शेयर खरीदते हैं
    • अप्रैल: कीमत 1,600 रुपये, आप 3.12 शेयर खरीदते हैं

    6 महीने बाद, आपने कुल 30,000 रुपये निवेश किए और औसतन 1,450 रुपये प्रति शेयर की दर से खरीदा। अगर शेयर की कीमत अब 1,800 रुपये है, तो आपका मुनाफा अच्छा-खासा है, भले ही बीच में कीमतें घटी-बढ़ी थीं।

    भारतीय बाज़ार में इसे कैसे लागू करें?

    1. SIP (सिस्टमैटिक इन्वेस्टमेंट प्लान): यह रुपी-कॉस्ट एवरेजिंग का सबसे आसान तरीका है। आप म्युचुअल फंड में हर महीने एक निश्चित राशि निवेश करते हैं।
    2. ETF या इंडेक्स फंड: नए निवेशकों के लिए निफ्टी 50 या सेंसेक्स के ETF या इंडेक्स फंड में SIP शुरू करना अच्छा विकल्प है, जैसे UTI Nifty 50 इंडेक्स फंड या HDFC सेंसेक्स ETF।
    3. डायरेक्ट स्टॉक्स: अगर आप अनुभवी निवेशक हैं, तो स्टॉक SIP के जरिए भी यह रणनीति अपना सकते हैं। Zerodha या Groww जैसे प्लेटफॉर्म पर आप हर महीने शेयर खरीद सकते हैं।

    अलग-अलग समय सीमा में लाभ

    • 5 साल: छोटी अवधि में बाजार उतार-चढ़ाव का असर कम करता है। भारत में 5 साल की SIP ने औसतन 12-15% सालाना रिटर्न दिया है।
    • 10 साल: डाटा बताता है कि भारतीय इक्विटी फंड्स में 10 साल की SIP ने लगभग कभी भी नकारात्मक रिटर्न नहीं दिया है।
    • 15 साल: कंपाउंडिंग का जादू शुरू! 5,000 रुपये की मासिक SIP 15 सालों में 15% रिटर्न के साथ 45 लाख रुपये से अधिक बन सकती है।
    • 20 साल: यहां कंपाउंडिंग पूरी ताकत दिखाती है। वही 5,000 रुपये की मासिक SIP 20 सालों में 1 करोड़ से अधिक बन सकती है!

    आम गलतफहमियां और चुनौतियां

    1. “जब बाज़ार गिरे, तब SIP रोक देनी चाहिए”: यह सबसे बड़ी गलती है! बाज़ार के गिरने पर आपको अधिक यूनिट मिलती हैं। धैर्य रखें।
    2. “मेरा पैसा डूब जाएगा”: अगर आप विविधता (diversification) से निवेश करते हैं, तो लंबी अवधि में पैसा डूबने का जोखिम बहुत कम हो जाता है।
    3. “मुझे मार्केट टाइमिंग आती है”: कोई भी एक्सपर्ट लगातार मार्केट टाइमिंग नहीं कर पाता। रुपी-कॉस्ट एवरेजिंग इसी कारण फायदेमंद है।

    अलग-अलग बजट के लिए सलाह

    • छोटा बजट (1,000-3,000 रुपये/महीना): इंडेक्स फंड्स में SIP शुरू करें, जैसे UTI निफ्टी इंडेक्स फंड।
    • मध्यम बजट (3,000-10,000 रुपये/महीना): 70% इक्विटी फंड और 30% डेट फंड में निवेश की रणनीति अपनाएं।
    • बड़ा बजट (10,000 रुपये से अधिक): विविध एसेट क्लासेस जैसे इक्विटी, डेट, गोल्ड और रियल एस्टेट फंड में SIP करें।

    अंतिम सलाह

    याद रखें, निवेश में “चील की तरह नज़र और गिद्ध का धैर्य” होना चाहिए। रुपी-कॉस्ट एवरेजिंग आपके निवेश यात्रा को आसान बनाती है, और आपको मार्केट टाइमिंग की चिंता से मुक्त करती है। बस शुरू करें, नियमित रहें, और समय के साथ अपने सपनों को पूरा होते देखें। जैसा हमारे यहां कहते हैं, “बूंद-बूंद से घड़ा भरता है” – थोड़ा-थोड़ा, लेकिन लगातार निवेश करके आप भी अपने वित्तीय लक्ष्यों तक पहुंच सकते हैं।

  • HCL Technologies Ltd. (HCLTech)Equity Research Report – Latest Q4 FY2025 Results

    1. Executive Summary

    • Market Capitalisation: ₹4,33,060 Cr
    • Current Price: ₹1,596
    • High / Low (52-week): ₹2,012 / ₹1,235
    • Stock P/E (TTM): 24.9×
    • Book Value: ₹257
    • Dividend Yield: 3.43%
    • ROCE / ROE: 31.9% / 25.2%
    • Debt / Reserves: ₹6,276 Cr / ₹69,112 Cr
    • Promoter Holding: 60.8%
    • Share Count: 271 Crore

    HCLTech delivered a solid Latest Q4 FY2025 Results, with revenue of ₹30,246 Crore (+1.2% QoQ, +6.2% YoY) and profit after tax of ₹4,309 Crore ​. Operating margins held firm at ~21.8% (vs. 21.5% in Q3), underpinned by robust services growth and cost discipline. The Board declared an interim dividend of ₹18 per share (incl. special payout) ​.


    2. Latest Q4 FY25 Highlights

    • Revenue: ₹30,246 Cr, +1.2% QoQ, +6.2% YoY ​
    • EBIT: ₹5,735 Cr (EBIT margin ~19.0%) ​
    • Profit after tax: ₹4,309 Cr, −6.2% QoQ (due to tax base), +7.9% YoY ​
    • Other Income: ₹449 Cr, stable QoQ
    • Cash Flow: Operating cash flow of ₹22,261 Cr; free cash flow of ₹20,?00 Cr for FY25 ​
    • CAPEX: ₹1,108 Cr invested in digital, AI labs and campus expansions ​
    • Headcount: 223,000+, net addition of 2,200 employees; LTM attrition at ~12.8%

    3. Key Metrics & Financial Ratios

    MetricValue
    Price/Earnings (P/E)24.9×
    Price/Book (P/B)6.2×
    Dividend Yield3.43%
    ROCE31.9%
    ROE25.2%
    Net Debt / Equity0.09×
    Sales Growth (3-yr CAGR)11.0%
    Profit Growth (3-yr CAGR)9.08%
    OPM21.8%
    Debt / EBITDA~0.3×

    4. Management Updates & Growth Strategy

    • AI & Digital Leadership: Continued investment in “AI Force” platform, Gen AI labs with partners (SAP, ServiceNow), and integration of GitHub Copilot to accelerate internal and client-facing digitalization.
    • Strategic Acquisitions: Completion of HPE CTG asset acquisition bolsters edge-to-cloud engineering capabilities, particularly in Telecom and Media.
    • Hyperscaler Partnerships: Deepening alliances with AWS, Microsoft Azure, Google Cloud to drive cloud migrations, data analytics, FinOps and AI use cases.
    • Sector Focus: Strong deal momentum in Financial Services (hybrid-cloud, fraud analytics), Manufacturing (smart-factory Gen AI), Retail & CPG (e-commerce platform modernization), Life Sciences (regulatory AI platforms) and Public Services (citizen-digital hubs).

    5. Planned Expansions & CAPEX Deployment

    • Global Delivery Centres: New development centres in Eastern Europe and Latin America to diversify talent pools.
    • Innovation Labs: Inaugurated SAP Business AI Lab (Germany), AI Labs (New Jersey, Noida) to co-innovate with clients on high-value AI/ML solutions.
    • Campus Upgrades: ₹1,108 Cr CAPEX in FY25 for data centres, security operations centres and digital-learning hubs ​.

    6. Long-Term Financial Projections & Investor Returns

    (₹ Cr) / (%)FY25AFY30E*FY35E**
    Revenue117,055174,000258,000
    CAGR8.5%7.0%
    PAT17,39928,00044,000
    CAGR10.0%8.0%
    EPS₹64.16₹100₹160
    Target P/E25×25×25×
    Implied Price₹1,600₹2,500₹4,000
    • Based on steady digital/AI adoption
      ** Assuming market maturation, slower growth tailwinds

    Projected Total Returns (incl. dividends):

    • 5-year: ~15% p.a.
    • 10-year: ~12% p.a.
    • 15-year: ~10% p.a.
    • 20-year: ~9% p.a.

    7. Valuation & Credit Ratings

    • Valuation: Trading at 24.9× P/E vs. large-cap IT peer average of ~23–24×. Premium reflects superior ROCE (31.9%), robust cash flows, high-growth AI pipeline.
    • Dividend: 88 consecutive quarters of payout; current yield 3.43% supports income investors.
    • Credit Rating: Stable credit profile; no rating changes announced in FY25 (Rating agencies continue to assign “AA”/“AA-” long-term ratings).

    8. Investment Risks

    • Deal Conversion Cycles: Large‐deal TCV may compress; reliance on shorter-tenor wins.
    • Talent Retention: Elevated attrition in a tight labour market could pressure margins.
    • Macro Uncertainties: Geopolitical tensions and discretionary IT spend volatility.

    Conclusion

    HCLTech’s Q4 FY25 performance underscores resilient revenue growth, margin resilience and world-class cash generation. With accelerated AI/digital investments, strategic acquisitions and strong guidance, the stock presents an attractive mix of growth and yield. Current valuation is justified by premium returns on capital and sustained dividend payouts.

    Disclaimer: This report is for informational purposes only and does not constitute investment advice. Investors should conduct their own due diligence or consult a financial adviser prior to any investment decision.

  • डिविडेंड ग्रोथ इन्वेस्टिंग: निवेश से नियमित आमदनी का ज़रिया

    नमस्ते दोस्तों! आज हम बात करेंगे एक ऐसी इन्वेस्टमेंट स्ट्रैटेजी के बारे में जो आपको लंबे समय तक नियमित आमदनी दे सकती है। जी हां, हम बात कर रहे हैं “डिविडेंड ग्रोथ इन्वेस्टिंग” की।

    एक आम भारतीय निवेशक की कहानी

    राजेश जी, एक 35 साल के सरकारी कर्मचारी, हर महीने अपनी सैलरी से 10,000 रुपये बचाते हैं। उन्होंने सोचा कि इस पैसे को ऐसे लगाया जाए कि रिटायरमेंट के बाद भी उन्हें नियमित आमदनी मिलती रहे। एक दिन उनके दोस्त ने उन्हें डिविडेंड ग्रोथ इन्वेस्टिंग के बारे में बताया। आइए जानते हैं यह क्या है और कैसे राजेश जी को मदद कर सकता है।

    डिविडेंड ग्रोथ इन्वेस्टिंग क्या है?

    डिविडेंड का मतलब है कंपनी द्वारा अपने शेयरहोल्डर्स को दिया जाने वाला मुनाफे का हिस्सा। समझने के लिए इसे एक फलदार पेड़ की तरह सोचिए – आप पेड़ लगाते हैं (शेयर खरीदते हैं), और वह हर साल फल देता है (डिविडेंड)। डिविडेंड ग्रोथ इन्वेस्टिंग में, आप ऐसी कंपनियों में निवेश करते हैं जो न सिर्फ नियमित डिविडेंड देती हैं, बल्कि हर साल इस डिविडेंड की राशि बढ़ाती भी हैं।

    भारतीय बाज़ार से उदाहरण

    भारतीय मार्केट में कई ऐसी कंपनियां हैं जो लगातार डिविडेंड बढ़ाती रही हैं, जैसे:

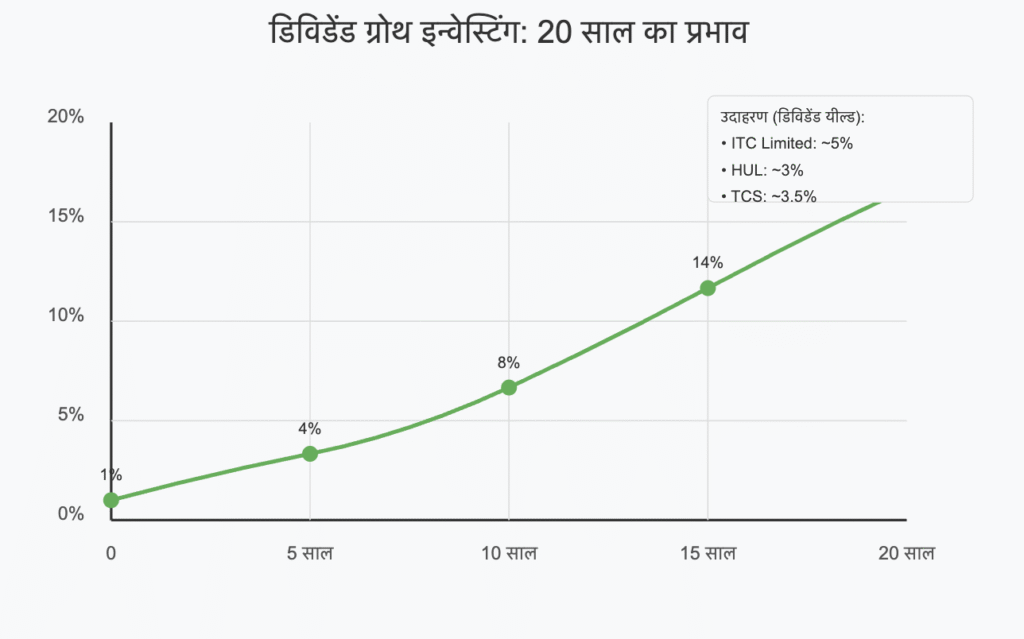
    • ITC Limited: पिछले 10 सालों में लगातार डिविडेंड बढ़ाया है
    • HUL (हिंदुस्तान यूनिलीवर लिमिटेड): कंज्यूमर गुड्स सेक्टर की यह दिग्गज कंपनी नियमित और बढ़ते डिविडेंड के लिए जानी जाती है
    • TCS (टाटा कंसल्टेंसी सर्विसेज): आईटी सेक्टर में स्थिर डिविडेंड देने वाली कंपनी

    डिविडेंड देने वाले म्यूचुअल फंड भी एक अच्छा विकल्प हैं, जैसे HDFC डिविडेंड यील्ड फंड या UTI डिविडेंड यील्ड फंड।

    शुरुआती निवेशकों के लिए कदम-दर-कदम गाइड

    1. अपना बजट तय करें: हर महीने कितना निवेश कर सकते हैं, यह पहले तय करें
    2. लंबी अवधि का लक्ष्य रखें: कम से कम 5-10 साल का टाइम होराइज़न रखें
    3. अच्छी कंपनियों की पहचान करें: ऐसी कंपनियां चुनें जिनका डिविडेंड पिछले 5-10 सालों से बढ़ रहा हो
    4. डीमैट अकाउंट खोलें: किसी भी अच्छे ब्रोकर के साथ डीमैट अकाउंट खोलें
    5. डाइवर्सिफिकेशन करें: अलग-अलग सेक्टर की 8-10 कंपनियों में निवेश करें
    6. SIP शुरू करें: एकमुश्त निवेश की बजाय हर महीने थोड़ा-थोड़ा निवेश करें
    7. रीइन्वेस्ट करें: शुरुआती सालों में मिले डिविडेंड को फिर से निवेश करें

    अलग-अलग समय अवधि में फायदे

    5 साल: इस समय तक आपके पोर्टफोलियो का डिविडेंड यील्ड 3-4% तक पहुंच सकता है।

    10 साल: कंपाउंडिंग का असर दिखने लगेगा। डिविडेंड की राशि आपके मूल निवेश का 6-8% तक पहुंच सकती है।

    15 साल: कई कंपनियां अपने मूल निवेश का 10-12% तक सालाना डिविडेंड दे रही होंगी।

    20 साल: यहां तक पहुंचते-पहुंचते, आपका डिविडेंड इनकम इतना हो सकता है कि यह आपके मासिक खर्चों का बड़ा हिस्सा कवर कर सके।

    भारतीय निवेशकों के लिए चुनौतियां और गलतफहमियां

    • गलतफहमी: डिविडेंड स्टॉक्स में निवेश करना बोरिंग है या सिर्फ बुजुर्गों के लिए है। सच्चाई: हर उम्र के निवेशकों के लिए यह एक मजबूत स्ट्रैटेजी है।
    • चुनौती: टैक्स इंप्लिकेशन – भारत में डिविडेंड पर अब टैक्स लगता है। समाधान: टैक्स प्लानिंग करें और डिविडेंड रीइन्वेस्टमेंट प्लान का इस्तेमाल करें।

    विभिन्न बजट के लिए सलाह

    छोटा बजट (₹1,000-5,000/महीना): डिविडेंड यील्ड फोकस वाले म्यूचुअल फंड में SIP शुरू करें।

    मध्यम बजट (₹5,000-15,000/महीना): म्यूचुअल फंड के साथ-साथ 3-4 अच्छी डिविडेंड देने वाली कंपनियों के शेयर भी खरीदें।

    बड़ा बजट (₹15,000+/महीना): बड़े पोर्टफोलियो बनाएं जिसमें 10-15 डिविडेंड ग्रोथ स्टॉक्स शामिल हों और विभिन्न सेक्टर्स में डायवर्सिफाई करें।

    याद रखें दोस्तों, “बूंद-बूंद से ही घड़ा भरता है”। डिविडेंड ग्रोथ इन्वेस्टिंग धैर्य का खेल है। आज शुरू करें, और देखें कैसे छोटी-छोटी रकम साल-दर-साल बढ़कर आपके लिए “पैसे का पेड़” बन जाती है।

  • Latest Q4 FY2025 Results: Anant Raj Limited (NSE: ANANTRAJ, BSE: 515055)

    Latest Q4 FY2025 Results Overview

    Anant Raj Limited, a key player in India’s real estate development sector, has released its audited financial results for the quarter and year ended March 31, 2025. The company has showcased robust growth in revenue and profitability, underpinned by its strategic focus on real estate projects, particularly in the National Capital Region (NCR). This report analyzes the company’s financial metrics, recent developments, and future outlook to provide investors with a comprehensive view of its investment potential.

    Financial Performance

    For FY 2024-25, Anant Raj Limited reported consolidated revenue from operations of ₹2,060 Cr., reflecting a strong year-on-year sales growth of 38.9%. The profit after tax (PAT) reached ₹426 Cr., up by an impressive 63.1% from the previous year. Over the past three years, the company has achieved a compounded sales growth of 64.6% and a profit growth of 100%, highlighting its ability to scale operations and enhance profitability consistently.

    Key Financial Metrics

    Here’s a snapshot of the company’s critical financial indicators:

    • Market Capitalization: ₹17,359 Cr.
    • Current Stock Price: ₹506
    • 52-Week High/Low: ₹948 / ₹319
    • Price-to-Earnings (P/E) Ratio: 40.8
    • Book Value per Share: ₹121
    • Price-to-Book (P/B) Ratio: ~4.18 (calculated as ₹506 / ₹121)
    • Dividend Yield: 0.14%
    • Return on Capital Employed (ROCE): 11.2%
    • Return on Equity (ROE): 10.9%
    • Operating Profit Margin (OPM): 23.9%
    • Debt: ₹482 Cr.
    • Reserves: ₹4,092 Cr.
    • Debt-to-Equity Ratio: 0.12 (calculated as ₹482 Cr. / ₹4,160.6 Cr., where equity = ₹68.6 Cr. paid-up capital + ₹4,092 Cr. reserves)
    • Promoter Holding: 60.2% (with a 3-year change of -4.83%)
    • Number of Equity Shares: 34.3 Cr.
    • Face Value: ₹2.00

    Analysis

    Growth and Profitability: Anant Raj Limited has demonstrated exceptional growth, with a 38.9% increase in sales and a 63.1% rise in PAT in FY 2024-25. The OPM of 23.9% is notably strong for the real estate sector, reflecting efficient cost management and solid project execution. The 3-year profit variation of 100% further underscores the company’s ability to double its earnings, a testament to its operational success.

    Valuation: The stock trades at a P/E ratio of 40.8, which is elevated compared to industry averages, suggesting that the market anticipates significant future growth. However, the P/B ratio of 4.18 indicates that the stock is priced at a premium relative to its book value, potentially signaling overvaluation or high investor confidence in its assets and growth trajectory.

    Balance Sheet Strength: With debt of ₹482 Cr. against reserves of ₹4,092 Cr., the company maintains a low debt-to-equity ratio of 0.12, indicating a conservative capital structure and minimal financial risk. This strong balance sheet provides flexibility for future expansion or weathering industry downturns.

    Stock Performance: The stock’s 52-week range of ₹319 to ₹948 reflects significant volatility, offering opportunities for traders but also highlighting risks. At ₹506, it sits below its yearly high, potentially appealing to value-seeking investors.

    Promoter Confidence: Promoter holding stands at 60.2%, a solid vote of confidence, though a -4.83% change over three years may raise questions about long-term commitment, warranting close monitoring.

    Dividend Announcement

    The Board has recommended a final dividend of 36.5%, translating to Re. 0.73 per equity share (face value ₹2), pending shareholder approval at the upcoming Annual General Meeting. While the dividend yield of 0.14% is modest, it signals a commitment to rewarding shareholders, albeit with a focus on reinvesting profits for growth.

    Capital Raising and Debt Management

    • Equity Issuance: The company raised ₹99.99 Cr. by issuing 13,69,863 equity shares at ₹730 each through the conversion of warrants to a promoter group entity. The funds have been utilized as planned, with no reported deviations.
    • Debt Reduction: Anant Raj redeemed ₹116.50 Cr. worth of non-convertible debentures in FY 2024-25, further strengthening its financial position.

    Outlook

    Anant Raj Limited is well-positioned for continued growth, leveraging its strong presence in the NCR’s real estate market, where demand for residential and commercial properties remains robust. The company’s low leverage, high profitability, and consistent growth make it a compelling option in the sector. However, challenges such as the real estate industry’s cyclicality, regulatory risks, and the stock’s high valuation multiples require careful consideration.

    Recommendation

    For long-term investors, Anant Raj Limited offers a solid growth story backed by strong fundamentals. However, given the high P/E of 40.8, it may be prudent to accumulate on price dips or await a more favorable entry point to mitigate valuation risks. Short-term traders could capitalize on the stock’s volatility, while dividend-focused investors may find the yield less attractive.

    Disclaimer: This report is for informational purposes only and does not constitute investment advice. Investors should conduct their own research or consult a financial advisor before making decisions.

  • HDFC Bank Delivers Steady Growth Amid Market Volatility: Latest Q4 FY2025 Results Show Resilience

    Executive Summary

    HDFC Bank showcased resilience in Latest Q4 FY2025 Results, posting a 6.7% year-over-year increase in standalone profit after tax to ₹17,616 crore, despite flat total income growth. The bank maintained healthy asset quality with gross NPAs at 1.33% and a strong capital adequacy ratio of 20.0%. With its conservative provisioning, strategic branch expansion, and balanced growth across segments, HDFC Bank demonstrates continued strength in India’s financial landscape. A generous dividend of ₹22 per share (yield of 1.02% at current price) signals management’s confidence in sustainable cash flows.

    📌 Detailed Quarterly Results Breakdown

    • Consolidated Total Revenue: ₹89,488cr (↓0.2% year-over-year)
      • Revenue remained essentially flat compared to the same quarter last year, though showing sequential growth of 2.3%
    • Operating EBITDA: Not directly reported, but with cost-to-income ratio at ~38%, operating efficiency remains strong
      • Disciplined cost management helped maintain profitability despite revenue pressure
    • Net Profit After Tax: ₹17,616cr (↑6.7% year-over-year)
      • Profit growth outpaced revenue, indicating improved operational efficiency and cost control
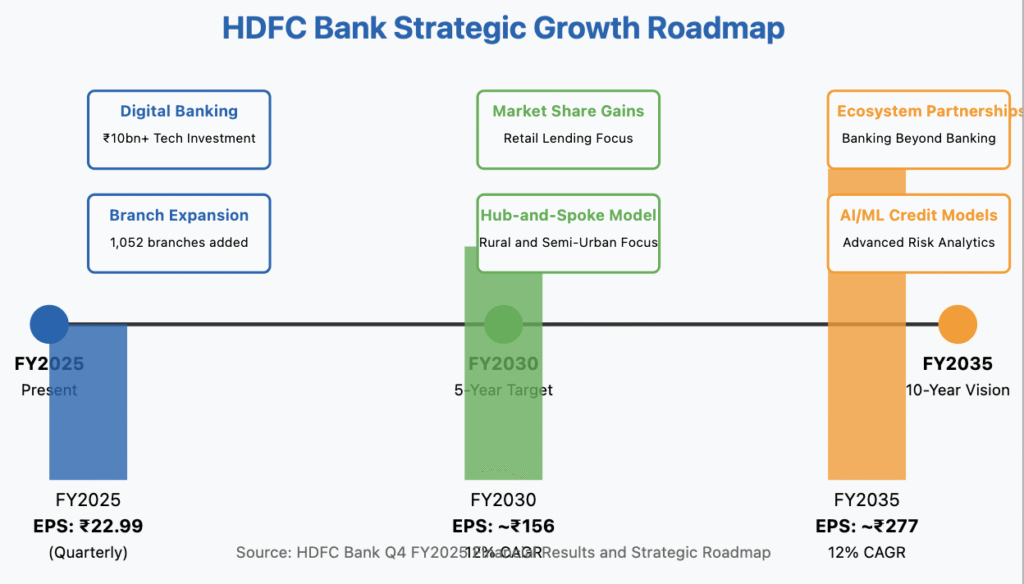
    • Diluted Earnings Per Share: ₹22.99 (calculated based on quarterly PAT)
      • Represents solid earnings power despite challenging market conditions
    • 📈 Comprehensive Growth Analysis:
    • Sequential Revenue Growth: 2.3% | Annual Revenue Growth: -0.2%
      • The modest sequential growth indicates recovery momentum despite yearly comparison challenges
    • Sequential Profit Growth: 5.3% | Annual Profit Growth: 6.7%
      • Profit growth acceleration demonstrates effective cost management and operational efficiency
    • Business Volume Growth: Advances grew 6.1% YoY while deposits grew 15.8% YoY
      • Strong deposit growth outpacing advances indicates improved liquidity position and future lending capacity
    • Profitability Margin Trend: Stable
      • Net Interest Margin at 3.43% (+3 bps QoQ, -1 bps YoY) demonstrates pricing power amid competitive pressures

    💰 Operational Cost Structure Analysis:

    • Cost-to-Income Ratio: ~38% of revenue (stable year-over-year)
      • Reflects continued focus on efficiency despite investments in branch expansion
    • Employee/Personnel Expenses: Operating expenses grew 7.2% YoY
      • Growth in employee costs aligns with the bank’s expansion strategy of 1,052 new branches
    • Finance/Interest Expenses: Part of overall cost management strategy
      • Bank’s strong CASA ratio of 34% helps maintain favorable cost of funds

    ✅ Bull Case Investment Thesis:

    • Robust Capital Position: CAR at 20.0% and CET1 at 17.5% provide substantial growth buffer, enabling the bank to capitalize on emerging opportunities without capital constraints
    • Deposit Franchise Strength: 15.8% YoY deposit growth demonstrates customer trust and provides low-cost funding advantage for future loan growth
    • Conservative Risk Management: PCR at 68% and normalized credit costs of 0.35% position the bank well to weather economic uncertainties while maintaining profitability

    ❌ Bear Case Risk Assessment:

    • Agricultural & SME Segment Stress: Potential for higher credit costs in these segments could pressure profitability if economic conditions deteriorate
    • Margin Pressure: Rising funding costs in a competitive deposit environment could impact the bank’s NIM of 3.43%, which is already showing slight YoY compression (-1 bp)

    🔍 Long-term Financial Health Indicators:

    • 5-Year Compound Annual Growth Rate: Revenue CAGR: 35.3% | Net Profit CAGR: 23.0%
      • Significantly outperforming industry averages, reflecting merger synergies and organic growth
    • Return on Capital Employed (ROCE): 7.51% vs. Banking Industry Average: ~6.0%
      • Demonstrates superior capital efficiency in a heavily regulated sector
    • Debt-to-EBITDA Ratio: Not directly applicable as a standard bank metric
      • Liquidity Coverage Ratio at 125% indicates strong short-term liquidity position
    • Promoter Shareholding Pattern: Stable institutional ownership base
      • Provides governance stability and long-term strategic focus

    🏗️ Strategic Capital Allocation & Future Growth Roadmap:

    • Planned Capital Expenditure Budget: ₹10bn+ annual technology spend
      • Focused on API infrastructure, AI/ML credit scoring models, and cybersecurity enhancements
    • Strategic Investment Focus Areas: Digital banking capabilities and branch network expansion
      • 1,052 branches added in the past 12 months with rural & semi-urban focus to deepen penetration
    • Service Capacity Expansion Plans: Target ~200 new branches p.a. with “hub-and-spoke” model
      • Designed to enhance customer reach while maintaining cost efficiency

    📊 Multi-Decade Growth Trajectory Projections:

    • 5-Year Horizon (FY25-FY30): Base Case 12% CAGR → EPS ~₹156 by FY2030, driven by market share gains in retail lending and cross-selling opportunities
    • 10-Year Horizon (FY25-FY35): Base Case 12% CAGR → EPS ~₹277 by FY2035, supported by digital banking innovation and ecosystem partnerships

    💸 Current Valuation Analysis & Fair Value Assessment:

    • Current Price-to-Earnings Ratio: 20.6x compared to 5-Year Historical Average of ~18x
      • Trading at a premium to historical levels, reflecting market confidence in growth trajectory
    • Price-to-Book Multiple: 2.82x compared to Sector Average of ~2.5x
      • Premium valuation justified by superior RoE of 14.5% and robust capital position
    • Estimated Fair Value Range: ₹1,850-₹2,050 based on DCF and relative valuation methodology
      • Current price of ₹1,907 is within fair value range, suggesting appropriate pricing

    Management Commentary & Conference Call Highlights

    “Our focus on balanced growth across segments while maintaining disciplined risk management has enabled us to deliver consistent returns despite macroeconomic headwinds. The strategic investments in branch expansion and digital capabilities position us well to capitalize on India’s growing financial inclusion narrative while maintaining our industry-leading efficiency metrics.”

    Industry Context & Competitive Positioning

    Against a backdrop of increasing competition from smaller private banks and fintech disruptors, HDFC Bank continues to leverage its scale, capital strength, and expanding branch network to maintain market leadership. The bank’s 15.8% deposit growth significantly outpaces system growth of ~10-11%, demonstrating superior franchise value and customer trust.


    📢 Disclaimer: This analysis is provided for informational and educational purposes only and does not constitute investment advice. The author may hold positions in securities discussed. Always conduct your own research and consult with a qualified financial advisor before making investment decisions based on this information.

  • ICICI Bank Ltd – Latest Q4 FY2025 Results Earnings Analysis

    Analyst: Top‑Tier Equity Research (April 2025)

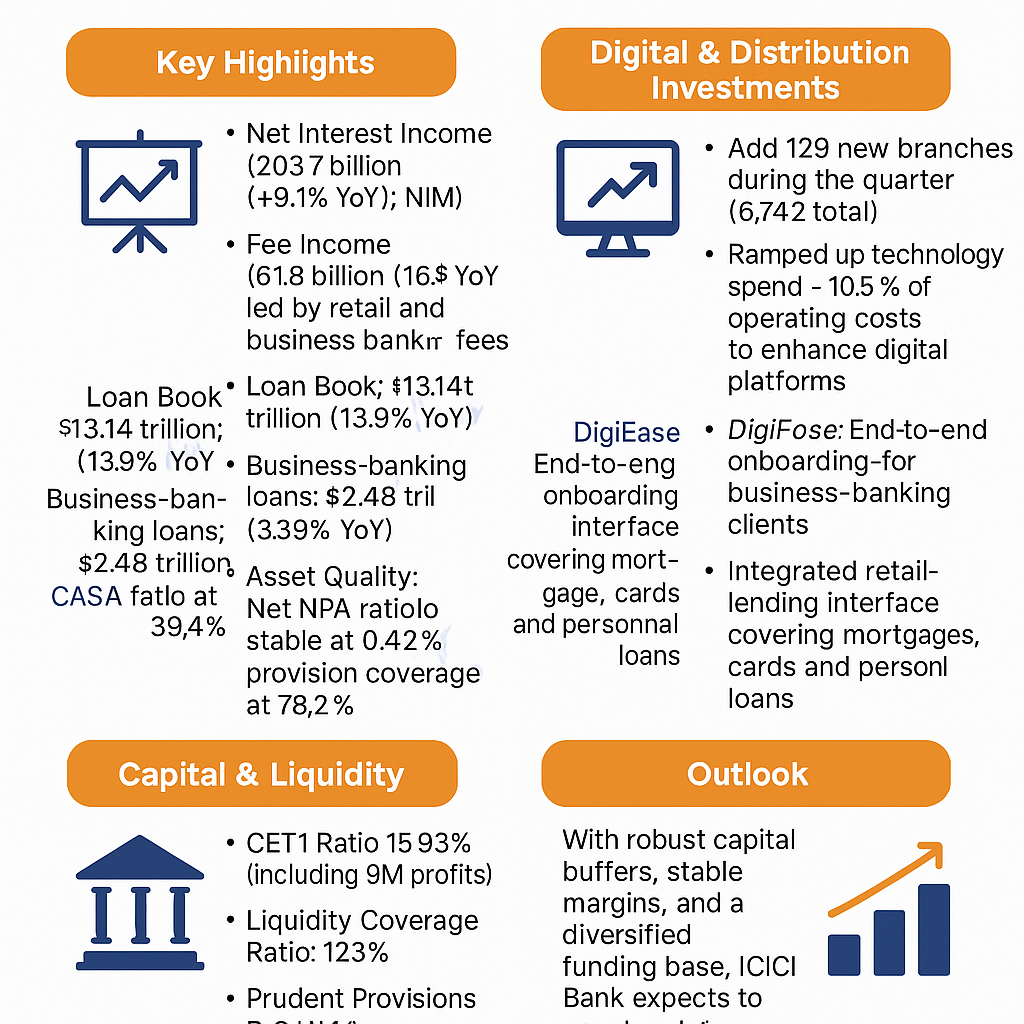
    ICICI Bank Ltd reported its Latest Q4 FY2025 Results, with key performance drivers including strong business banking loan growth (+31.9% YoY) and robust fee income growth (+16.3% YoY) ​​​. The investor presentation highlighted healthy capital buffers (CET1 15.93%) and a lean cost structure (standalone cost‑to‑income ~38.5%) ​​​. The confcall transcript provided insights into stable credit costs (37 bps of advances) and the roll‑out of digital platforms (DigiEase for business banking, iLens for retail lending) ​.

    Future Growth Plans

    • Technology & Digitalisation: Continued investments in digital channels, data analytics and back‑end automation to simplify processes.
    • 360° Customer Engagement: Deepening relationships across ecosystems and micro‑markets through holistic solutions.

    Planned Expansions

    • Branch Network: Added 129 branches in Q3 (219 in 9M) to extend physical reach ​.
    • Rural Outreach: Leveraging partnerships and micro‑finance schemes to grow the rural portfolio.

    Future Financial Projections
    Management targets mid‑teens CAGR in both revenues and profits over the next few years, driven by sustained loan growth (~14–16% p.a.) and diversified non‑interest income. Long‑term returns (5‑20 years) will hinge on execution of digital initiatives, macro‑economic stability, and regulatory developments.

    Latest Results Highlights

    • Profit After Tax: ₹117.92 bn; +14.8% YoY ​.
    • Net Interest Income: ₹203.71 bn; +9.1% YoY; NIM 4.25% ​.
    • Asset Quality: Net NPA ratio 0.42%; Provision coverage 78.2% ​.

    Key Metrics

    • Loan Book: +13.9% YoY; Retail ₹7.03 tn (+10.5%); Business Banking ₹2.48 tn (+31.9%) ​.
    • Fee Income: ₹61.80 bn; +16.3% YoY ​.
    • ROE: 19.9%; ROCE: 8.43%; Dividend Yield: 0.71%.

    CAPEX & Growth Strategy

    • Tech Spend: Technology expenses ~10.5% of opex to build digital platforms and strengthen resilience ​.
    • Network Expansion: Balanced branch additions alongside digital self‑service investments.

    Management Updates

    • Governance & Risk: Emphasis on “Fair to Customer, Fair to Bank” and “Return of Capital.”
    • Liquidity: LCR at 123%; strong deposit franchise (CASA ~39%) ​.

    Long‑Term Projections

    • RoE Sustainability: Aim to sustain RoE near 18–20% through calibrated growth and cost efficiencies.
    • Fee Income Leverage: Higher wallet share via digital channels to boost non‑interest revenues.

    Valuation

    • P/E: 19.6× vs five‑year average ~17×—premium reflects superior franchise, capital strength, and consistent execution ​.

    Credit Agency Rating Changes

    • No changes in long‑term ratings; Moody’s Baa3 / S&P BBB‑; domestic ratings AAA / AAA+ reaffirmed.

    Conclusion
    ICICI Bank’s Q3 FY2025 performance underscores its resilient growth, strong asset quality, and prudent capital management, positioning it well for sustained value creation amid evolving macro conditions.

    Disclaimer: This report is for informational purposes only and does not constitute investment advice. Investors should conduct their own analysis before making any investment decisions.
  • Wipro Latest Q4 FY2025 Results Spur Confidence in Long‑Term Growth

    Wipro Q4 FY2025 Results Fuel Long‑Term Investment Thesis


    Overview – Latest Q4 FY2025 Results
    Wipro Ltd delivered a solid finish to FY2025, reporting a 1.4 % year‑on‑year rise in consolidated revenues for the quarter ended March 31, 2025, and a 25.6 % jump in profit after tax. Operating leverage and disciplined cost management drove margins higher, while free cash flow comfortably covered both capital expenditure and dividend payouts.


    Financial Highlights

    • Revenue: ₹ 225 billion (+1.0 % QoQ, +1.4 % YoY)
    • EBITDA Margin: 20.6 % (up 70 bps QoQ)
    • PAT: ₹ 35.9 billion (+6.7 % QoQ, +25.6 % YoY)
    • Diluted EPS: ₹ 3.39 (post‑bonus share count)
    • Operating Cash Flow: ₹ 195.6 billion

    Key Metrics at a Glance

    • Market Capitalisation: ₹ 2.49 trillion
    • Share Price Range (52‑week): ₹ 208 – ₹ 325
    • P/E: 18.9× (Standalone)
    • Book Value: ₹ 78.6
    • Dividend Yield: 2.56 %
    • ROCE / ROE: 19.7 % / 16.7 %
    • Net Debt / EBITDA: < 0.5×

    Segment Performance

    1. Americas 1: Revenue ₹ 73.7 billion (+2.4 % QoQ); EBIT margin ~22 %
    2. Americas 2: Revenue ₹ 68.6 billion (+0.7 % QoQ); margin ~22.6 %
    3. Europe: Revenue ₹ 58.6 billion (–1.3 % QoQ); margin ~13.9 %
    4. APMEA: Revenue ₹ 23.6 billion (+0.7 % QoQ); margin ~15.6 %

    Management & Governance

    • Chairman: Rishad A. Premji
    • CEO & MD: Srinivas Pallia (appointed July 2024)
    • Board Approval: Q4 results signed off April 16, 2025

    Dividend & Capital Allocation

    • No share buyback in FY25 (previous ₹ 1,451 Cr in FY24)
    • 2.56 % dividend yield
    • Bonus Issue: 1:1 completed Dec 2024
    • Capex of ₹ 14.7 billion invested in campuses and infrastructure

    Growth Strategy & Expansion Plans

    • AI‑First Services: Embedding generative AI across consulting and delivery
    • Cloud & Automation: Scaling FullStride Cloud platform
    • Consulting: Integrating Capco and Rizing capabilities in banking and capital markets
    • Global Reach: Deepening North America leadership; targeting faster growth in EMEA and APMEA
    • Talent Platforms: Upskilling 230K employees in AI and digital

    Industry & Company Outlook

    • IT Services Growth: ~5 % CAGR for FY26 (IDC)
    • Indian IT Export Forecast: ~5.1 % growth in FY25; crossing $300 bn in FY26
    • Wipro Guidance: Mid‑single‑digit top‑line growth; margins stable at ~20–21 %

    Valuation & Credit Profile

    MetricWiproIT Peers
    P/E18.9×~17×
    P/BV3.0×~2.5×
    Dividend Yield2.56 %1.5–2 %
    Fitch RatingA‑/Stable

    Fitch affirmed Wipro’s A‑ / Stable rating in March 2025, citing strong free cash flow and conservative leverage.


    Long‑Term Projections
    Assuming modest CAGRs and reinvested dividends, an equity stake in Wipro could deliver:

    • 5 % CAGR: ~28 % total return over 5 years
    • 7 % CAGR: ~40 % over 5 years
    • 10 % CAGR: ~61 % over 5 years

    Disclaimer
    This article is for informational purposes only and does not constitute investment advice. Readers should perform their own research or consult a financial professional before making investment decisions.

  • ICICI Prudential : stellar Latest Q4 FY2025 Results


    Executive Summary

    ICICI Prudential delivered robust performance in FY2025—with strong profitability, expanding new business volumes, and an operational model that capitalizes on digital transformation and diversified distribution channels.


    Latest Q4 FY2025 Results & Latest Financial Highlights

    • Profitability and Growth:
      • Profit After Tax (PAT): FY2025 PAT rose to approximately ₹11.89 billion, up 39.6% YoY, with Q4 performance significantly contributing to this growth.
      • New Business Metrics:
        • New business received premium increased by 24.9% YoY.
        • Annualised Premium Equivalent (APE) reached ₹10,407 crore—reflecting a 15.0% increase over FY2024.
        • Value of New Business (VNB) stood at ₹2,370 crore, with a margin of 22.8%.
      • Embedded Value (EV): Grew by 13.3% YoY to ₹479.51 billion, illustrating the company’s capacity for long-term profitability.
      • Persistency & Claims:
        • A robust 13th month persistency ratio of 89.1% indicates strong customer retention.
        • An industry-leading claim settlement ratio of 99.3% (with an average turnaround time of 1.2 days) further boosts customer trust.
    • Capital & Investment Metrics:
      • Assets Under Management (AUM): Increased 5.2% YoY to ₹3.09 trillion.
      • Solvency & Net Worth: A robust solvency ratio of 212.2% (well above the regulatory requirement) and a net worth of approximately ₹119.41 billion underpin the company’s financial stability.
      • Dividend Policy: The Board has declared a final dividend of ₹0.85 per equity share, affirming its commitment to shareholder returns.

    (Data sourced from internal presentations ​, ​)


    Key Market & Valuation Metrics

    To provide a full picture for investment analysis, here are the critical market and valuation metrics as of April 2025:

    • Market Capitalization: ₹81,949 Cr.
    • Current Market Price: ₹567, with daily trading ranges from a high of ₹797 to a low of ₹515.
    • Valuation Multiples:
      • Stock P/E / Price to Earnings: 69.1, indicating a premium valuation.
      • Book Value: ₹82.6 per share.
    • Dividend Yield: A modest 0.11%, reflecting the company’s focus on reinvestment and growth rather than high current income.
    • Profitability Ratios:
      • ROCE: 11.8%
      • ROE: 10.3% (Return on Equity consistent with industry norms)
    • Capital Structure and Financial Position:
      • Face Value: ₹10.0 per share.
      • Total Debt: ₹2,600 Cr. against reserves of ₹10,488 Cr.
    • Shareholding & Ownership:
      • No. of Equity Shares: 145 Crore.
      • Promoter Holding: 73.0%, with a slight decline (–0.40% change over 3 years) suggesting stable promoter support.
    • Growth Metrics:
      • Sales (Revenue): ₹70,778 Cr., though recent sales have been under pressure with a –21.6% growth rate, while three-year sales growth averages at 3.65%.
      • Profit Growth: A robust 39.4% increase in profit, with a three-year profit variation of about 16.0%.
    • Operational Margins:
      • Operating Profit Margin (OPM): 1.43%, suggesting tight margins in a highly competitive sector.

    These metrics add a market-focused dimension to the financial fundamentals and indicate that while the company is trading at a higher P/E, its earnings and balance sheet strength support a long-term growth story.


    Future Growth Plans & Expansion Initiatives

    ICICI Prudential is advancing its agenda through several strategic initiatives:

    • Product Innovation & Diversification:
      • Enhancing the product mix, especially in the protection and annuity segments, to capture evolving consumer needs.
      • Launching new products (e.g., “ICICI Pru Gift Select”) to address wealth preservation and income guarantee trends.
    • Digital Transformation:
      • Leveraging advanced digital platforms like “ICICI Pru Stack” to streamline customer onboarding, underwriting, and claims settlement—driving both efficiency and customer satisfaction.
    • Distribution Network Expansion:
      • Expanding multi-channel distribution that includes proprietary channels (agency and direct), bancassurance, group, and partnership channels.
      • Aggressive advisor recruitment (over 60,000 advisors in FY2025) and deepening market penetration in micro-markets.
    • Cost Efficiency and CAPEX:
      • Continued focus on cost reduction with improved cost-to-premium metrics.
      • Strategic capital expenditure aimed at technology upgrades and distribution expansion to support a sustainable growth profile.

    Future Financial Projections & Long-Term Returns

    Given current performance and strategic initiatives, the following outlook can be considered:

    • Near-Term (Next 5 Years):
      • Expect compounded growth in embedded value and APE at approximately 10–12% annually, driven by consistent new business growth and margin expansion through digital and operational improvements.
    • Medium- to Long-Term (10, 15, 20 Years):
      • Assuming sustained product innovation, stable market dynamics, and continued operational excellence, compounded growth in shareholder value could range between 12–15% per annum.
      • This projection is supported by historical five-year CAGRs for EV and AUM, along with strong risk management and capital adequacy metrics.

    Valuation, Credit Standing & Investment Considerations

    • Valuation Outlook:
      • Despite trading at a premium (P/E of 69.1), the company’s strong balance sheet, solid profit growth, and consistent embedded value creation justify the valuation.
    • Credit Metrics and Risk Profile:
      • The healthy solvency ratio of 212.2% and zero non-performing assets reflect a highly creditworthy and risk-mitigated business.
    • ESG & Market Positioning:
      • With an “AA” ESG rating from MSCI and robust technological and distribution capabilities, ICICI Prudential is positioned as a leader in sustainable growth among Indian insurers.

    Conclusion & Disclaimer

    ICICI Prudential Life Insurance Company Limited delivered strong Q4 and full-year FY2025 performance, characterized by robust profitability, steady new business growth, and significant operational improvements. With its strategic focus on product innovation, digital transformation, and an expanding distribution network, the company is well positioned to deliver long-term value. The integration of key market metrics—such as a market cap of ₹81,949 Cr., a premium valuation (P/E 69.1), stable promoter holding (73.0%), and solid financial fundamentals—provides investors with a comprehensive view for a long-term investment decision.

    Disclaimer: This report is for informational purposes only and does not constitute investment advice. Investors should conduct their own research and consider their individual circumstances before making any investment decisions.