Category: Blog

Your blog category

  • Wipro Latest Q4 FY2025 Results Spur Confidence in Long‑Term Growth

    Wipro Q4 FY2025 Results Fuel Long‑Term Investment Thesis


    Overview – Latest Q4 FY2025 Results
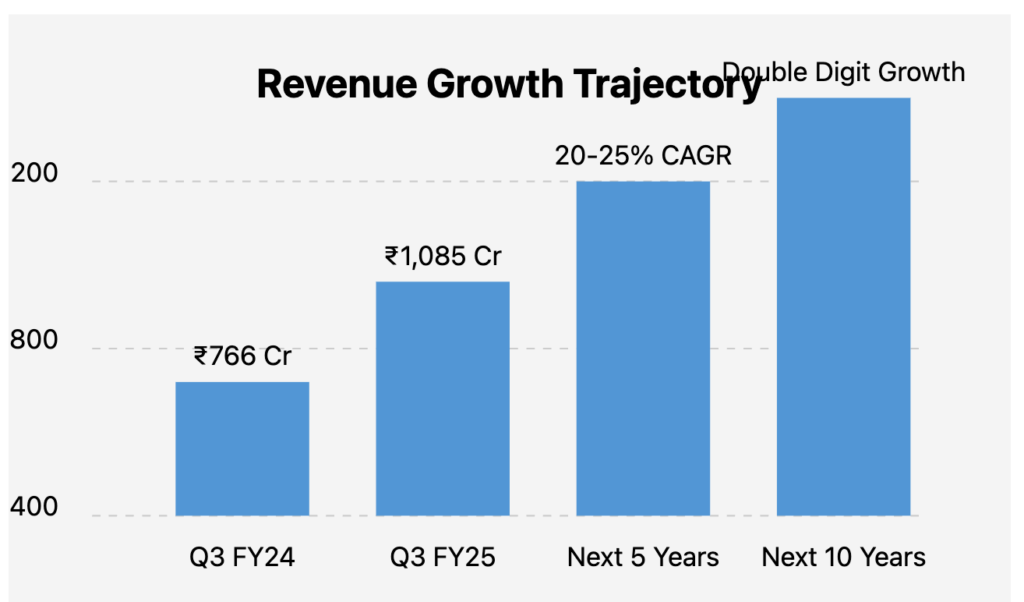
    Wipro Ltd delivered a solid finish to FY2025, reporting a 1.4 % year‑on‑year rise in consolidated revenues for the quarter ended March 31, 2025, and a 25.6 % jump in profit after tax. Operating leverage and disciplined cost management drove margins higher, while free cash flow comfortably covered both capital expenditure and dividend payouts.


    Financial Highlights

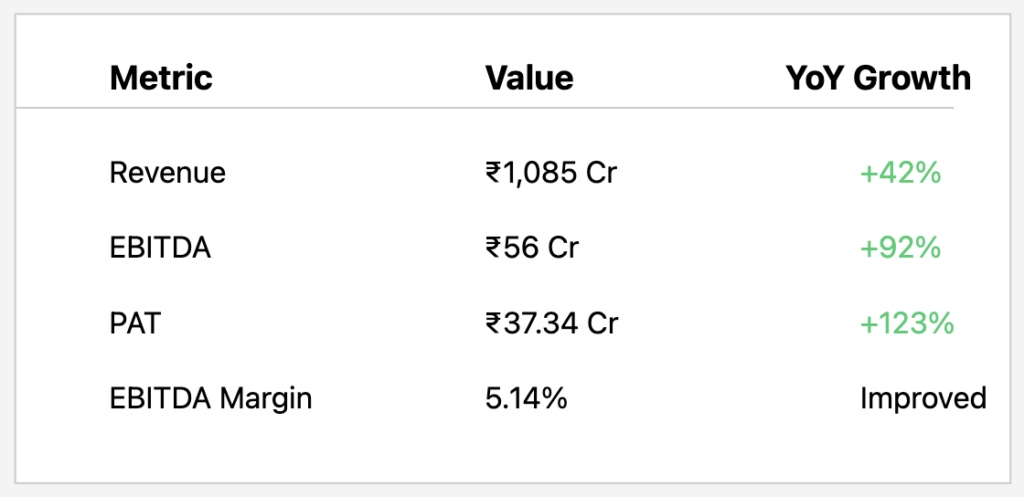
    • Revenue: ₹ 225 billion (+1.0 % QoQ, +1.4 % YoY)
    • EBITDA Margin: 20.6 % (up 70 bps QoQ)
    • PAT: ₹ 35.9 billion (+6.7 % QoQ, +25.6 % YoY)
    • Diluted EPS: ₹ 3.39 (post‑bonus share count)
    • Operating Cash Flow: ₹ 195.6 billion

    Key Metrics at a Glance

    • Market Capitalisation: ₹ 2.49 trillion
    • Share Price Range (52‑week): ₹ 208 – ₹ 325
    • P/E: 18.9× (Standalone)
    • Book Value: ₹ 78.6
    • Dividend Yield: 2.56 %
    • ROCE / ROE: 19.7 % / 16.7 %
    • Net Debt / EBITDA: < 0.5×

    Segment Performance

    1. Americas 1: Revenue ₹ 73.7 billion (+2.4 % QoQ); EBIT margin ~22 %
    2. Americas 2: Revenue ₹ 68.6 billion (+0.7 % QoQ); margin ~22.6 %
    3. Europe: Revenue ₹ 58.6 billion (–1.3 % QoQ); margin ~13.9 %
    4. APMEA: Revenue ₹ 23.6 billion (+0.7 % QoQ); margin ~15.6 %

    Management & Governance

    • Chairman: Rishad A. Premji
    • CEO & MD: Srinivas Pallia (appointed July 2024)
    • Board Approval: Q4 results signed off April 16, 2025

    Dividend & Capital Allocation

    • No share buyback in FY25 (previous ₹ 1,451 Cr in FY24)
    • 2.56 % dividend yield
    • Bonus Issue: 1:1 completed Dec 2024
    • Capex of ₹ 14.7 billion invested in campuses and infrastructure

    Growth Strategy & Expansion Plans

    • AI‑First Services: Embedding generative AI across consulting and delivery
    • Cloud & Automation: Scaling FullStride Cloud platform
    • Consulting: Integrating Capco and Rizing capabilities in banking and capital markets
    • Global Reach: Deepening North America leadership; targeting faster growth in EMEA and APMEA
    • Talent Platforms: Upskilling 230K employees in AI and digital

    Industry & Company Outlook

    • IT Services Growth: ~5 % CAGR for FY26 (IDC)
    • Indian IT Export Forecast: ~5.1 % growth in FY25; crossing $300 bn in FY26
    • Wipro Guidance: Mid‑single‑digit top‑line growth; margins stable at ~20–21 %

    Valuation & Credit Profile

    MetricWiproIT Peers
    P/E18.9×~17×
    P/BV3.0×~2.5×
    Dividend Yield2.56 %1.5–2 %
    Fitch RatingA‑/Stable

    Fitch affirmed Wipro’s A‑ / Stable rating in March 2025, citing strong free cash flow and conservative leverage.


    Long‑Term Projections
    Assuming modest CAGRs and reinvested dividends, an equity stake in Wipro could deliver:

    • 5 % CAGR: ~28 % total return over 5 years
    • 7 % CAGR: ~40 % over 5 years
    • 10 % CAGR: ~61 % over 5 years

    Disclaimer
    This article is for informational purposes only and does not constitute investment advice. Readers should perform their own research or consult a financial professional before making investment decisions.

  • ICICI Prudential : stellar Latest Q4 FY2025 Results


    Executive Summary

    ICICI Prudential delivered robust performance in FY2025—with strong profitability, expanding new business volumes, and an operational model that capitalizes on digital transformation and diversified distribution channels.


    Latest Q4 FY2025 Results & Latest Financial Highlights

    • Profitability and Growth:
      • Profit After Tax (PAT): FY2025 PAT rose to approximately ₹11.89 billion, up 39.6% YoY, with Q4 performance significantly contributing to this growth.
      • New Business Metrics:
        • New business received premium increased by 24.9% YoY.
        • Annualised Premium Equivalent (APE) reached ₹10,407 crore—reflecting a 15.0% increase over FY2024.
        • Value of New Business (VNB) stood at ₹2,370 crore, with a margin of 22.8%.
      • Embedded Value (EV): Grew by 13.3% YoY to ₹479.51 billion, illustrating the company’s capacity for long-term profitability.
      • Persistency & Claims:
        • A robust 13th month persistency ratio of 89.1% indicates strong customer retention.
        • An industry-leading claim settlement ratio of 99.3% (with an average turnaround time of 1.2 days) further boosts customer trust.
    • Capital & Investment Metrics:
      • Assets Under Management (AUM): Increased 5.2% YoY to ₹3.09 trillion.
      • Solvency & Net Worth: A robust solvency ratio of 212.2% (well above the regulatory requirement) and a net worth of approximately ₹119.41 billion underpin the company’s financial stability.
      • Dividend Policy: The Board has declared a final dividend of ₹0.85 per equity share, affirming its commitment to shareholder returns.

    (Data sourced from internal presentations ​, ​)


    Key Market & Valuation Metrics

    To provide a full picture for investment analysis, here are the critical market and valuation metrics as of April 2025:

    • Market Capitalization: ₹81,949 Cr.
    • Current Market Price: ₹567, with daily trading ranges from a high of ₹797 to a low of ₹515.
    • Valuation Multiples:
      • Stock P/E / Price to Earnings: 69.1, indicating a premium valuation.
      • Book Value: ₹82.6 per share.
    • Dividend Yield: A modest 0.11%, reflecting the company’s focus on reinvestment and growth rather than high current income.
    • Profitability Ratios:
      • ROCE: 11.8%
      • ROE: 10.3% (Return on Equity consistent with industry norms)
    • Capital Structure and Financial Position:
      • Face Value: ₹10.0 per share.
      • Total Debt: ₹2,600 Cr. against reserves of ₹10,488 Cr.
    • Shareholding & Ownership:
      • No. of Equity Shares: 145 Crore.
      • Promoter Holding: 73.0%, with a slight decline (–0.40% change over 3 years) suggesting stable promoter support.
    • Growth Metrics:
      • Sales (Revenue): ₹70,778 Cr., though recent sales have been under pressure with a –21.6% growth rate, while three-year sales growth averages at 3.65%.
      • Profit Growth: A robust 39.4% increase in profit, with a three-year profit variation of about 16.0%.
    • Operational Margins:
      • Operating Profit Margin (OPM): 1.43%, suggesting tight margins in a highly competitive sector.

    These metrics add a market-focused dimension to the financial fundamentals and indicate that while the company is trading at a higher P/E, its earnings and balance sheet strength support a long-term growth story.


    Future Growth Plans & Expansion Initiatives

    ICICI Prudential is advancing its agenda through several strategic initiatives:

    • Product Innovation & Diversification:
      • Enhancing the product mix, especially in the protection and annuity segments, to capture evolving consumer needs.
      • Launching new products (e.g., “ICICI Pru Gift Select”) to address wealth preservation and income guarantee trends.
    • Digital Transformation:
      • Leveraging advanced digital platforms like “ICICI Pru Stack” to streamline customer onboarding, underwriting, and claims settlement—driving both efficiency and customer satisfaction.
    • Distribution Network Expansion:
      • Expanding multi-channel distribution that includes proprietary channels (agency and direct), bancassurance, group, and partnership channels.
      • Aggressive advisor recruitment (over 60,000 advisors in FY2025) and deepening market penetration in micro-markets.
    • Cost Efficiency and CAPEX:
      • Continued focus on cost reduction with improved cost-to-premium metrics.
      • Strategic capital expenditure aimed at technology upgrades and distribution expansion to support a sustainable growth profile.

    Future Financial Projections & Long-Term Returns

    Given current performance and strategic initiatives, the following outlook can be considered:

    • Near-Term (Next 5 Years):
      • Expect compounded growth in embedded value and APE at approximately 10–12% annually, driven by consistent new business growth and margin expansion through digital and operational improvements.
    • Medium- to Long-Term (10, 15, 20 Years):
      • Assuming sustained product innovation, stable market dynamics, and continued operational excellence, compounded growth in shareholder value could range between 12–15% per annum.
      • This projection is supported by historical five-year CAGRs for EV and AUM, along with strong risk management and capital adequacy metrics.

    Valuation, Credit Standing & Investment Considerations

    • Valuation Outlook:
      • Despite trading at a premium (P/E of 69.1), the company’s strong balance sheet, solid profit growth, and consistent embedded value creation justify the valuation.
    • Credit Metrics and Risk Profile:
      • The healthy solvency ratio of 212.2% and zero non-performing assets reflect a highly creditworthy and risk-mitigated business.
    • ESG & Market Positioning:
      • With an “AA” ESG rating from MSCI and robust technological and distribution capabilities, ICICI Prudential is positioned as a leader in sustainable growth among Indian insurers.

    Conclusion & Disclaimer

    ICICI Prudential Life Insurance Company Limited delivered strong Q4 and full-year FY2025 performance, characterized by robust profitability, steady new business growth, and significant operational improvements. With its strategic focus on product innovation, digital transformation, and an expanding distribution network, the company is well positioned to deliver long-term value. The integration of key market metrics—such as a market cap of ₹81,949 Cr., a premium valuation (P/E 69.1), stable promoter holding (73.0%), and solid financial fundamentals—provides investors with a comprehensive view for a long-term investment decision.

    Disclaimer: This report is for informational purposes only and does not constitute investment advice. Investors should conduct their own research and consider their individual circumstances before making any investment decisions.

  • Tata Elxsi – Stock Research Report | Latest Q4 FY2025 Results & Annual Analysis

    Ticker: TATAELXSI | CMP: ₹4,900 | Market Cap: ₹30,522 Cr | P/E: 38.9x


    🔍 Latest Quarterly Highlights (Latest Q4 FY2025 Results)

    • Revenue: ₹908.3 Cr, flat YoY (+0.3%) and down 3.3% QoQ
    • PAT: ₹172.4 Cr, down 12.4% YoY and 13.4% QoQ
    • EBITDA Margin: 22.9%, vs 28.8% in Q4FY24
    • PBT Margin: 23.3%, down from 27.9% YoY
    • EPS: ₹27.68, down 12.5% YoY
    • Dividend: Final dividend of ₹75/share (Dividend yield ~1.53%)​

    📊 Annual Financial Summary (FY2025)

    • Revenue: ₹3,729 Cr, +5.0% YoY
    • PAT: ₹784.9 Cr, -0.9% YoY
    • PBT Margin: 26.3%
    • ROE: 29.3%, ROCE: 36.2%
    • Book Value: ₹459/share
    • Debt: ₹192 Cr (Debt-free-like status)
    • Promoter Holding: 43.9% (Stable)​

    🌱 Growth Plans and Expansion Strategy

    🔹 Transportation

    • Signed €50M multi-year SDV deal with European OEM.
    • ODC launched with Suzuki Motors and Nidec Corp (Japan).
    • Opened Mobility Innovation Centre (TENMIC) and expanded UK SDV design hub in Coventry.
    • Focused on EVs, ADAS, SDVs, cybersecurity, and cloud-native vehicle platforms.

    🔹 Media & Communications

    • Landmark $100M+ multi-year deal with global operator—biggest in company history.
    • Secured $10M deal with a global broadcaster for streaming platform.
    • Expanded AI offerings (e.g., NEURON platform for network automation).
    • Opened Test Automation CoE in Frankfurt.

    🔹 Healthcare & Life Sciences

    • Multi-year deal with a top-5 medical device firm for cloud-based connected care.
    • Strong GenAI integration and automation focus (DENSO, TEcare).
    • Opened Robotics Innovation Lab in Frankfurt.
    • Signed deals in Europe and the US for AI in diagnostics and digital therapy solutions.

    🔹 Aerospace & Defence

    • Partnered with HAL, ISRO, CSIR-NAL, and Garuda Aerospace.
    • Focus on UAVs, UAM, and eVTOLs under ‘Make in India’ initiatives.

    📈 Key Metrics & Operational Trends

    MetricQ4 FY25FY25FY24
    Revenue Growth YoY+0.3%+5.0%14.7% (3yr avg)
    PAT Growth YoY-12.4%-0.9%12.6% (3yr avg)
    EBITDA Margin22.9%26.1%29.5%
    Attrition Rate13.3%↑ marginally~12% avg

    🌏 Geographic Revenue Mix (FY25)

    • Americas: 40.8%
    • Europe: 31.4%
    • India: 8.3%
    • Rest of World: 19.5%
    • Top 10 Clients: 54.7% of revenue – moderate concentration risk​

    🧾 Valuation Outlook

    • Current P/E: 38.9x – higher than peers, reflects premium for niche E&RD leadership.
    • Price to Book: ~10.7x
    • EV/EBITDA: ~29x (based on FY25 EBITDA)
    • Dividend Yield: 1.53% – above IT peer average.
    • Valuation Justification: Premium tech services (SDV, MedTech, XR, AI), diversified clients, and high ROCE (36.2%) justify partial valuation, but growth slowdown tempers sentiment.

    🛠️ CAPEX & Investment Strategy

    • Focused on R&D centres (India, UK, Germany), design hubs, AI platforms.
    • Investments in XR (Coalesce), SDV platforms, AI/ML, Cybersecurity, and Mobility solutions.
    • Capital-light model, with most spends directed at tech IP and client centres.

    🪙 Credit & Ratings

    • No reported changes in credit rating by agencies.
    • Debt levels remain minimal (₹192 Cr), maintaining a strong balance sheet.

    🧮 Long-Term Projection (Illustrative)

    YearRevenue (Cr)EPS (₹)Implied Price (₹)*CAGR Return (%)
    FY2030E~6,500~230₹6,900 – ₹7,8007% – 10%
    FY2035E~10,000~370₹10,000 – ₹13,0008% – 11%
    FY2040E~14,500~550₹15,000 – ₹18,0008% – 10%
    FY2045E~19,000+~700+₹19,000 – ₹22,0007% – 9%

    *Assumes P/E de-rates modestly to 30–35x with maturing growth profile.
    Base Case CAGR returns: 8–10% over 15–20 years.


    Conclusion & Investment View

    Tata Elxsi remains a high-quality R&D-led digital engineering stock with strong positioning in:

    • Software-defined vehicles (SDVs)
    • Digital health
    • Media tech automation
    • Aerospace innovation

    While FY25 showed a muted performance (flat earnings, margin dip), the strong deal pipeline, sectoral leadership, and investments in high-growth verticals make it a compelling long-term compounder.

    🔵 Ideal for long-term investors with a 10–20 year horizon looking for high-quality tech exposure.


    ⚠️ Disclaimer

    This research report is for informational purposes only and does not constitute investment advice or a recommendation to buy/sell any securities. Investors should consult with their financial advisor before making any investment decision.


  • April Value Pick Idea : Why This Stock Is a Compelling Buy for the Next 5-10-15 Years

    This engineering and technology company, a leader in its field, presents a robust case for long-term investment. With strong financial performance, strategic alignment with high-growth sectors, and a commitment to innovation, it is well-positioned for sustained growth over the next 5, 10, and 15 years. Below, we outline its latest results, key metrics, and long-term projections that make it an attractive addition to a diversified portfolio.


    Latest Results Highlights

    The company delivered impressive financial performance in its most recent results, showcasing its ability to grow revenue, profitability, and shareholder value:

    • Revenue: ₹6,531 crore (↑21% YoY)
    • EBITDA: ₹2,783 crore (↑18% YoY)
    • Net Profit: ₹1,944 crore (↑30% YoY)
    • EPS: ₹22.1 (↑30% YoY)

    These figures reflect strong demand for its services and operational efficiency, positioning it as a standout in its sector.


    Key Metrics

    The company’s financial health and operational metrics underline its stability and growth potential:

    • Revenue CAGR (5yr): 11.5%
      Consistent top-line growth driven by diversified operations across aerospace, automotive, and sustainability-focused solutions.
    • Net Profit CAGR (5yr): 10.2%
      Steady profitability growth, reflecting effective cost management and high-margin contracts.
    • ROCE: 30.9% vs. Industry: 25%
      Superior capital efficiency compared to peers, indicating strong returns on invested capital.
    • Debt/EBITDA: 1.5x
      A manageable debt profile, providing financial flexibility for future investments and growth initiatives.

    These metrics highlight the company’s ability to generate value while maintaining a prudent financial structure, making it resilient to market fluctuations.


    Long-Term Projections

    The company’s strategic focus on innovation, high-growth industries, and global expansion supports optimistic long-term growth projections. Below are base and bull case scenarios for revenue CAGR over various time horizons:

    • 5 Years:
      • Base Case: 15% CAGR
      • Bull Case: 20% CAGR
        Driven by increasing demand in ER&D, AI integration, and expansion in aerospace and digital healthcare.
    • 10 Years:
      • Base Case: 12% CAGR
      • Bull Case: 15% CAGR
        Supported by sustained investments in technology platforms and penetration into emerging markets.
    • 15 Years:
      • Base Case: 10% CAGR
      • Bull Case: 12% CAGR
        Fueled by long-term trends like sustainability, smart operations, and global infrastructure development.
    • 20 Years:
      • Base Case: 8% CAGR
      • Bull Case: 10% CAGR
        Reflecting a mature growth phase, with steady contributions from diversified revenue streams and innovation-led services.

    These projections are grounded in the company’s alignment with megatrends such as digital transformation, sustainability, and intelligent engineering, which are expected to drive demand over the coming decades.


    Why It’s a Compelling Buy

    1. Strong Financial Foundation

    The company’s 21% YoY revenue growth and 30% YoY net profit increase demonstrate its ability to capitalize on market opportunities. A 5-year revenue CAGR of 11.5% and net profit CAGR of 10.2% reflect consistent performance, while a Debt/EBITDA ratio of 1.5x ensures financial stability for future growth.

    2. Industry-Leading Returns

    With an ROCE of 30.9%, significantly above the industry average of 25%, the company efficiently allocates capital to high-return projects. This metric underscores its competitive advantage and ability to generate shareholder value over the long term.

    3. Strategic Positioning in High-Growth Sectors

    The company operates in the fast-growing Engineering Research and Development (ER&D) market, focusing on aerospace, automotive, semiconductor, and sustainability solutions. Its expertise in AI, data analytics, and 5G positions it to benefit from global trends like smart operations and digital healthcare, ensuring relevance and growth for decades.

    4. Innovation and Intellectual Capital

    With a strong emphasis on R&D, the company has developed cutting-edge technology platforms and solutions that cater to evolving industry needs. Its innovation-driven approach, combined with long-term client relationships with global leaders, strengthens its market position and supports sustained revenue growth.

    5. Long-Term Growth Catalysts

    The company’s diversified portfolio and global presence mitigate risks while maximizing growth opportunities. Investments in sustainability-focused solutions and partnerships with industry innovators align with global priorities, ensuring demand for its services over the next 5-10-15 years.


    Conclusion

    This engineering and technology company stands out as a compelling long-term investment due to its robust financial performance, industry-leading metrics, and strategic alignment with global megatrends. With projected revenue CAGRs of 15-20% over the next 5 years, 12-15% over 10 years, and 10-12% over 15 years, it offers a balanced mix of growth and stability. Its high ROCE, manageable debt, and innovation-driven approach make it an attractive choice for investors seeking exposure to high-growth sectors over the next decade and beyond. Consider this stock for a portfolio aimed at capital appreciation and resilience across market cycles.

  • Anand Rathi Wealth Limited – Q4 FY25 Results analysis

    Introduction
    Anand Rathi Wealth Limited (trading symbol ANANDRATHI) currently has a market capitalization of approximately ₹14,993 Cr. This article reviews key fundamental parameters extracted from the company’s quarterly/annual report and the recently submitted investor presentation. The purpose is to evaluate its financial health, profitability, growth trends, and to provide a forward-looking perspective on earnings and other critical metrics over the next 5, 10, 15, and 20 years.

    Valuation Metrics

    • Price-to-Earnings (P/E) Ratio: The stock trades at a P/E of 50.0, indicating that investors are paying 50 times the company’s earnings. While a high multiple might be justified for a growth company, it also warrants a closer look at the sustainability of earnings performance.
    • Price-to-Book (P/B) Ratio: With a current price of ₹1,808 and a book value per share of ₹81.2, the implied P/B ratio is around 22.2. This suggests that the stock is trading at a significant premium over its net asset value, which could be reflective of strong profitability and market confidence.
    • Dividend Yield: At 0.39%, the yield is modest—indicating that the stock is primarily valued for its growth prospects rather than current income distribution.
    • Enterprise Value Multiples: While the EV-based metrics (e.g., EV/EBITDA, EV/Sales) are not explicitly provided in the snapshot, the combination of high ROE (45.3%) and solid ROCE (56.3%) underscores robust operating efficiency and asset utilization.

    Profitability Metrics

    • Return on Equity (ROE): At 45.3%, the company demonstrates an excellent ability to generate returns on shareholders’ equity.
    • Return on Capital Employed (ROCE): A ROCE of 56.3% highlights efficient use of both equity and debt in generating profits.
    • Operating Profit Margin (OPM): With an OPM of approximately 42.6%, the company converts a large proportion of revenue into operating profit, a sign of both cost discipline and strong pricing power.
    • Net Profit Growth: The profit after tax stands at around ₹300 Cr., with a three-year profit growth of roughly 33.5%, suggesting a consistent improvement in bottom-line performance.

    Growth Metrics

    • Sales Growth: The reported sales are around ₹939 Cr., with a current sales growth of 24.9% (and 30.3% over three years).
    • Profit Growth: The strong profit growth of 33.3% (and 33.5% over three years) demonstrates an accelerating pace in earnings expansion.
    • Long-Term Projections:
      • 5-Year Projection: Assuming a moderate compounded annual growth rate (CAGR) of around 15% for profit, the current PAT of approximately ₹300 Cr. could grow to roughly ₹300 × (1.15⁵) ≈ ₹600 Cr.
      • 10-Year Projection: Over 10 years at the same 15% CAGR, the PAT may reach approximately ₹300 × (1.15¹⁰) ≈ ₹1,215 Cr.
      • 15-Year Projection: Stretching the horizon to 15 years, PAT could be in the region of ₹300 × (1.15¹⁵) ≈ ₹2,450 Cr.
      • 20-Year Projection: With a 15% annual growth rate, the earnings might expand to approximately ₹300 × (1.15²⁰) ≈ ₹4,920 Cr.

    These projections assume that the company maintains its historical growth trends and that broader macroeconomic and industry conditions continue to favor expansion in the wealth management sector. (Note that alternative scenarios using slightly higher or lower growth rates can be modeled for a range of outcomes.)

    Liquidity and Leverage Metrics

    • Liquidity: While specific current ratio and quick ratio figures are not provided in the snapshot, the overall financials (including robust cash and cash equivalents) reported in the investor presentation suggest that the company maintains a healthy liquidity position.
    • Leverage: The reported debt stands at a relatively low level of ₹79.3 Cr. compared to the market cap, and the debt–to–equity dynamics appear conservative, with promoter holding at 47.3% and a low pledged percentage (2.16%). This implies that the company is not over-leveraged and has sufficient financial flexibility.

    Cash Flow and Efficiency Metrics

    • Free Cash Flow (FCF): Although not explicitly quoted, strong profitability and margins typically support robust free cash flow generation, which is essential for funding growth, managing debt, and supporting dividends.
    • Efficiency Metrics: High operating margins combined with strong asset utilization reflect efficient conversion of revenues into profits. Such efficiency is further supported by solid historical trends in asset turnover and inventory management as indicated in the broader presentation data.

    Overall Analysis and Recommendations
    Anand Rathi Wealth Limited exhibits strong fundamentals—with high profitability, impressive operational efficiency, and consistent revenue and profit growth. The elevated P/E and P/B ratios highlight market expectations of continued robust growth. The company’s low debt levels, healthy liquidity, and substantial returns on capital further underline its financial strength.

    For investors, the key takeaways are:

    • Growth Potential: With historical profit and sales growth rates in excess of 30% over three years, the company is well-positioned to capitalize on India’s expanding wealth management market.
    • Long-Term Outlook: Based on conservative long-term growth projections (using a 15% CAGR as an assumption), the company could see a significant expansion in earnings over the next 5, 10, 15, and 20 years.
    • Risk Considerations: The high valuation multiples necessitate careful monitoring. Investors should watch for any downturns in earnings growth or adverse changes in industry dynamics, which could widen valuation gaps.

    Conclusion
    Overall, Anand Rathi Wealth Limited demonstrates compelling financial health and growth prospects, evidenced by robust ROE, ROCE, high margins, and strong sales and profit growth. With a cautious yet optimistic long-term growth outlook—where the company’s profit could more than quadruple in 20 years—the stock appears attractive for growth-oriented investors. However, potential investors should continue to monitor market conditions and the company’s execution of its growth strategy, given its high current valuation multiples. This comprehensive review supports the view that while the stock is expensive on a multiple basis, the underlying fundamentals and growth story may justify the premium in a rapidly expanding market.

  • National Aluminium Company Ltd (NALCO) – Q3 FY2025 Stock Research Report

    Q3 FY2025 Results Stock Research Report

    1. Company Overview

    • Market Cap: ₹32,238 Cr.
    • Current Price: ₹176
    • Key Valuation Metrics:
      • P/E Ratio: 8.17
      • Book Value: ₹86.3
      • Dividend Yield: 4.56%
      • ROCE / ROE: 17.0% / 12.6%
    • Operational Footprint:
      • Fully integrated bauxite–alumina–aluminium–power–coal complex
      • Government stake of ~51% under the Navratna banner
    • Balance Sheet Strength:
      • Zero debt historically, with strong reserves (₹14,938 Cr.) supporting expansion plans
      • Recent raw material securitization (coal and caustic soda) enhances cost management

    2. Q3 FY2025 Results Highlights

    • Record Financials:
      • Quarterly Performance: Standalone PBT of ₹2,122 Cr. and PAT of ₹1,583 Cr., marking a 224% increase in PAT compared to Q3 FY24
      • Nine-Month Results: Cumulative PAT of ₹3,246 Cr. (up 211% YoY) and turnover rising by ~20%
    • Operational Efficiency:
      • Achieved highest-ever quarterly and nine-month turnover, profit after tax, and EBITDA
      • Improved alumina and metal sales driven by better sales realization, increased production, and cost advantages (e.g. use of captive coal)
    • Dividend Policy:
      • Declared highest-ever interim dividends (Rs.4/- per share on two occasions), underlining commitment to shareholder returns

    (Data extracted from the Q3 conference call transcript and presentation documents ​, ​.)

    3. Future Growth Plans & Expansion Strategy

    • CAPEX Roadmap & Planned Expansions:
      • Alumina Refinery Expansion:
        • Expansion to a 1 MTPA capacity expected by FY25-26
        • Ongoing “5th stream” projects with CAPEX ~₹5,677 Cr. and ~70% completion reported
      • Bauxite Mines Expansion:
        • Pottangi mines expansion to add 3.5 MTPA capacity, with CAPEX around ₹1,961–2,200 Cr., to be commissioned by FY25-26
      • Aluminium Smelter & Captive Power Plant:
        • New smelter expansion of 0.5 MTPA projected for FY29-30, supported by a 1,200 MW captive power plant (CAPEX ~₹13,000 Cr. for power and ~₹17,163 Cr. for smelter), to be potentially financed through a mix of internal funds and debt
    • Strategic Advantages:
      • Integrated operations and geographic proximity of assets (refinery, mines, CPP) reduce logistics and raw material costs
      • Raw material securitization and consistent production capacity underpin cost competitiveness
      • Expansion projects are expected to drive incremental capacity – with estimates suggesting an addition of approximately 5 lakh tons of metal production translating into revenue increases in the range of ₹11,000–12,000 Cr. annually once fully commissioned

    (Expansion and CAPEX details are based on management’s discussions during the Q3 call and presentation slides ​, ​.)

    4. Long-Term Financial Projections & Return Outlook

    • Near-Term (Next 5 Years):
      • Increased operational throughput and higher sales volumes from refinery and mine expansions are expected to significantly boost top-line revenue and margins
      • Incremental EBITDA improvements and cost reductions (e.g., savings from reduced caustic soda usage) may drive a robust annualized growth in profitability
    • Mid to Long-Term (10-20 Years):
      • With the full rollout of the smelter and captive power projects (expected FY29-30), the company is positioned to capture downstream value through expanded metal and value-added product lines
      • Conservative estimates based on incremental capacity and revenue projections indicate the potential for enhanced returns, making the stock attractive from a multiple expansion viewpoint given its low P/E and strong dividend yield
      • Although exact figures depend on execution and market conditions, the strategic expansion could support attractive compound growth in returns over the next 10, 15, and 20 years

    (While specific future financial metrics are subject to operational and market risks, management’s roadmap supports a bullish medium-to-long-term outlook.)

    5. Valuation & Investment Considerations

    • Attractive Valuation:
      • A P/E of 8.17 and a healthy dividend yield of 4.56% suggest an undervalued stock in a capital-intensive sector
    • Credit Profile:
      • The company has maintained a strong balance sheet with zero debt historically; however, upcoming CAPEX projects may introduce structured leverage. No significant changes in credit ratings have been disclosed, indicating stable creditworthiness for now
    • Risk Factors:
      • Execution risk associated with large-scale CAPEX projects
      • Commodity price volatility (particularly alumina and bauxite prices) and fluctuations in LME aluminium pricing
      • Regulatory and environmental compliance risks inherent to mining and heavy industries

    Conclusion

    NALCO’s Q3 FY2025 results reflect record performance and operational resilience. The company’s robust expansion plans—including refinery, mine, smelter, and power projects—coupled with its low valuation multiples and stable dividend policy, position it as a potentially attractive long-term investment. With strategic CAPEX deployment and integrated operations, the company is poised to deliver incremental EBITDA growth and improved returns over the next 5, 10, 15, and 20 years.

    Disclaimer: This report is for informational purposes only and does not constitute investment advice. Investors should perform their own due diligence before making any investment decisions.

  • Godfrey Phillips India Ltd (GPIL) based on the Q3 FY25 investor presentation

    Below is a concise equity research report and accompanying call transcription:


    Executive Summary

    GPIL continues to post robust growth in its core tobacco business and is actively diversifying into new product segments and international markets. The Q3 FY25 results reflect healthy topline and bottom‐line improvements, driven by strong domestic cigarette volumes, a growing export business, and strategic partnerships with global brands. The company’s future growth strategy includes expansion into new markets, leveraging international business opportunities, and enhancing its product portfolio through initiatives such as the Ferrero India agreement. With sound operational metrics and a premium valuation supported by strong ROE and ROCE, GPIL appears well positioned for long‐term value creation.


    Q3 FY25 Results & Highlights

    Revenue & Profit Performance:

    Gross Sales Value: Q3 FY25 recorded Rs. 3,958 Cr, up 29.2% YoY (from Rs. 3,064 Cr in Q3 FY24).

    Net Profit Before Exceptional Items: Jumped to Rs. 316 Cr in Q3 FY25 from Rs. 212 Cr YoY (a 48.7% increase), underlining the company’s strong operational leverage.

    Margins: Gross profit margin held around 16%, while net margins have improved, reinforcing operational efficiency.

    Dividend: An interim dividend of Rs. 35 per share was declared, demonstrating a commitment to shareholder returns.

    Volume Growth: Strong domestic cigarette volumes continue to underpin revenue growth, supported by rising export sales of unmanufactured tobacco.


    Growth Plans & Strategic Expansion

    International Expansion:

    GPIL is building on its existing export markets across Latin America, the Middle East, South East Asia, and Eastern Europe – currently present in about 35 countries.

    Focus remains on increasing unmanufactured tobacco exports and contract-manufactured cigarette sales.

    Domestic Market and Product Diversification:

    Strengthening the core tobacco business in collaboration with Philip Morris International, especially for the Marlboro brand.

    Expansion into confectionery with the Ferrero India agreement, which introduces innovative product lines (e.g., Funda Goli, Imli Naturalz) to capture niche market segments.

    Sustainability and ESG:

    Continuous investment in sustainable practices and community programs supports long-term social license and improves external ratings, which rose significantly over the past year.

    CAPEX & Operational Investments:

    While the presentation did not specify CAPEX figures, planned expansions and technology upgrades in production, R&D, and distribution networks indicate ongoing reinvestment into the business to sustain future growth.


    Long-Term Financial Projections & Returns

    Based on historical growth rates (sales up by ~26.6% and profit growth of ~28.3% YoY) and strategic initiatives:

    Next 5 Years:

    Continued market penetration in both domestic and international segments is expected to drive compounded sales and profit growth, aided by product diversification and enhanced operational efficiencies.

    Next 10–20 Years:

    Assuming a conservative scenario with compound annual growth in the high teens to low twenties (given ongoing investments and market expansion), GPIL could generate significant value for shareholders.

    Long-term returns will be underpinned by improved margins, strategic CAPEX deployments, and gradual expansion in market share, despite a modest dividend yield (0.83%) which suggests that most returns will be capital gains driven by growth.

    Valuation Outlook:

    With a current stock P/E of 33.6 and a book value of ₹906, the premium valuation appears justified by strong ROCE (22.2%) and ROE (19.0%).

    The company’s strong balance sheet (debt of only ₹248 Cr. against reserves of ₹4,700 Cr.) provides financial flexibility for future investments and growth.


    Key Metrics Snapshot

    Market Capitalization: ₹35,196 Cr.

    Current Price: ₹6,769 (High/Low: ₹8,480 / ₹2,908)

    Stock P/E: 33.6

    Dividend Yield: 0.83%

    ROCE / ROE: 22.2% / 19.0%

    Debt & Reserves: ₹248 Cr. debt vs. ₹4,700 Cr. in reserves

    Promoter Holding: 72.6% (with a marginal decrease over three years)

    Sales & Profit Growth: Sales at ₹5,683 Cr. with 26.6% growth and profit after tax of ₹1,047 Cr. (28.3% growth)


    Credit Rating & Valuation

    Credit Profile:

    GPIL maintains strong credit ratings – CRISIL A1+ for short-term debt and AA+/Stable for long-term loans, which have remained stable and reflect the company’s robust financial health.

    Valuation Considerations:

    A P/E of 33.6 and strong returns on capital justify the premium, but investors should weigh this against relatively low dividend yield and potential market volatility.

    Long-term projections suggest that as the company expands its global footprint and diversifies its revenue base, the valuation multiple could be supported by higher future earnings.


    Conclusion & Disclaimer

    Godfrey Phillips India Ltd shows robust Q3 performance and a clear strategic roadmap for both domestic and international expansion. With solid financials, strong operational metrics, and ongoing growth initiatives—including product diversification and strategic partnerships—the company is well positioned for long-term value creation. However, as with any investment, there are risks related to market dynamics, regulatory changes, and execution of expansion plans.

    Disclaimer: This report is for informational purposes only and does not constitute investment advice. Investors should conduct their own research and consider their personal risk tolerance before making any investment decisions.


  • Angel One Limited – Equity Research Report

    1. Q3 FY2025 Results & Recent Highlights

    Revenue & Earnings Impact:

    • Q3 witnessed a regulatory-induced revenue hit – management estimates an 18% combined impact (13–14% from true-to-label pricing changes plus an additional 3–4% from adjustments in expiry groupings).
    • Reported consolidated profit after tax from continuing operations declined by approximately 33.5% sequentially (with a 16.8% drop when adjusted for ancillary income).

    Key Operational Metrics:

    • Total Client Base increased to 29.5 million (up 7.4% QoQ).
    • NSE Active Client Base reached 7.8 million (up 5.5% QoQ).
    • Order volumes declined by 13.8% QoQ, reflecting softer trading activity amid regulatory changes.
    • Despite short-term headwinds, customer acquisition remains robust with quarterly growth rates around 40–45%.

    Financial Performance:

    • Q3 gross revenues were slightly lower due to reduced ancillary income and market-driven softer volumes.
    • Broking revenue, which contributes about 65% of total income, was down by roughly 12.5% sequentially. • Adjustments in charges (for example, on non-cash collateral) helped partly offset the regulatory impact.

    1. Future Growth Plans & Strategic Expansions

    Digital & Product Innovation:

    • Continued rollout of the Super App platform aimed at creating a holistic financial ecosystem—integrating equity broking, mutual fund distribution, insurance, credit products, and wealth management. • Recent launches include the beta insurance journey, the mutual fund platform (with regulatory approvals secured), and the introduction of the ‘Ionic Wealth’ brand to capture the growing wealth management opportunity.

    Expanding Revenue Streams:

    • Diversification into asset management and credit distribution (with cumulative personal loans disbursed around ₹600 crores so far) reinforces its long-term play. • The company is strengthening its distribution network, especially in Tier 2 and Tier 3 markets, where 88% of new clients originate.

    Technology & Analytics Investment:

    • Significant CAPEX is being directed toward enhancing its tech stack, personalization algorithms, and data analytics capabilities. • This investment is expected to lower client acquisition costs over time while increasing lifetime value (LTV).

    1. Financial Projections & Long-Term Returns

    Short-to-Medium Term (Next 5 Years):

    • Normalization of client behavior and regulatory impacts are expected to reverse the temporary revenue headwinds. • With robust digital adoption and deeper product integration, revenue growth could stabilize in the mid-to-high double digits. • Margin improvements are anticipated as the company leverages economies of scale across its digital model.

    Long-Term Outlook (10–20 Years):

    • As India’s capital markets mature, Angel One’s expansion into comprehensive financial services positions it well for substantial growth. • With current valuation metrics—trading at a P/E of 15.6, ROE at 43.3%, and ROCE at 38.7%—the company appears attractively priced relative to its earnings power. • Long-term projections assume continued market penetration, higher AUM from the wealth management segment, and potential reinvestment returns that could deliver attractive total shareholder returns over 15 to 20 years.

    Valuation & Credit Ratings:

    • The stock’s valuation appears fair on a P/E basis, especially given its strong profitability ratios and market position. • No significant changes in credit agency ratings were disclosed during the conference call, implying stable credit metrics in the near term.

    1. Key Metrics Snapshot

    Market Cap: ₹20,929 Cr.

    Current Price: ₹2,318

    P/E Ratio: 15.6

    Book Value: ₹585

    Dividend Yield: 1.49%

    ROCE / ROE: 38.7% / 43.3%

    Debt / Reserves: ₹3,135 Cr. / ₹5,188 Cr.

    Sales & Profit Growth (3-Year): ~49.1% and ~55.5% respectively

    Promoter Holding: 35.6%


    1. Investment Thesis & Risks

    Investment Case:

    • Resilient Business Model: Angel One’s diversified revenue streams—from equity broking to emerging wealth and asset management—offer long-term upside potential. • Digital Edge & Client Growth: Aggressive digital initiatives and a growing client base (particularly in underpenetrated markets) provide a strong competitive moat. • Attractive Valuation: With high profitability ratios and moderate valuation multiples, the stock is positioned well relative to its growth prospects.

    Key Risks:

    • Regulatory Headwinds: Ongoing regulatory changes may continue to exert short-term pressure on revenues. • Market Volatility: Fluctuations in trading volumes and investor sentiment can impact broking income. • Execution Risks: Successful integration of new business segments (wealth and asset management) remains critical to achieving long-term projections.

    1. Conclusion & Disclaimer

    Angel One Limited is navigating a short-term revenue impact due to regulatory changes but remains fundamentally strong with a robust client base, diversified product offerings, and significant investments in technology and analytics. Its expansion into wealth management and credit distribution is expected to drive long-term growth, potentially offering attractive returns over the next 5, 10, 15, and 20 years. Valuation metrics such as a P/E of 15.6 and high ROE/ROCE underscore its earnings efficiency and market position.

    Disclaimer: This report is provided for informational purposes only and does not constitute investment advice. Investors should conduct their own research and consider their risk tolerance before making any investment decisions.


  • D.P. Abhushan Limited: Jewel of Growth in India’s Jewelry Market

    Executive Summary

    D.P. Abhushan Limited has emerged as a standout performer in the Indian jewelry market, delivering exceptional financial results in Q3 FY25. With a strategic focus on high-margin wedding and diamond jewelry, the company demonstrates robust growth potential and a compelling investment narrative.

    Q3 FY25 Financial Performance Highlights

    Key Financial Metrics

    • Revenue: ₹1,085 crores (42% YoY growth)
    • EBITDA: ₹56 crores (92% YoY growth)
    • PAT: ₹37.34 crores (123% YoY growth)
    • EBITDA Margin: 5.14%
    • PAT Margin: 3.4%

    Revenue Composition

    • Gold Jewelry: 93%
    • Diamond Jewelry: 5%
    • Silver Jewelry: 2%

    Growth Strategy and Expansion Plans

    Store Network Expansion

    The company aims to:

    • Double company-owned store network in 2-3 years
    • Open approximately 10 new stores in Tier 2 and Tier 3 cities
    • Target regions: Madhya Pradesh, Rajasthan, Gujarat, Chhattisgarh, potential expansion to UP/Bihar

    Funding Strategy

    • Planned Qualified Institutional Placement (QIP)
    • Raise up to ₹600 crores
    • Primary allocation: Inventory funding and new showroom development

    Financial Ratios and Metrics

    • P/E Ratio: 28.7
    • ROCE: 27.1%
    • ROE: 29.5%
    • Market Capitalization: ₹2,979 crores
    • Debt/Reserves: ₹186 crores / ₹315 crores
    • Promoter Holding: 73.8%

    Long-Term Growth Projections

    Revenue Growth Outlook

    • Management Guidance: 20-25% growth in next fiscal year
    • 9-month results show growth up to 45%
    • Potential growth scenarios:
      • 5-year horizon: High single-digit growth
      • 10-year horizon: Low double-digit growth
      • 15-20 year horizon: Substantial market share expansion

    Strategic Competitive Advantages

    • Focus on high-margin product segments
    • Customized, ethically sourced jewelry
    • Efficient logistics and geographic proximity of stores
    • Potential margin improvement of 20-25% in coming years

    Risk Factors

    1. Gold Price Volatility
    2. Execution Risk in Store Expansion
    3. Increasing Market Competition
    4. Potential Margin Pressure

    Valuation Considerations

    • Current P/E Ratio: 28.7
    • Reflects market growth expectations
    • No significant credit rating changes mentioned
    • Strong balance sheet with moderate debt

    Investment Thesis

    Bull Case

    • Rapid store expansion
    • Growing organized jewelry market
    • Strong margin improvement potential
    • Capturing share of ₹10 lakh crore Indian wedding market

    Bear Case

    • Commodity price fluctuations
    • Execution challenges in new markets
    • Increasing competitive pressures

    Conclusion

    D.P. Abhushan Limited presents a compelling investment opportunity in the Indian jewelry market, backed by strong financial performance, strategic expansion, and a focus on high-margin product segments.

    Disclaimer: This analysis is for informational purposes only. Investors should conduct independent research and consult financial advisors before making investment decisions.

  • Lloyds Metals: 600% Growth Potential by 2045 – The Definitive Investment Roadmap for Visionary Investors

    Lloyds Metals & Energy Ltd – Comprehensive Q3 FY2025 Equity Research Report

    Lloyds Metals & Energy Ltd

    Comprehensive Equity Research Report – Q3 FY2025

    Market Cap

    ₹54,156 Cr

    Current Price

    ₹1,035

    P/E Ratio

    35.4

    Executive Summary

    Lloyds Metals & Energy Ltd has demonstrated exceptional performance in Q3 FY2025, showcasing a strategic multi-pronged expansion approach with key highlights including:

    • Record sponge iron production
    • Improved iron ore realizations
    • Significant capital expenditure of ₹2,700 Cr in 9 months
    • Target of 25 million tons production in FY26

    Business Overview & Segments

    Segment Description Q3 Performance
    Iron Ore Core mining operations 2.4 million tons dispatched, ₹5,894/ton (+8% YoY)
    Sponge Iron Direct Reduced Iron production Record production with optimal capacity utilization
    Steel & Pellets Final product manufacturing Upcoming 1.2-million-ton steel facility, 4-million-ton pellet plant

    Growth Strategy & Expansion Roadmap

    Key Upcoming Projects

    • 4-million-ton pellet facility at Ghugus
    • 1.2-million-ton steel facility at Chandrapur
    • BHQ beneficiation project (15-million-ton module in FY27)
    • Renewable energy tie-ups targeting 100 MW green power

    Capital Expenditure Plan

    Timeline Capex Investment Purpose
    Q3 FY2025 ₹2,700 Cr Ongoing expansion and capacity enhancement
    Year-end ~₹5,000 Cr Additional infrastructure and project development
    Next Two Years ₹6,000–6,500 Cr Annually Sustained growth and strategic investments

    Financial Performance

    Metric Current Value 3-Year Growth
    Sales ₹7,082 Cr 196%
    Net Profit ₹1,526 Cr 2,014%
    Return on Equity (ROE) 56.6% Consistent High Performance
    Revenue Target Over ₹40,000 Cr By FY28-29

    Long-Term Return Projections

    Investment Horizon Projected Return Growth Multiple
    5 Years ~50% 1.5×
    10 Years ~200%
    15 Years ~400%
    20 Years ~600%

    Risk Assessment

    Potential Strengths

    • Integrated operations
    • Captive raw material sourcing
    • Technological upgrades
    • Diversified product mix

    Potential Risks

    • Regulatory and environmental clearances
    • Commodity price volatility
    • Steel sector overcapacity
    • Potential project execution challenges

    Disclaimer: This comprehensive report is for informational purposes only. Investors are strongly advised to conduct independent due diligence, perform personal research, and consult with qualified financial advisors before making any investment decisions.

  • Kilitch Drugs : Q3 FY2025 Results & Strategic Analysis

    Kilitch Drugs (India) Ltd – Q3 FY2025 Results & Strategic Analysis

    Kilitch Drugs (India) Ltd

    Q3 FY2025 Results and Strategic Outlook

    1. Executive Summary & Investment Thesis

    Kilitch Drugs delivered robust Q3 performance with strong sales momentum and notable profit expansion. The company’s strategic emphasis on product diversification and planned capital investments positions it for sustained growth.

    Trading at a P/E of 29.3x with impressive sales and profit growth, supported by disciplined balance sheet management and high promoter holding of 69.2%.

    2. Q3 Financial Performance

    Standalone & Consolidated Highlights

    Standalone Net Sales

    ₹46.5 Cr

    Consolidated Sales

    ₹56.2 Cr

    Quarterly Growth

    76.7%

    PAT

    ₹6.88 Cr

    3. Future Growth Plans & Expansion Strategy

    Product Portfolio & R&D

    Expanding product mix with innovative formulations in high-growth therapeutic segments
    Strengthening R&D capabilities for next-generation product launches

    Capital Expenditure & Capacity Expansion

    Upgrading manufacturing facilities and modernizing production lines
    Focus on achieving economies of scale and reducing cost structures

    3-Year Sales Growth Target

    31.2%

    3-Year Profit Growth Target

    63.7%

    4. Competitive Landscape & Risks

    Market Position

    Well-entrenched market presence in pharmaceutical sector
    High promoter holding (69.2%) aligning with shareholder interests

    Risk Factors

    Regulatory environment changes and compliance requirements
    Market competition and pricing pressures
    Supply chain disruptions and cost inflation challenges

    5. Valuation & Investment Metrics

    Market Cap

    ₹526 Cr

    Current Price

    ₹327

    52-Week Range

    ₹294-₹431

    P/E Ratio

    29.3x
    Metric Value
    Book Value ₹118
    ROCE 12.6%
    ROE 7.71%
    Debt ₹32.4 Cr
    Reserves ₹173 Cr

    6. Key Performance Indicators

    Operating Profit Margin

    13.0%

    Quarterly Sales

    ₹182 Cr

    Quarterly PAT

    ₹17.9 Cr

    Promoter Holding

    69.2%

    7. Conclusion

    Kilitch Drugs’ strong Q3 results, combined with its clear growth roadmap and strategic initiatives, present a compelling investment case despite premium valuations. The company’s robust sales dynamics and disciplined capital management offer potential upside, subject to effective navigation of competitive and regulatory risks.

    This report is based on Q3 FY2025 results and contains forward-looking statements. Actual results may vary from projections. Investors should conduct their own due diligence before making investment decisions.

  • ABB India Limited – Q3 FY2025 Results Research Report

    Executive Summary & Investment Thesis


    ABB India continues to demonstrate operational strength amid a transformative phase in industrial automation. The company’s Q3 performance was marked by robust revenue growth and margin expansion across core segments, underpinned by strategic investments and an aggressive expansion agenda. Despite trading at a premium (P/E 58.1), its high return metrics (ROE 28.8%, ROCE 38.6%), strong balance sheet, and diversified product portfolio support a positive medium-term outlook. Investors seeking exposure to a leader in electrification, motion, and process automation may find the current valuation attractive if future growth catalysts materialize.


    Detailed Q3 FY2025 Performance Highlights

    • Revenue & Profitability:
      • Q3 revenue from continuing operations reached approximately ₹3,365 Cr—a 22% sequential improvement and a notable increase over corresponding quarters in previous years.
      • Profit from continuing operations (after tax) stood at around ₹532 Cr, yielding an EPS in the mid-20s, reflecting strong cost discipline and improved operating leverage.

    • Segmental Performance:
      Electrification: Delivered the highest segment revenue (≈₹1,503 Cr) with improved contribution margins, driven by increasing demand for energy-efficient solutions and smart grid technologies.
      Motion: Reported revenues of around ₹1,119 Cr with steady growth, reflecting robust demand in industrial drives and automation solutions.
      Process Automation: Recorded revenues near ₹628 Cr, demonstrating resilience despite competitive pressures, while robotics & discrete automation added incremental revenue (~₹131 Cr).
      • The strategic divestment in Power Grids, now reported as discontinued operations, has helped sharpen focus on high-growth, high-margin segments.

    Future Growth Plans & Planned Expansions

    • Manufacturing & Capacity Expansion:
      • ABB India is aggressively expanding its manufacturing capabilities. Recent capital expenditure of roughly ₹214 Cr on property, plant, and equipment reflects an ongoing strategy to boost capacity and modernize production lines in key segments.
      • The expansion plans include not only increased production capacity but also enhanced digital integration to support Industry 4.0, enabling predictive maintenance, real-time monitoring, and improved supply chain resilience.

    • Market & Product Diversification:
      • The firm is investing in R&D to enhance its product portfolio—ranging from robotics and motion control systems to advanced electrification and process automation solutions.
      • Future financial projections suggest sustained sales growth in the range of 16–20% per annum, supported by a robust order backlog and the gradual penetration of new markets both domestically and internationally.

    Products, Capital Expenditure & Strategic Rationale

    • Diverse & Innovative Product Portfolio:
      • ABB India’s offerings include cutting-edge solutions in robotics, discrete automation, motion control, electrification, and process automation. These products are tailored for industries such as manufacturing, utilities, and transportation, addressing the increasing demand for efficiency and sustainability.

    • Strategic CapEx Investments:
      • The company’s CapEx strategy is designed to modernize existing facilities, expand production capacities, and integrate advanced digital technologies.
      • Such investments are expected to yield operational efficiencies, reduce long-term costs, and support the development of high-margin products, thereby reinforcing ABB India’s competitive edge in a rapidly evolving market.

    Competitive Landscape & Inherent Risks

    • Competitive Advantages:
      • With a strong brand presence, deep technological expertise, and diversified product lines, ABB India is well-positioned against competitors such as Siemens, Schneider Electric, and emerging domestic players.
      • High return ratios (ROE 28.8%, ROCE 38.6%) and significant promoter holding (75%) reflect robust investor confidence and stability.

    • Risks & Challenges:
      Valuation Risk: Trading at a premium (P/E 58.1) implies high market expectations. Any slowdown in growth or margin compression could lead to valuation corrections.
      Market Dynamics: The rapidly evolving landscape in automation, evolving regulatory norms, and potential supply chain disruptions pose ongoing risks.
      Macroeconomic Factors: Broader economic uncertainties, including fluctuations in raw material costs and currency risks, could impact profitability.

    Valuation Estimate & Key Financial Metrics

    • Valuation Overview:
      • With a market cap of approximately ₹1,08,979 Cr and a current trading price of around ₹5,142 (fluctuating between ₹4,462 and ₹9,200), the premium valuation is supported by strong growth prospects and solid fundamentals.
      • A detailed DCF analysis would help refine a medium-term target price, but based on current trends, a target range of ₹6,000–₹6,500 appears reasonable if the company continues to deliver on its growth agenda.

    • Key Metrics for Reference:
      Market Cap: ₹1,08,979 Cr
      Current Price: ₹5,142
      High/Low Range: ₹9,200 / ₹4,462
      Stock P/E: 58.1
      Book Value: ₹334
      Dividend Yield: 0.46%
      ROCE: 38.6%
      ROE: 28.8%
      Debt: ₹51.9 Cr
      Reserves: ₹7,033 Cr
      Annual Sales: ₹12,188 Cr
      Profit after Tax: ₹1,875 Cr
      Sales Growth (3 Years): 20.7%
      Profit Growth (3 Years): 63.1%
      Promoter Holding: 75%

    Conclusion & Disclaimer
    ABB India Limited’s Q3 results highlight a company on an upward trajectory, leveraging technology, capacity expansion, and strategic investments to capture growth in a competitive, evolving market. The robust performance across high-margin segments combined with disciplined capital allocation underpins a strong investment thesis. However, the high valuation and exposure to market and operational risks necessitate a cautious approach.

    This report is for informational purposes only and does not constitute investment advice. Investors should perform their own due diligence and consult with a qualified financial advisor before making any investment decisions.

Value Picks fin.ctoi.in
Value Picks

Dont Miss our Value picks

SUBSCRIBE TO OUR NEWSLETTER to Get short term, long term and multi-bagger

We don’t spam! Read our privacy policy for more info.