This engineering and technology company, a leader in its field, presents a robust case for long-term investment. With strong financial performance, strategic alignment with high-growth sectors, and a commitment to innovation, it is well-positioned for sustained growth over the next 5, 10, and 15 years. Below, we outline its latest results, key metrics, and long-term projections that make it an attractive addition to a diversified portfolio.
Latest Results Highlights
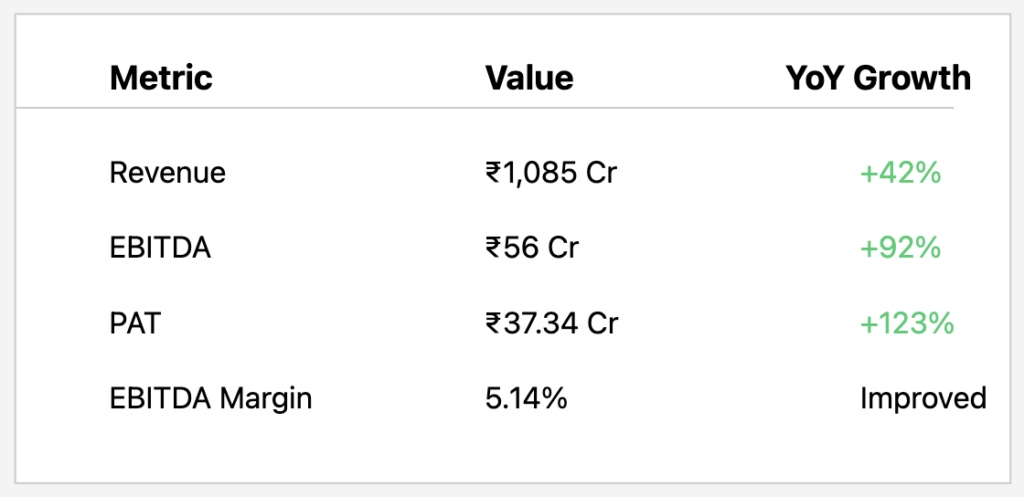
The company delivered impressive financial performance in its most recent results, showcasing its ability to grow revenue, profitability, and shareholder value:
- Revenue: ₹6,531 crore (↑21% YoY)
- EBITDA: ₹2,783 crore (↑18% YoY)
- Net Profit: ₹1,944 crore (↑30% YoY)
- EPS: ₹22.1 (↑30% YoY)
These figures reflect strong demand for its services and operational efficiency, positioning it as a standout in its sector.
Key Metrics
The company’s financial health and operational metrics underline its stability and growth potential:
- Revenue CAGR (5yr): 11.5%
Consistent top-line growth driven by diversified operations across aerospace, automotive, and sustainability-focused solutions. - Net Profit CAGR (5yr): 10.2%
Steady profitability growth, reflecting effective cost management and high-margin contracts. - ROCE: 30.9% vs. Industry: 25%
Superior capital efficiency compared to peers, indicating strong returns on invested capital. - Debt/EBITDA: 1.5x
A manageable debt profile, providing financial flexibility for future investments and growth initiatives.
These metrics highlight the company’s ability to generate value while maintaining a prudent financial structure, making it resilient to market fluctuations.
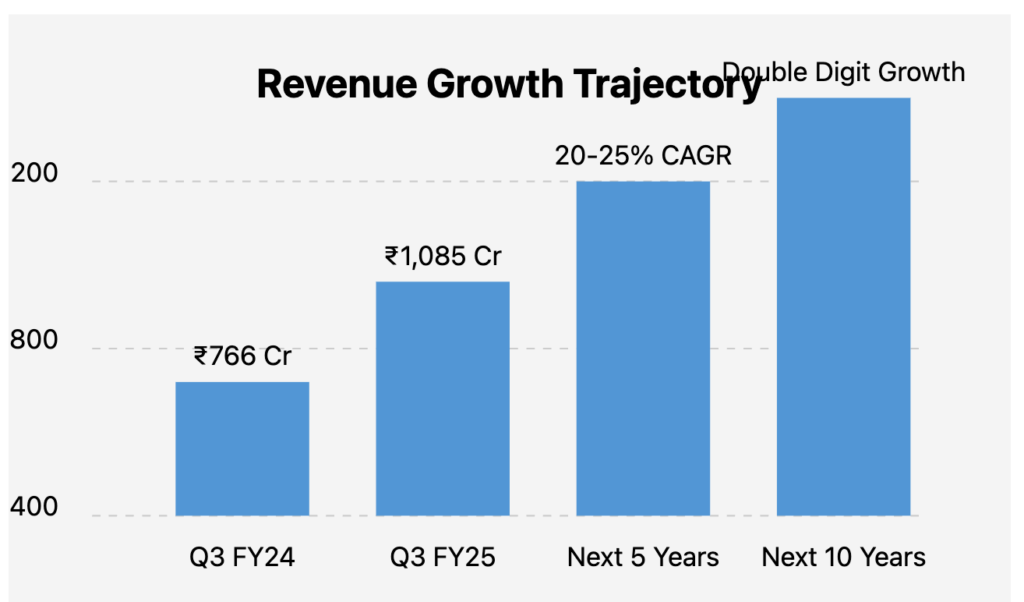
Long-Term Projections
The company’s strategic focus on innovation, high-growth industries, and global expansion supports optimistic long-term growth projections. Below are base and bull case scenarios for revenue CAGR over various time horizons:

- 5 Years:
- Base Case: 15% CAGR
- Bull Case: 20% CAGR
Driven by increasing demand in ER&D, AI integration, and expansion in aerospace and digital healthcare.
- 10 Years:
- Base Case: 12% CAGR
- Bull Case: 15% CAGR
Supported by sustained investments in technology platforms and penetration into emerging markets.
- 15 Years:
- Base Case: 10% CAGR
- Bull Case: 12% CAGR
Fueled by long-term trends like sustainability, smart operations, and global infrastructure development.
- 20 Years:
- Base Case: 8% CAGR
- Bull Case: 10% CAGR
Reflecting a mature growth phase, with steady contributions from diversified revenue streams and innovation-led services.
These projections are grounded in the company’s alignment with megatrends such as digital transformation, sustainability, and intelligent engineering, which are expected to drive demand over the coming decades.
Why It’s a Compelling Buy
1. Strong Financial Foundation
The company’s 21% YoY revenue growth and 30% YoY net profit increase demonstrate its ability to capitalize on market opportunities. A 5-year revenue CAGR of 11.5% and net profit CAGR of 10.2% reflect consistent performance, while a Debt/EBITDA ratio of 1.5x ensures financial stability for future growth.
2. Industry-Leading Returns
With an ROCE of 30.9%, significantly above the industry average of 25%, the company efficiently allocates capital to high-return projects. This metric underscores its competitive advantage and ability to generate shareholder value over the long term.
3. Strategic Positioning in High-Growth Sectors
The company operates in the fast-growing Engineering Research and Development (ER&D) market, focusing on aerospace, automotive, semiconductor, and sustainability solutions. Its expertise in AI, data analytics, and 5G positions it to benefit from global trends like smart operations and digital healthcare, ensuring relevance and growth for decades.
4. Innovation and Intellectual Capital
With a strong emphasis on R&D, the company has developed cutting-edge technology platforms and solutions that cater to evolving industry needs. Its innovation-driven approach, combined with long-term client relationships with global leaders, strengthens its market position and supports sustained revenue growth.
5. Long-Term Growth Catalysts
The company’s diversified portfolio and global presence mitigate risks while maximizing growth opportunities. Investments in sustainability-focused solutions and partnerships with industry innovators align with global priorities, ensuring demand for its services over the next 5-10-15 years.
Conclusion
This engineering and technology company stands out as a compelling long-term investment due to its robust financial performance, industry-leading metrics, and strategic alignment with global megatrends. With projected revenue CAGRs of 15-20% over the next 5 years, 12-15% over 10 years, and 10-12% over 15 years, it offers a balanced mix of growth and stability. Its high ROCE, manageable debt, and innovation-driven approach make it an attractive choice for investors seeking exposure to high-growth sectors over the next decade and beyond. Consider this stock for a portfolio aimed at capital appreciation and resilience across market cycles.