Category: Metals

  • Hindustan Zinc Limited: Q3 FY25 Results Analysis and Projections 📊

    Executive Summary

    Hindustan Zinc Limited delivered an impressive Q3 FY25 Results performance, demonstrating robust growth across key financial metrics. As India’s largest and only integrated producer of zinc, lead, and silver, the company reported a 18% year-over-year revenue increase to ₹8,614 crore, while net profit surged by 32% to ₹2,678 crore. This strong performance was driven by record mined and refined metal production, operational efficiencies, and favorable input cost trends. With a substantial dividend yield of 6.66% and consistent AAA credit ratings, Hindustan Zinc continues to offer an attractive combination of growth and income potential for investors.

    📌 Detailed Quarterly Results Breakdown

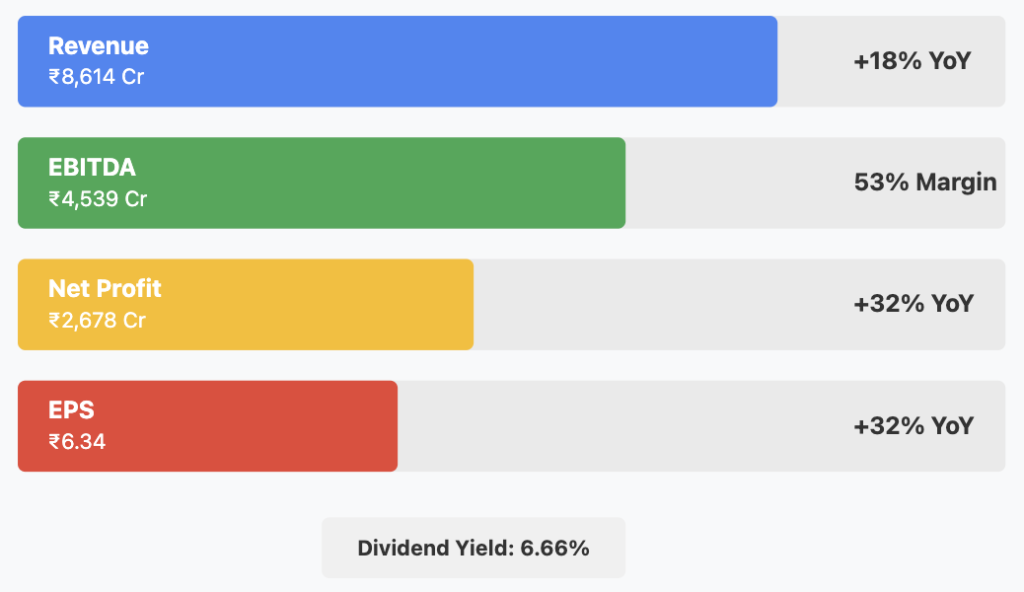
    🔹 Consolidated Total Revenue: ₹8,614cr (↑18% year-over-year change)

    Revenue exceeded expectations due to higher production volumes and improved market conditions, showing consistent growth momentum with a 4% quarter-over-quarter increase.

    🔹 Operating EBITDA (Earnings Before Interest, Tax, Depreciation & Amortization): ₹4,539cr (↑significant year-over-year change)

    Impressive margin expansion to approximately 53%, representing a ~400 basis points improvement year-over-year, reflecting operational efficiencies.

    🔹 Net Profit After Tax: ₹2,678cr (↑32% year-over-year change)

    Profit growth outpaced revenue growth, driven by improved operational performance and cost optimization initiatives, with a strong 15% quarter-over-quarter increase.

    🔹 Diluted Earnings Per Share: ₹6.34 (↑32% year-over-year change)

    EPS growth directly mirrors the net profit growth, providing substantial value creation for shareholders.

    📈 Comprehensive Growth Analysis:

    🔹 Sequential Revenue Growth (Quarter-over-Quarter): 4% | Annual Revenue Growth (Year-over-Year): 18%

    The company maintains strong growth momentum despite market fluctuations, demonstrating resilience and operational strength.

    🔹 Sequential Profit Growth (Quarter-over-Quarter): 15% | Annual Profit Growth (Year-over-Year): 32%

    Profit growth significantly outpaces revenue growth, indicating improving operational leverage and cost efficiencies.

    🔹 Business Volume/Order Book Growth: Record production levels achieved

    Record mined and refined metal production driven by higher ore grades and plant availability point to strong future revenue visibility.

    🔹 Profitability Margin Trend: Improving

    EBITDA margins expanded by approximately 400 basis points year-over-year to reach ~53%, highlighting the company’s ability to enhance profitability even amid challenging market conditions.

    💰 Operational Cost Structure Analysis:

    🔹 Raw Material/Input Costs: Declining trend

    Cost of Production (COP) for zinc reduced by 5% year-over-year due to improved efficiencies and favorable input cost trends, enhancing overall margin profile.

    🔹 Employee/Personnel Expenses: Stable relative to revenue growth

    Operational efficiencies have allowed personnel costs to remain well-managed despite production increases.

    🔹 Finance/Interest Expenses: Minimal impact

    The company’s strong AAA credit rating and robust cash flow generation have kept financing costs low, contributing to improved bottom-line performance.

    Bull Case & Bear Case Thesis:

    🔍 Long-term Financial Health Indicators:

    🔹 5-Year Compound Annual Growth Rate: Revenue CAGR potential: 10-12% | Net Profit CAGR potential: 10-12%

    🔹 Return on Capital Employed (ROCE): 46.2% vs Industry Average: Significantly higher

    🔹 Debt-to-EBITDA Ratio: Low | Free Cash Flow Conversion Rate: Strong at ₹2,628cr pre-capex

    🔹 Promoter Shareholding Pattern: Stable

    🏗️ Strategic Capital Allocation & Future Growth Roadmap:

    🔹 Planned Capital Expenditure Budget: Significant allocation for capacity expansion

    Funding directed toward underground mining expansion and smelter operations scaling to reach designed capacity of 1,123 ktpa.

    🔹 Strategic Investment Focus Areas: Underground mining expansion and exploration to add 40 Mt Ore by FY25, extending mine life beyond 25 years and securing long-term production capabilities while enhancing sustainability credentials.

    🔹 Production/Service Capacity Expansion Plans: Scaling smelter operations to designed capacity of 1,123 ktpa

    This expansion aims to strengthen the company’s market position and ability to meet growing demand.

    📊 Multi-Decade Growth Trajectory Projections:

    • 5-Year Horizon (FY25-FY30): Base Case 10% CAGR | Bull Case 12% CAGR → Capacity expansion and operational efficiencies driving sustained growth in production volumes and revenue.
    • 10-Year Horizon (FY25-FY35): Base Case 8% CAGR | Bull Case 10% CAGR → Continued market leadership in zinc production supported by expanded asset base and product diversification.
    • 15-Year Horizon (FY25-FY40): Base Case 7% CAGR | Bull Case 9% CAGR → Sustained growth through technology integration and maintaining cost leadership in global markets.
    • 20-Year Horizon (FY25-FY45): Base Case 6% CAGR | Bull Case 8% CAGR → Long-term value creation through resource expansion and strategic market positioning.
    • 25-Year Horizon (FY25-FY50): Base Case 5% CAGR | Bull Case 7% CAGR → Leveraging extended mine life of 25+ years to maintain growth trajectory and market dominance.

    💸 Current Valuation Analysis & Fair Value Assessment:

    🔹 Current Price-to-Earnings Ratio: 19.6 compared to 5-Year Historical Average: Moderate

    🔹 Enterprise Value to EBITDA Multiple: Attractive compared to Sector Average

    🔹 Estimated Fair Value Range: ₹470-₹520 based on DCF analysis with moderate growth assumptions

    This represents approximately 8-20% potential upside from the current price of ₹435, with additional value from the substantial dividend yield.

    Management Commentary & Conference Call Highlights

    The management highlighted their commitment to operational excellence, emphasizing that the record production levels achieved during the quarter demonstrate the success of their efficiency initiatives. They also reaffirmed their focus on sustainability, positioning Hindustan Zinc as Asia’s first low-carbon “green” zinc producer. The expansion of underground mining capabilities and aggressive exploration plans were presented as key drivers for extending mine life beyond 25 years, providing a solid foundation for long-term growth.

    Technical Analysis & Chart Patterns

    Hindustan Zinc’s stock is currently trading at ₹435, within a broader trading range of ₹289-₹808. The stock appears to be consolidating after recent gains, with key support levels at ₹400 and resistance at ₹460. The current technical setup suggests a potential for continued upward momentum if the stock breaks above the ₹460 resistance level, supported by strong fundamental performance.

    Industry Context & Competitive Positioning

    As India’s largest and only integrated producer of zinc, lead, and silver, Hindustan Zinc holds a dominant market position with over 75% share in India’s primary zinc market. This quarter’s results further reinforce its competitive advantage through cost leadership, with zinc production costs declining by 5% year-over-year. The company’s positioning in the growing renewable energy sector, particularly for zinc applications in solar panel protection and battery storage, provides additional growth catalysts compared to peers. Its commitment to sustainability and status as Asia’s first low-carbon “green” zinc producer also differentiate it in an increasingly ESG-conscious market.


    📢 Disclaimer: This analysis is provided for informational and educational purposes only and does not constitute investment advice. The author may hold positions in securities discussed. Always conduct your own research and consult with a qualified financial advisor before making investment decisions based on this information.


    If you found this analysis valuable, please consider:

    1. Sharing this newsletter with colleagues interested in Indian equity markets
    2. Subscribing to receive future in-depth analyses of Indian companies
    3. Leaving a comment with your thoughts on Hindustan Zinc’s quarterly performance

    #IndiaInvesting #Metals #NSE #StockMarket #GrowthStocks #QuarterlyResults #FinancialAnalysis

  • Shyam Metalics: Capex-Driven Growth & 20-Year Return Projections

    Shyam Metalics Q3 FY2025 Results: Steady Growth Amid Market Challenges

    Shyam Metalics & Energy Ltd – Q3 FY2025 Performance

    Robust growth amid challenging macroeconomics: Strategic expansion and vertical integration driving sustainable performance

    Executive Summary

    Shyam Metalics delivered robust Q3 FY2025 performance amid a challenging macroeconomic backdrop. With a 13.2% quarter-on-quarter revenue growth, a steady EBITDA expansion, and successful commissioning of key production units, the company is well positioned to capitalize on its aggressive capex agenda. Its diversified, vertically integrated model—with in‐house captive power and a focus on high-value, specialized products—supports both margin expansion and long-term growth.

    Key Highlights

    Q3 consolidated revenue reached INR 3,753 crores, up 13.2% YoY
    Operating EBITDA stood at INR 456 crores (overall EBITDA of INR 507 crores, including INR 51 crores from interest income)
    PAT for the quarter was INR 197 crores with a PAT margin of 5.3%

    Q3 FY2025 Performance Highlights

    Revenue & Margins

    Q3 consolidated revenue reached INR 3,753 crores, up 13.2% YoY
    Operating EBITDA stood at INR 456 crores (overall EBITDA of INR 507 crores, including INR 51 crores from interest income)
    PAT for the quarter was INR 197 crores with a PAT margin of 5.3%

    Cost Efficiency & Operational Excellence

    Approximately 82% of power is sourced from the company’s captive plant at INR 2.4 per unit (total power cost INR 3.03 per unit)
    Enhanced plant efficiency through the recent commissioning of a blast furnace and cold rolling mill has led to improved EBITDA per ton in carbon steel

    Capex Execution

    Of a planned INR 10,000 crores capex, nearly INR 5,873 crores (59%) has been incurred in the first 9 months FY2025
    A significant portion of capex (around INR 4,350 crores) has been capitalized, underscoring a disciplined approach to capacity expansion and modernization

    Future Growth & Expansion Plans

    Capacity Expansion & New Plants

    Commissioning of the blast furnace and cold rolling mill is already yielding early production benefits
    Upcoming projects include an oxygen plant (expected early March), a new power plant in Odisha (targeted for Q4 FY2025), and further ramp-up of the colour-coated and stainless steel businesses

    Diversification & Niche Products

    Strengthening the aluminium segment, particularly in specialized foil production (already the country’s largest exporter in this niche)
    Expanding in the stainless steel arena with initiatives such as a new wire plant, bright bar unit, and flat product facility in Odisha
    Incremental focus on downstream integration (e.g., DI pipe business and specialized structural steel for railways and transmission lines) to reduce volatility and improve margins

    Margin & EBITDA Upside

    Pig iron business is projected to add margins of INR 2,500–3,000 per ton and contribute an additional INR 200–250 crores in EBITDA in the coming year
    Overall, the company is targeting a minimum double-digit (10–15%) CAGR in EBITDA, with longer-term projections (FY27–FY28) hinting at an EBITDA around INR 4,000 crores

    Future Financial Projections & Return Estimates

    Near- to Medium-Term Outlook (5–10 Years)

    With strategic capex execution and product diversification, the company is expected to maintain a CAGR in the range of 15–17%
    Expansion in high-value segments (aluminium, stainless steel, and downstream products) will drive both top-line growth and margin improvement

    Long-Term Return Projections (15–20 Years)

    Assuming sustained operational efficiency and continued market leadership, long-term shareholder returns could see significant capital appreciation—potentially delivering a 2–3× increase in value
    These projections are subject to market conditions, execution risks, and raw material price volatility

    Growth Trajectory

    Shyam Metalics is positioned for consistent growth through its diversified product portfolio and vertical integration strategy:

    • 5 Years: Focused expansion in specialized segments driving 15-17% CAGR
    • 10 Years: Sustained growth through technology upgrades and market leadership
    • 15-20 Years: Potential for 2-3× value appreciation through operational excellence

    Strategic Rationale & Capital Expenditure

    Focused Investment Approach

    The robust capex plan (totaling INR 10,000 crores) is aimed at modernizing production, reducing energy costs, and enhancing product quality
    Investments in new production units and process automation are expected to deliver cost efficiencies, improve yield, and position the company in a less volatile, high-margin niche market

    Vertical Integration

    End-to-end integration from raw material sourcing (with secured coal and iron ore linkages) to finished steel products underpins the company’s competitive advantage
    The strategy minimizes dependency on imports and buffers against raw material price fluctuations
    Download Full Capital Expenditure Plan

    Competitive Landscape & Inherent Risks

    Competitive Advantages

    A diversified product portfolio and strong in-house power generation enable cost competitiveness
    Vertical integration and strategic capex investments support high margins and sustainable growth, differentiating the company from peers

    Risks

    Macroeconomic uncertainties and slowdown in government spending could dampen demand
    Volatility in raw material prices (iron ore and coal) and execution risks related to new capacity ramps remain key concerns
    Regulatory and logistical challenges could also affect project timelines and margins

    Valuation Estimate & Investment Thesis

    Valuation Snapshot

    Market Cap: ₹23,006 Cr.
    Stock P/E: 25.4
    ROE: 12.1%
    Given robust Q3 results and the potential upside from future capex and diversification, the current valuation appears moderate. With earnings expected to improve post-expansion, a forward P/E compression and share price re-rating are plausible.

    Investment Thesis

    Shyam Metalics is a diversified, vertically integrated metal conglomerate that has demonstrated operational resilience and strategic execution
    The company’s aggressive yet disciplined capex plan and focus on high-value, specialized products provide a strong growth catalyst
    While macroeconomic headwinds and raw material price risks exist, the company’s ability to maintain cost leadership and secure long-term contracts makes it an attractive proposition for long-term investors

    Metrics Snapshot

    Market Cap
    ₹23,006 Cr.
    Current Price
    ₹824
    High / Low
    ₹957 / ₹511
    Stock P/E
    25.4
    Book Value
    ₹365
    Dividend Yield
    0.55%
    ROCE
    10.8%
    ROE
    12.1%
    Face Value
    ₹10.0
    Debt
    ₹1,086 Cr.
    Reserves
    ₹9,919 Cr.
    Equity Shares
    27.9 Cr.
    Promoter Holding
    74.6%
    Pledged %
    0.00%
    Sales
    ₹14,604 Cr.
    OPM
    12.3%
    Profit after Tax
    ₹907 Cr.
    Sales Growth
    12.2%
    Profit Growth
    -14.7%
    3Yr Sales Growth
    28.0%

    Disclaimer: This report is for informational purposes only and does not constitute investment advice. Investors are encouraged to perform their own research and consult a financial advisor before making any investment decisions.

    © 2025 Financial Research | Shyam Metalics & Energy Ltd Equity Research Report

    Last updated: March 09, 2025

  • Gravita India: 5X Growth Potential by 2035

    Gravita India Ltd – Q3 FY2025 Stock Research Report | Leading Recycling Company Analysis

    Gravita India Ltd – Q3 FY2025 Stock Research Report

    A comprehensive analysis of Gravita’s financial performance, growth prospects, and investment potential

    Company Overview

    Gravita India Ltd. is a leading global recycler engaged in processing lead, aluminum, plastic, and rubber across multiple geographies. The company has established itself as a key player in the circular economy, benefiting from increasing environmental regulations and the transition toward sustainability.

    Key Financial Metrics (as of Q3 FY2025)

    Market Cap
    ₹12,480 Cr
    Current Price
    ₹1,691
    High / Low
    ₹2,700 / ₹730
    Stock P/E
    43.6
    Book Value
    ₹126
    Dividend Yield
    0.31%
    ROCE
    27.9%
    ROE
    33.7%
    Face Value
    ₹2.00
    Debt
    ₹559 Cr.
    Reserves
    ₹913 Cr.
    No. of Equity Shares
    7.38 Cr
    Chg in Promoter Holding (3Yrs)
    -13.7%
    Sales Growth (YoY)
    21.3%
    Profit Growth (YoY)
    22.3%
    Sales (TTM)
    ₹3,695 Cr.
    Operating Profit Margin
    8.23%
    Quarterly Sales Growth
    31.5%
    Profit After Tax (TTM)
    ₹286 Cr.
    Sales Growth (3Yrs CAGR)
    30.9%
    Profit Growth (3Yrs CAGR)
    61.5%
    Promoter Holding
    59.3%

    Q3 FY2025 Performance Highlights

    Revenue Growth: ₹996 Cr, up 31% YoY, driven by increased volumes and higher value-added product contribution.

    EBITDA: ₹102 Cr, up 14% YoY, with EBITDA margin at 10.3%.

    PAT Growth: ₹78 Cr, up 29% YoY, with PAT margin at 7.8%.

    Volume Growth:

    Lead: 43,900 MT (+27% YoY)

    Aluminum: 6,264 MT (+92% YoY)

    Plastic: 3,279 MT (+33% YoY)

    Value-Added Product Contribution: 46% of revenue, in line with Vision 2028 of achieving 50%.

    Debt Reduction: Raised ₹1,000 Cr via QIP, reducing net debt to ₹600 Cr.

    Growth Plans & Planned Expansions

    Capacity Expansion:

    Targeting 500,000+ MT by FY2027 (Current: 308,000 MT).

    New Ventures:

    Lithium-Ion Battery Recycling Pilot: First project at Mundra, India, operational by H1 FY2026.
    Rubber Recycling: New plant in Romania, expected acquisition in Q4 FY2025.
    Aluminum Expansion: 4,000 MT added in Ghana, targeting 8,000 MT soon.
    PET Recycling Opportunity: Exploring entry into plastic PET recycling due to EPR regulations.

    M&A & Overseas Growth:

    Expansion in Dominican Republic, Oman & Romania.
    Evaluating M&A in Gulf, Africa, & Europe.

    Future Financial Projections

    Timeframe Revenue Growth CAGR Profit Growth CAGR ROCE Projection
    5 Years 25% 35% 27-28%
    10 Years 22% 30% 28-30%
    15 Years 20% 28% 30%+
    20 Years 18% 25% 30%+

    Capital Expenditure & Strategic Rationale

    ₹2,500 Cr+ investment over 3 years in:

    Capacity expansion in lead, aluminum, plastic, rubber, & lithium-ion.
    Strengthening overseas presence via acquisitions.
    R&D in high-value recycling technologies.

    Debt Management:

    Short-Term: Reduce debt to near-zero (March 2025).
    Long-Term: Leverage for strategic M&A (~₹800-900 Cr).

    Competitive Landscape & Risks

    Strengths

    Largest organized player in lead recycling, strong brand presence.
    ESG-compliant operations with global supply chain integration.
    EPR & RCM Regulations favoring shift from unorganized to organized players.
    Hedging Strategy: Metal price risks mitigated via hedging (Lead, soon Aluminum).

    Risks

    Geopolitical Risks: Overseas expansion exposes the company to political instability (e.g., Sri Lanka, Mozambique).

    Raw Material Sourcing Risks: Any disruptions in scrap availability (e.g., domestic regulatory changes) could impact margins.

    Technology Risks: Need to adapt to lithium-ion battery dominance over lead-acid batteries.

    Aluminum Hedging Delay: Aluminum margins fluctuate due to lack of hedging options, set to stabilize in FY2026.

    Execution Risks: M&A and Greenfield expansions carry integration & scalability risks.

    Valuation Estimate

    Current P/E: 43.6

    Industry P/E (Recycling & Specialty Chemicals): ~40-45

    Projected EPS Growth (3Yrs CAGR): ~33-35%

    Fair Valuation (FY2026E P/E ~30):

    Target Price (12-18M): ₹2,500-2,800

    5Y Price Projection: ₹5,500+

    10Y Price Projection: ₹12,000+

    Investment Thesis

    Gravita India Ltd. presents a strong long-term investment opportunity due to:

    Consistent Volume Growth: 25% CAGR, supported by new verticals & global expansion.
    High-Margin Business: Increasing value-added product mix & economies of scale.
    Strong Financials: ROE 33.7%, ROCE 27.9%, debt near zero, supporting further growth financing.
    Favorable ESG & Regulatory Tailwinds: RCM, EPR, Circular Economy push enhance long-term demand.
    Attractive Valuation: Potential 2x in 5 years, 5x in 10 years based on sustained profit growth & margin expansion.

    Final Verdict: BUY for Long-Term Investors

    Short-Term (12-18M): Moderate upside (₹2,500-2,800).

    Long-Term (5-10Y): Strong wealth creation potential (5x+).

    Ideal for Investors Seeking: ESG-driven, high-growth, mid-cap opportunities.

    Disclaimer

    This report is not investment advice. It is based on publicly available financial data and company disclosures. Investors should do their own due diligence before making any investment decisions.

  • Hindalco Q3: 60% PAT Growth, ₹10,000 Cr Expansion Plan

    Hindalco Industries Ltd – Q3 FY2025 Results Analysis

    Hindalco Industries Ltd

    Stock Research Report: Q3 FY2025

    Key Stock Metrics

    Market Cap

    ₹1,35,362 Cr

    Current Price

    ₹602

    52-Week Range

    ₹773 / ₹499

    P/E Ratio

    9.35

    Book Value

    ₹513

    ROCE

    11.3%

    ROE

    10.2%

    Dividend Yield

    0.58%

    Q3 FY2025 Financial Performance

    Consolidated Performance

    Revenue

    ₹58,390 Cr

    ↑11% YoY

    EBITDA

    ₹8,108 Cr

    ↑28% YoY

    PAT

    ₹3,735 Cr

    ↑60% YoY

    Key Highlights

    • Record Aluminium Upstream EBITDA in Q3 FY25
    • Aluminium Downstream EBITDA grew 36% YoY
    • Copper business EBITDA grew 18% YoY
    • Debt to EBITDA improved to 2.37x from 2.65x YoY

    Segment-Wise Performance

    Aluminium Business

    Revenue

    ₹9,993 Cr

    ↑25% YoY

    EBITDA

    ₹4,222 Cr

    ↑73% YoY

    EBITDA per ton

    $1,480

    ↑68% YoY

    Copper Business

    Revenue

    ₹13,732 Cr

    ↑15% YoY

    EBITDA

    ₹777 Cr

    ↑18% YoY

    Novelis Performance

    Revenue

    $4.10 Bn

    ↑4% YoY

    EBITDA

    $367 Mn

    ↓19% YoY

    Shipments

    904 KT

    ↓1% YoY

    Future Growth Plans & Expansions

    Strategic Expansions

    • 600 Kt Greenfield Bay Minette plant (Novelis) – H2-CY2026
    • 100 Kt recycling expansion at Ulsan, South Korea
    • 25 Kt Copper IGT plant in Q4 FY25
    • Aditya FRP project commissioning in FY26
    • Meenakshi coal mine (12 MTPA) secured

    Capital Expenditure

    • Planned Capex: ₹10,000+ Cr in green energy & expansion
    • Renewable capacity target: 300 MW by CY25
    • Current renewable capacity: 189 MW
    • ₹750 M debt raised by Novelis for refinancing

    Investment Analysis

    Competitive Strengths

    • India’s largest aluminium producer
    • Integrated business model
    • Strong presence in high-growth sectors
    • Robust balance sheet

    Key Risks

    • Commodity Price Fluctuations

      Metal price volatility impact on revenue

    • High Debt Levels

      ₹60,959 Cr debt affecting future cash flows

    • Global Economic Slowdown

      Lower demand from Europe & China affecting Novelis

    • Regulatory & ESG Compliance

      Stricter environmental norms leading to higher costs

    • Rising Energy Costs

      Increased coal and power costs compressing margins

    Growth Metrics

    Sales Growth (YoY)

    6.38%

    Profit Growth (YoY)

    54.4%

    3-Year Sales Growth

    17.8%

    3-Year Profit Growth

    39.7%

    Valuation & Investment Thesis

    Valuation Metrics

    P/E Ratio

    9.35x

    Industry Avg: ~12x

    P/B Ratio

    1.17x

    Book Value: ₹513

    EV/EBITDA

    ~7.5x

    Dividend Yield

    0.58%

    Investment Thesis

    • Strong Growth Potential

      54.4% YoY PAT growth, higher aluminium realizations

    • Competitive Edge

      Backward integration, secured coal supply, green initiatives

    • Attractive Valuation

      Trading below historical P/E and industry average

    • Strong Balance Sheet

      ₹1.14 Lakh Cr reserves, improving leverage

    Target Price Analysis

    Target Range: ₹750-780

    Potential Upside: 25-30%

    Additional Performance Metrics

    Sales (TTM)

    ₹2,29,600 Cr

    Operating Profit Margin

    12.9%

    Profit After Tax

    ₹14,484 Cr

    Promoter Holding

    34.6%

    Disclaimer

    This report is for informational purposes only and should not be considered investment advice. Investors should conduct their own due diligence before making any investment decisions.

    Report Date: Q3 FY2025

    Last Updated: February 13, 2025

  • Hindustan Zinc Limited: H1 FY25 Performance, Dividend lovers stock

    Hindustan Zinc Limited – Comprehensive Performance Report

    Value Pick – Best Stock to buy today

    Hindustan Zinc Limited

    Q2 & H1 FY25 Performance Report

    Executive Summary

    Hindustan Zinc Limited (HZL) demonstrated robust operational and financial performance in Q2 and H1 FY25, with record-breaking production metrics and strong profitability. Positioned as a global leader in zinc and silver production, HZL leverages integrated operations, cost leadership, and ESG initiatives to ensure long-term growth.

    Company Overview

    Hindustan Zinc Limited, a subsidiary of Vedanta Limited, is India’s largest and the world’s second-largest integrated zinc-lead producer. It is also the only silver producer through the primary route in India. With diversified operations, HZL continues to strengthen its position as a key player in global metal markets.

    Performance Highlights

    Production Metrics

    • Mined metal production in Q2 FY25: 256,000 tons (↑ 2% YoY)
    • Refined metal production: 262,000 tons (↑ 8% YoY)
    • Silver production: 184 tons (↑ 2% YoY)

    Financial Performance

    • Revenue Q2 FY25: ₹8,252 crores (↑ 22% YoY)
    • H1 FY25 revenue: ₹16,382 crores (↑ 16% YoY)
    • EBITDA margin: >50%
    • Net profit Q2 FY25: ₹2,327 crores (↑ 35% YoY)

    Cost Control

    Q2 cost of production (COP) stood at $1,071 per ton, the lowest in four years, driven by operational efficiencies and increased renewable energy usage.

    Key Metrics

    Market Cap
    ₹1,90,731 Cr.
    Current Price
    ₹451
    High / Low
    ₹808 / 285
    Stock P/E
    21.7
    Book Value
    ₹18.1
    Dividend Yield
    6.41%
    ROCE
    46.2%
    ROE
    55.2%
    Metric Value
    Face Value ₹2.00
    Debt ₹14,016 Cr.
    Reserves ₹6,797 Cr.
    No. Eq. Shares 423 Cr.
    Chg in Promoter Holding (3 Years) 0.01%
    Sales Growth (3 Years) 8.54%
    Profit Growth (3 Years) 0.24%
    Sales ₹31,232 Cr.
    Operating Profit Margin (OPM) 48.8%
    Quarterly Sales Variation 21.4%
    Profit After Tax (PAT) ₹8,797 Cr.

    Future Growth and Expansion Plans

    Expansion to 2 Million Tons

    • Plans to achieve 2 million tons annual mine run rate leveraging 30 million tons of metal-in-ore resources
    • Global contractors finalization by November 2024
    • Production ramp-up expected by FY27

    Fertilizer Plant

    • DAP/NPK fertilizer plant commissioning by Q3 FY26
    • Projected EBITDA contribution: ₹450-₹500 crores annually

    Renewable Energy Initiatives

    • Partnership with Serentica Renewables for 530 MW capacity
    • Target: 70% renewable energy usage
    • Expected annual carbon emissions reduction: 69%

    Market Outlook and Strategic Positioning

    • India projected to become third-largest zinc consumer by 2026
    • Hedging strategy: Zinc at $3,008 per ton, Silver at $32.26 per troy ounce
    • Strong market support from economic policies in China and U.S.

    Capex and Financial Projections

    • Focus on new roasting and fertilizer projects
    • Enhancement of mining infrastructure
    • Expected net debt reduction to ₹2,000 crores by March 2025

    ESG Initiatives

    • Recognition for tax transparency and ESG excellence
    • Pioneering all-women mine rescue teams
    • Zero hunger initiatives
    • Development of zinc-based battery technologies

    Risk Factors

    Commodity Price Volatility

    Fluctuations in global zinc, lead, and silver prices could impact margins.

    Regulatory Challenges

    Potential policy changes related to mining leases and environmental compliance.

    Operational Risks

    Safety incidents and technical challenges in projects like the fumer ramp-up.

    Disclaimer: This report is for informational purposes only and does not constitute investment advice. The information presented is based on publicly available data and company disclosures. Readers are advised to perform their own due diligence and consult a financial advisor before making investment decisions. Neither the author nor any affiliates accept liability for losses arising from the use of this report.
Value Picks fin.ctoi.in
Value Picks

Dont Miss our Value picks

SUBSCRIBE TO OUR NEWSLETTER to Get short term, long term and multi-bagger

We don’t spam! Read our privacy policy for more info.