Executive Summary
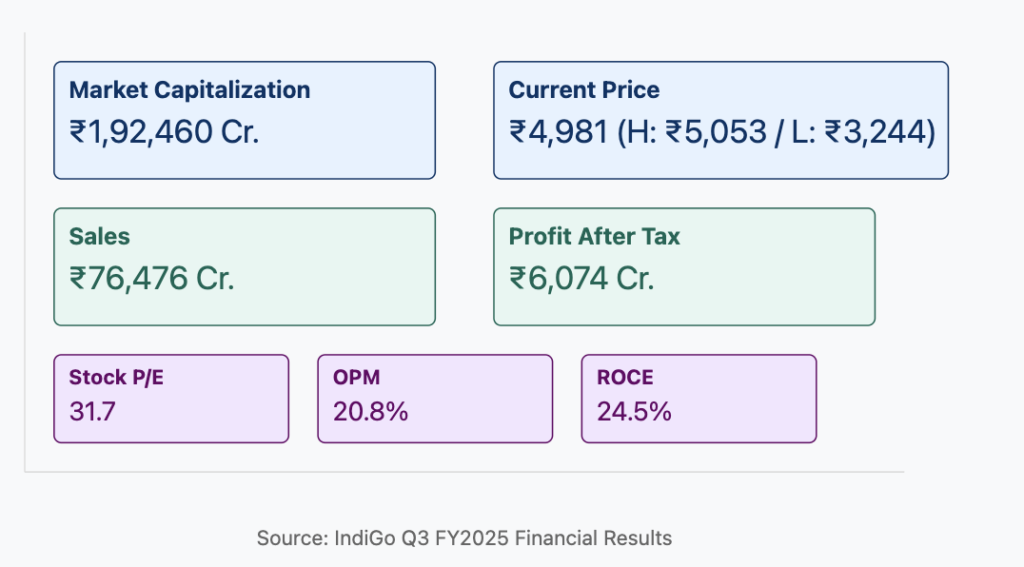
IndiGo (InterGlobe Aviation Ltd) continues to dominate India’s aviation landscape with strong domestic market presence and ambitious expansion plans. The airline’s Q3 FY2025 results demonstrate resilient performance with improved profitability metrics and strategic initiatives positioning it for sustained growth. With a market capitalization of approximately ₹1,92,460 Cr, IndiGo’s disciplined financial approach and extensive order book signal robust long-term growth potential spanning the next two decades.
Q3 FY2025 Financial Highlights
IndiGo’s financial performance in Q3 FY2025 showcases the airline’s resilience and operational efficiency:
- Total Income: ₹795 billion (trailing 12 months)
- Passenger Volume: Targeting 118 million passengers in FY25E
- Sales Growth: 17.2% (current period)
- Quarterly Sales Variation: 13.7% (quarter-over-quarter)
- Operating Profit Margin (OPM): 20.8%
- Profit After Tax: ₹6,074 Cr
- Current Profit Growth: -15.5% (reflecting short-term headwinds)
Despite facing temporary headwinds, IndiGo’s operational metrics demonstrate a return to profitability following the post-pandemic recovery period, with impressive EBITDAR margins and strengthened cash flow generation.
Cost Leadership & Operational Excellence
IndiGo’s competitive advantage continues to be anchored in its cost leadership strategy:
- Cost Per Available Seat Kilometer (CASK): Ongoing reduction through fleet optimization
- On-Time Performance: Industry-leading rate approaching 99.6%
- Aircraft Utilization: High utilization rates driving operational efficiency
- Network Optimization: Strategic route planning maximizing aircraft productivity
The airline’s focus on operational excellence and expense discipline has translated into improved financial metrics and enhanced shareholder value, positioning IndiGo favorably against domestic and international competitors.
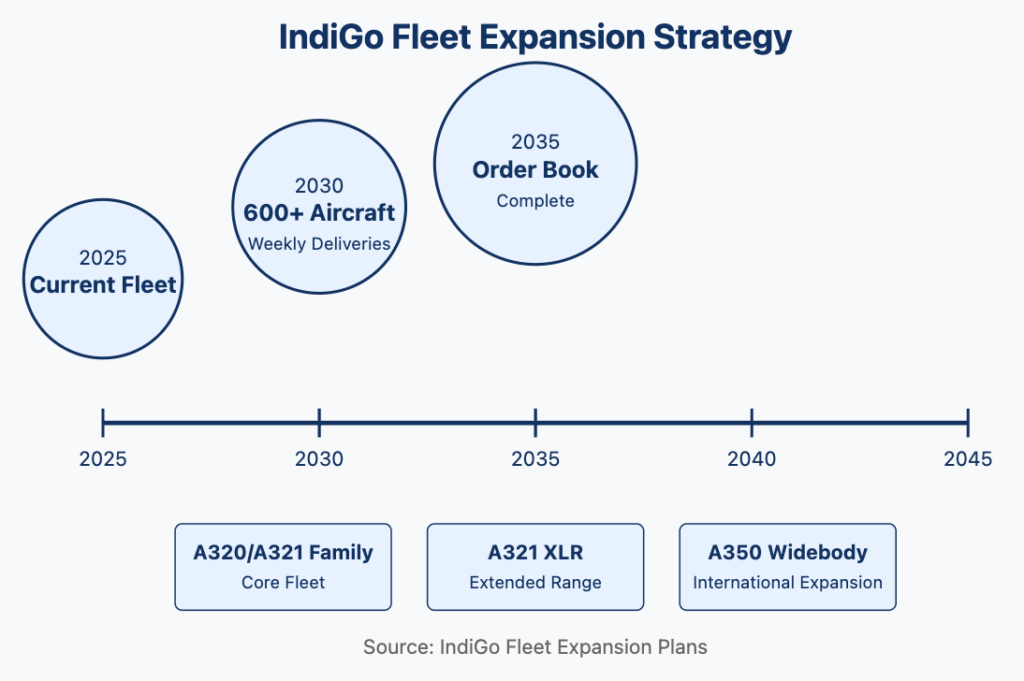
Fleet Expansion & Future Growth Strategy
IndiGo’s growth trajectory is underpinned by its ambitious fleet expansion plans:
- Aircraft Delivery Rate: One aircraft per week until FY2030
- Fleet Target: Over 600 aircraft
- Order Book Timeline: Extends to 2035
- New Aircraft Types: Addition of A350 widebodies and A321 XLRs
- Route Network: Currently serving 91 domestic destinations with growing international presence
- International Strategy: Expanding through strategic codeshare partnerships
This aggressive expansion strategy aligns with India’s economic growth prospects and rising consumer spending, positioning IndiGo to capitalize on both domestic and international aviation opportunities.
Digital Transformation & Revenue Enhancement
IndiGo is implementing comprehensive digital initiatives to enhance customer experience and drive revenue growth:
- Website & App Redesign: Improved user interface and functionality
- AI-Enabled Solutions: Chatbots for enhanced customer service
- Ancillary Revenue Growth: Projected at 30% YoY
- Digital Marketing: Targeted campaigns driving higher conversion rates
These initiatives are expected to contribute significantly to revenue diversification and margin improvement over the next five years.
Long-Term Financial Projections
5-Year Outlook (FY25-FY30)
IndiGo’s five-year horizon appears promising:
- Revenue Growth: Continued expansion driven by fleet additions and network growth
- Profit Margins: Expected improvement in operating margins
- Free Cash Flow: Enhanced generation supporting potential re-rating of valuation multiples
- International Revenue: Increasing contribution from expanded global routes
- Ancillary Revenue: Growing share of total revenue
10-Year Outlook
The decade-long perspective presents compelling growth potential:
- Market Leadership: Cemented position through fleet modernization and network densification
- Revenue Diversification: Balanced domestic and international contribution
- Profitability Metrics: Sustained improvement through operational efficiencies
- Balance Sheet Strength: Managed leverage supporting continued expansion
15-20 Year Outlook
The extended long-term view offers significant compounding potential:
- Fleet Size: Potential to become one of the world’s largest carriers by fleet size
- Global Footprint: Extensive international network covering major global destinations
- Return Profile: Strong compounded returns for long-term investors
- Market Position: Established global aviation player with strong Asian market presence
These projections are contingent on successful execution of expansion plans and favorable macroeconomic conditions.
CAPEX & Growth Investment
IndiGo’s capital expenditure strategy supports its ambitious growth plans:
- Planned CAPEX: Nearly 90% achieved of US$12 billion target (FY20-FY25)
- Investment Focus: Airport infrastructure and fleet modernization
- Financing Approach: Balanced mix of operating and finance leases
- Future Investments: Continued allocation toward network expansion and technological advancement
This disciplined approach to capital allocation ensures sustainable growth while maintaining financial stability.
Key Metrics & Valuation
Market & Valuation Metrics
- Market Capitalization: ₹1,92,460 Cr
- Current Price: ₹4,981 (Range: High ₹5,053 / Low ₹3,244)
- Stock P/E: 31.7
- Book Value: ₹96.6
- Face Value: ₹10.0
Financial Performance & Efficiency
- Sales: ₹76,476 Cr
- 3-Year Sales Growth: 67.6%
- 3-Year Profit Growth: 46.5%
- ROCE: 24.5%
Capital & Debt Structure
- Debt: ₹59,237 Cr
- Reserves: ₹3,348 Cr
- Promoter Holding: 49.3% (3-year change: -25.5%)
Bull & Bear Case Scenarios
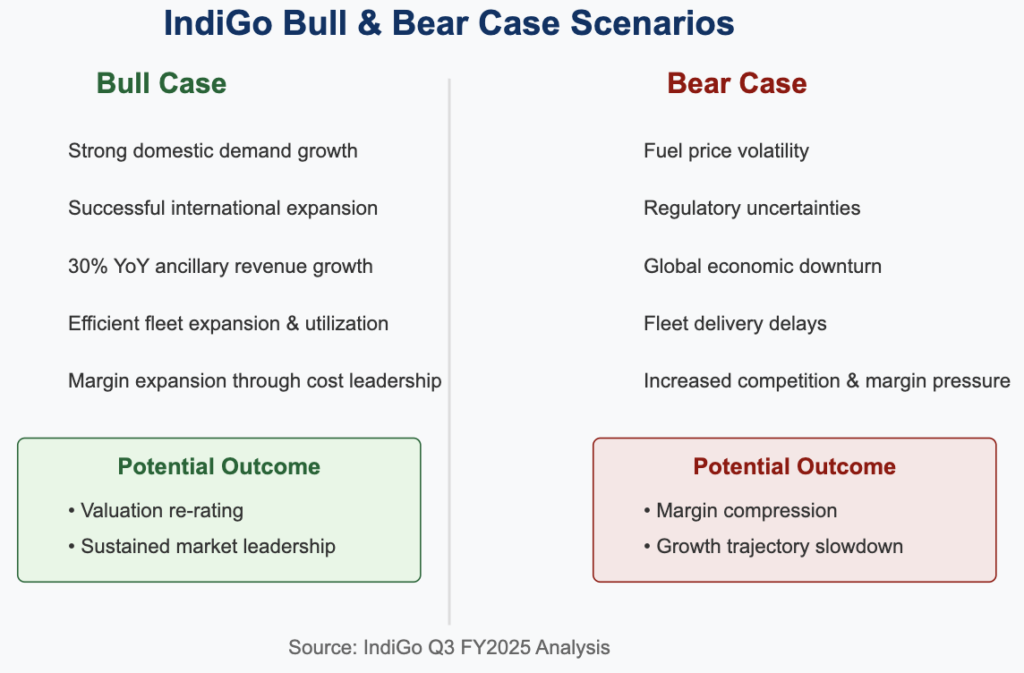
Bull Case
- Domestic Demand: Continued strength driven by rising incomes and expanding middle class
- International Expansion: Successful execution of global network strategy
- Ancillary Revenue: Significant growth through digital initiatives
- Margin Expansion: Improved through fleet optimization and operational efficiencies
- Valuation Re-Rating: Potential multiple expansion reflecting improved profitability
Bear Case
- Fuel Price Volatility: Potential margin pressure from rising fuel costs
- Regulatory Challenges: Policy changes affecting operations or cost structure
- Economic Headwinds: Global or domestic economic slowdown impacting travel demand
- Fleet Delivery Delays: Potential disruption to expansion timeline
- Competitive Intensity: Increased competition pressuring yields and market share
Expense & Operational Analysis
IndiGo’s expense management strategy continues to evolve:
- Cost Efficiency Initiatives: Ongoing programs reducing operating expenses
- Hedging Strategies: Mitigating fuel price and foreign exchange volatility
- Fleet Economics: Improved unit economics through newer, more efficient aircraft
- Operational Optimization: Enhanced resource utilization across network
- Financing Mix: Diversified approach balancing flexibility and cost
These initiatives collectively support IndiGo’s cost leadership position and contribute to its competitive advantage in the Indian aviation market.
Conclusion
IndiGo’s Q3 FY2025 performance demonstrates the airline’s resilience and strategic focus, with robust operational metrics and a clear growth roadmap. The company’s extensive order book, disciplined financial approach, and market leadership position it for substantial long-term growth. While short-term headwinds exist, the fundamental drivers—including strong ROCE, impressive sales growth, and expanding international presence—suggest compelling investment potential for those with a multi-year horizon.
Investors should consider IndiGo’s demonstrated execution capability, cost leadership strategy, and favorable market positioning when evaluating its long-term prospects in the context of India’s growing aviation market and increasing global connectivity.
Disclaimer: This report is for informational purposes only and does not constitute investment advice. Investors should conduct their own analysis and consult with financial advisors before making investment decisions.