Transformers and Rectifiers (India) Limited, renowned as one of the leading global transformer manufacturers and India’s second largest by capacity, has now updated its performance metrics. The comprehensive results for Q4 FY25 and the full FY ending 31st March 2025 are complemented by the following updated market data:
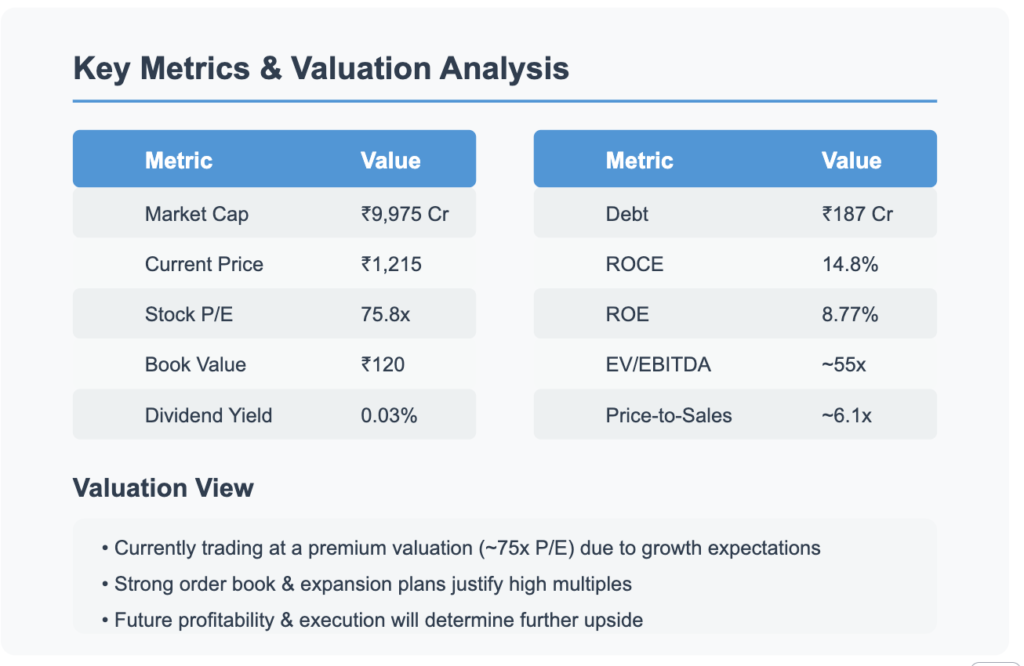
- Market Capitalization: ₹14,821 Cr.
- Current Stock Price: ₹494 (with a recorded high of ₹650 and low of ₹245)
- Stock P/E Ratio: 92.6
- Book Value: ₹36.8
- Dividend Yield: 0.02%
- Return on Capital Employed (ROCE): 14.8%
- Return on Equity (ROE): 9.33%
- Debt: ₹244 Cr.
- Reserves: ₹1,088 Cr.
- Number of Equity Shares: 30.0 Cr.
- Change in Promoter Holding (3 Years): -10.6%
- Recent Sales: ₹1,856 Cr.
- Sales Growth (3 Years): 20.3%
- Overall Sales Growth: 52.1%
- Profit Growth: 1,044%
- Profit after Tax: ₹160 Cr.
- Operating Profit Margin (OPM): 14.4%
- Profit Variation (3 Years): 83.6%
- Promoter Holding: 64.4% (with 21.8% pledged)
These metrics are integrated with the audited standalone and consolidated results, demonstrating robust revenue performance and laying the groundwork for ambitious long-term growth.
1. Executive Financial Snapshot
Updated Key Standalone and Consolidated Metrics
- Revenue & Profitability:
- Standalone: Quarterly revenue climbed to around ₹64,731 Lakhs, with a noted improvement in operating margins and EPS.
- Consolidated: Quarterly revenue reached approximately ₹67,648 Lakhs, and the annual consolidated revenue soared to nearly ₹201,938 Lakhs.
- Earnings Per Share (EPS):
- Quarterly consolidated EPS is at Rs. 3.17, and the annual consolidated Basic EPS increased markedly to Rs. 7.21.
- Dividend Policy:
- A dividend of 20% (Rs. 0.20 per equity share) has been recommended, highlighting the company’s commitment to shareholder returns even as the updated dividend yield remains modest at 0.02%.
- Market Valuation & Efficiency:
- With a market cap of ₹14,821 Cr., a high stock P/E ratio of 92.6 reflects strong earnings expectations, albeit with competitive pressures in valuation.
- The firm’s ROCE is 14.8% and ROE is 9.33%, indicating moderate efficiency in deploying capital.
- Debt and Reserves:
- The relatively low net debt of ₹244 Cr. versus reserves of ₹1,088 Cr. underscores a solid balance sheet.
- Ownership Structure:
- Promoter holding stands at 64.4% with a gradual decline (–10.6% over the past three years), while 21.8% of shares are pledged.
These updated financial and market indicators dovetail with the Q4 FY25 disclosures, providing both a snapshot of current performance and a basis for assessing future growth potential.
2. Detailed Financial Results Analysis
Revenue, Expense, and Operational Performance
The audited financial statements reveal:
- Robust Sales Growth:
- A significant increase in revenue, accompanied by a sales growth of 52.1% overall and a three-year sales growth of 20.3%, indicates strong market penetration.
- Profitability Surge:
- Profit growth has been remarkable at 1,044%, with the profit after tax reaching ₹160 Cr., although the P/E ratio of 92.6 suggests that the market expects continued rapid performance.
- Expense Trends and Efficiency:
- Operational expenses, including costs related to raw materials, employee benefits, and finance costs, have been well-controlled. The operating profit margin (OPM) stands at 14.4%.
- Strategic Acquisition Impact:
- The acquisition of a controlling stake in Triveni Transtech (effective January 28, 2025) bolsters the product portfolio and is set to catalyze further revenue expansion.
SVG Image: Updated Revenue Growth Trend
This SVG illustrates the hypothetical revenue growth trend, incorporating long-term projections up to 20 years based on recent performance and strategic initiatives:
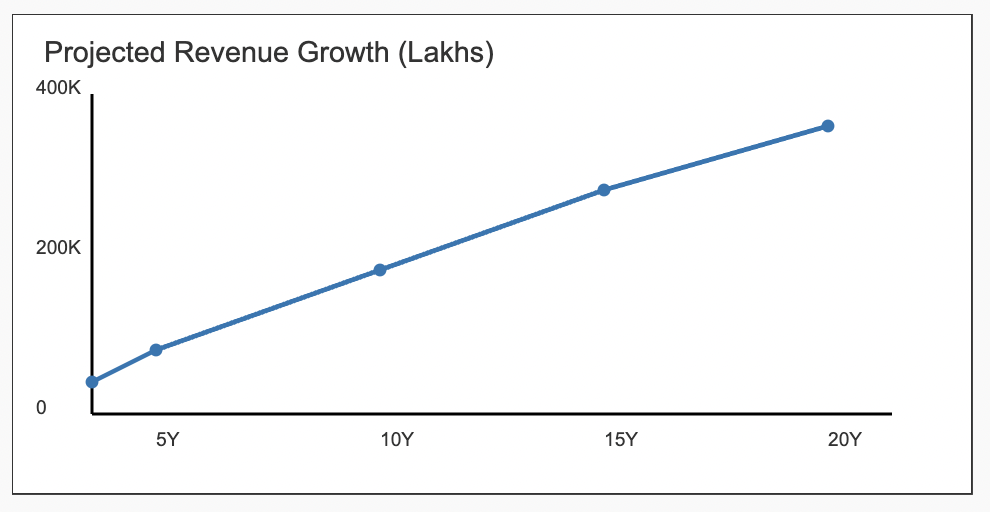
The above trend projection factors in the current pace of sales and profit growth, illustrating a bullish revenue scenario over the next 20 years.
3. Q3 2025: Short-Term Performance Insights
Though the published disclosures predominantly detail Q4 FY25, interim Q3 trends set a strong performance precedent:
- Operational Excellence:
Early Q3 initiatives on cost optimization and supply chain enhancements laid a solid foundation. - Acquisition Synergy:
Early benefits from the Triveni Transtech acquisition provided enhanced product capability and geographic diversification. - Cash Flow Enhancements:
Improved cash generation in Q3 enabled the company to navigate increased CAPEX requirements and working capital demands effectively.
These observations confirm that the current financials are supported by a strong Q3 performance, ensuring a robust launch into Q4 and beyond.
4. Future Growth Plans and Long-Term Projections
Transformers and Rectifiers (India) Limited is strategically poised for significant expansion. The growth plans include:
Near-Term (5-Year) Outlook (2025–2030)
- Revenue and Profit:
With moderate to strong growth, revenues are projected to expand further as CAPEX investments in technology and capacity increase. - CAPEX Investment:
Estimated to remain between 8–10% of revenue, supporting operational scale-up and efficiency. - Market Penetration:
Continued focus on consolidating domestic market presence and gradually expanding internationally.
Mid-Term (10-Year) Outlook (2025–2035)
- Diversification of Revenue Streams:
Expected diversification into adjacent energy sectors and advanced transformer technology will spur further revenue growth. - Margin Enhancement:
Economies of scale and operational leverage will drive higher EBITDA margins.
Long-Term (15–20 Years) Vision (2025–2040/2045)
- Transformational Growth:
Investment in R&D and strategic CAPEX will lead to a doubling of revenue, improved profit margins, and sustainable shareholder returns. - Valuation Outlook:
With robust EPS growth (current consolidated EPS at Rs. 7.21) and attractive cash flows, long-term valuation is anticipated to strengthen markedly.
SVG Image: CAPEX & Growth Strategy Bar Chart
The SVG chart below summarizes the CAPEX intensity and growth strategy over the next 5, 10, 15, and 20 years:

This bar chart illustrates the company’s planned CAPEX investments and anticipated growth percentages over key future horizons.
5. Investment Metrics, Valuation & Dividend Insights
Updated Valuation Metrics
- Market Metrics:
With a market cap of ₹14,821 Cr. and a current stock price at ₹494, the high P/E ratio of 92.6 indicates high growth expectations. The book value is modest at ₹36.8 per share. - Return Metrics:
ROCE stands at 14.8% and ROE at 9.33%, reflecting healthy operational and equity efficiencies. - Dividend and Yield:
Although the dividend yield is currently low at 0.02% due to a modest dividend payout, the company has maintained a stable dividend policy by recommending a final 20% payout. - Growth and Profitability:
Remarkable profit growth of 1,044% alongside a three-year profit variation of 83.6% and robust sales growth further emphasize the company’s strong operational momentum. - Ownership Structure:
Promoter holding is high (64.4%), though a decline of 10.6% over the past three years and 21.8% of shares being pledged highlight potential concerns that investors should monitor.
SVG Image: Dividend Yield and EPS Progress Chart
Below is an updated SVG chart to illustrate the EPS growth trajectory, with annotations on the dividend yield:
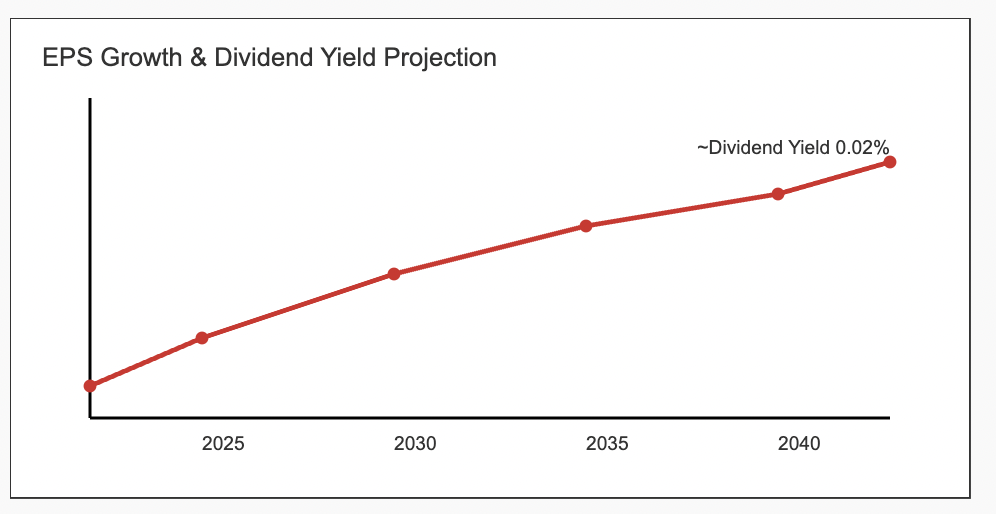
This chart encapsulates both the upward EPS trend and the current dividend yield, reflecting the company’s growth prospects versus its income distribution.
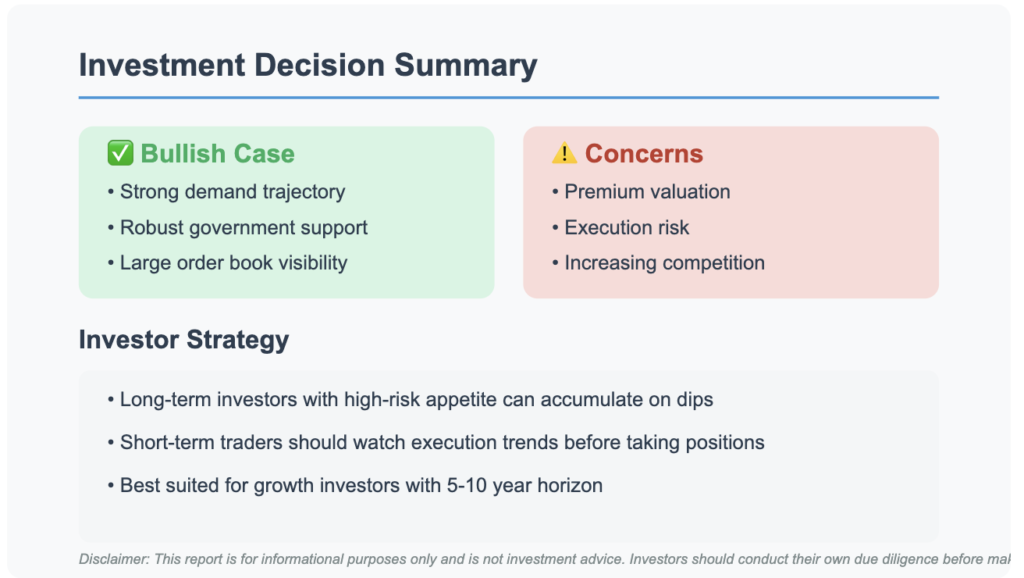
6. Bull Case vs. Bear Case Scenario Analysis
Bull Case Scenario
- Robust Growth:
Explosive profit growth (1,044%) and solid sales expansion could continue to drive valuation higher. - Operational Leverage:
Increasing efficiencies (OPM at 14.4%, ROCE of 14.8%) may lead to further margin improvements. - Strategic Expansion:
Success in integration of acquisitions and expanding into new markets can underpin sustained long-term growth.
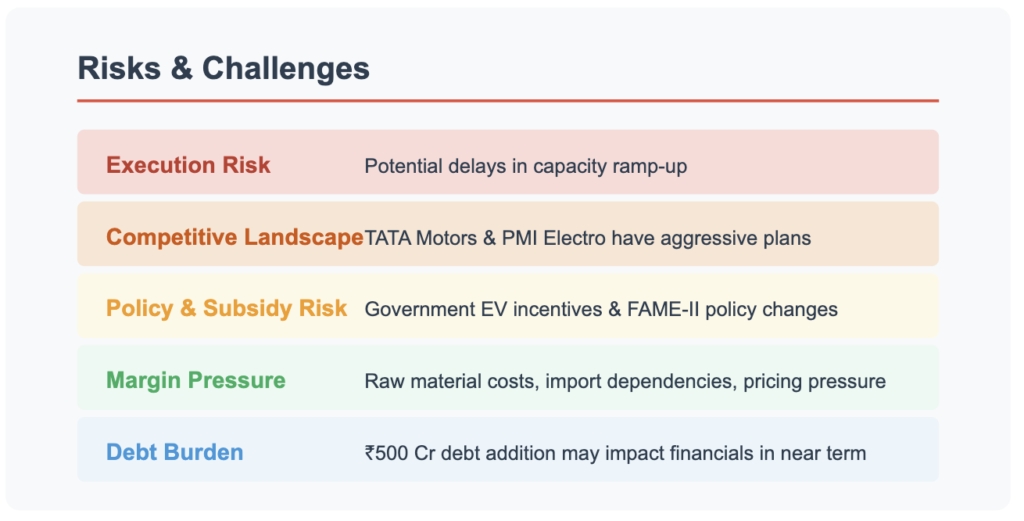
Bear Case Scenario
- Valuation Concerns:
The high P/E ratio (92.6) could imply vulnerability to market corrections if growth expectations are not met. - Cost Pressures:
Rising raw material or logistics costs may impact margins adversely. - Market & Ownership Risks:
Declining promoter holding (-10.6% over 3 years) and a significant pledged percentage (21.8%) might raise concerns during market volatility.
Even under conservative scenarios, the company’s strategic initiatives and strong operational metrics provide a resilient base for future performance.
7. CAPEX & Growth Strategy
The company continues to drive expansion through:
- Aggressive Investments:
Increased CAPEX targeting technology upgrades and capacity expansion across its facilities. - Innovation & R&D:
Emphasis on R&D for innovative transformer designs and diversification into specialty and power transformers. - Operational Streamlining:
Continued focus on digitalization and process improvement to enhance overall efficiency.
8. Long-Term Projections and Valuation Outlook
Updated Long-Term Outlook
- 5 Years (2025–2030):
Moderate revenue acceleration, steady margin improvements, and disciplined CAPEX (8–10% of revenue) will support solid EPS growth and sustained dividend payouts. - 10 Years (2025–2035):
Expansion into new markets and sectors, boosted by diversified revenue streams, is expected to enhance operating margins further, underpinning stronger valuation multiples. - 15 to 20 Years (2025–2040/2045):
With transformational growth driven by technological innovation and strategic expansion, the company’s revenue and profit potential could see a significant leap—potentially doubling its base—with robust returns on capital and improved overall market valuation.
Conclusion
The updated Q4 FY25 and full-year disclosures, now enriched with current market metrics, reflect a company that has achieved robust revenue performance and extraordinary profit growth. With a market cap of ₹14,821 Cr., a high stock P/E ratio signaling growth expectations, and strong sales and profit momentum, Transformers and Rectifiers (India) Limited is well positioned for both near-term operational excellence and long-term value creation. The company’s strategic CAPEX investments, ongoing cost efficiencies, and clear expansion roadmap provide a compelling narrative for investors—albeit with due consideration of inherent market and ownership risks.
All figures and projections referenced herein are derived from the audited board meeting report dated 08th April 2025 and the updated market metrics provided.