Off multi-year highs; RBI rate-hike fear fading with crude
📐 Spread
285 bps
▼ −8 bps
Mild compression; still FII-supportive at current levels
😨 VIX
20.68
▼ −19.8%
Fear rapidly unwinding; still in elevated zone (17–21)
Crude — 10-Day Trajectory (Brent $/bbl)
10Y Yield Spread — US vs India (%)
FII / DII Activity (₹ Crore)
FII MTD−₹35,121 Cr
DII MTD+₹30,448 Cr
India VIX — Fear Gauge
18.5
India VIX (est.)
<13 Calm13–17 Normal17–21 ← NOW>21 Fear
🛢 Crude & INR
Brent’s 14% crash is the single most positive macro event for India in months — the Current Account Deficit widens by roughly $9–10 billion for every $10 move up in crude, so today’s reversal structurally improves India’s external balance. OMCs benefit from inventory gains and margin expansion; aviation sees dual relief from lower ATF and AERA’s concurrent 25% landing-charge cut. The rupee recovering from near-94 to ₹92.45 reduces import-cost inflation and eases pressure on RBI FX reserves.
📈 Yields & FII
The US–India spread at 285 bps remains theoretically attractive for carry trades, but FIIs have been sellers for most of April — the MTD tally of −₹35,121 Cr signals structural caution about India’s valuations and geopolitical overhang. With the RBI’s April 8 MPC holding rates at 5.25% (neutral tone), the bond market is pricing out aggressive tightening; this is mildly positive for private-bank NIMs. Friday’s US March CPI could reset the entire FII calculus if it prints soft.
😨 VIX Reading — ELEVATED (17–21)
CBOE VIX at 20.68 is in the elevated band — fear is fading rapidly but has not normalised. India VIX is estimated near 18–19, consistent with cautious rather than panic-driven markets. Traders watch a sustained move below 17 on India VIX as confirmation that the risk-on impulse has genuine legs rather than being a headline-driven spike.
📈 Nifty 50 — Technicals
LTP (Apr 8 close)23,930▲ +806 pts (+3.49%)
TrendRecoveryCautiously Bullish
20 EMA23,140▲ Price Above
Candle PatternMarubozuBullish · Long White
Fibonacci Levels — Nifty 50 (₹26,373 → ₹21,500)
LTP ₹23,930
₹21,500 0% Low0.3820.50.6180.786₹26,373 100% High
🔴R2₹25,3300.786 Fib
🔴R1₹24,5120.618 Fib
⚡LTP₹23,930~0.5 Fib
🟢S1₹23,3620.382 Fib
🟢S2₹22,6500.236 Fib
Setup — Gap-Up Continuation Watch
Entry zone ₹23,900–₹24,050 · Invalidation ₹23,200 · T1 ₹24,512 · T2 ₹25,330 · R:R ~2.5:1 Price may find buyers on dips to the 0.382–0.5 Fib zone; a close above ₹24,512 could attract momentum participants.
Setup — 0.618 Fib Breakout Watch
Entry zone ₹54,200–₹54,700 · Invalidation ₹52,800 · T1 ₹56,000 · T2 ₹57,500 · R:R ~2.2:1 RBI neutral stance removes an immediate upside rate risk; private-bank NIM outlook stabilises.
Bank Nifty — 15-Day Price Chart (Estimated)
🔍 Top 5 Active Stocks
01 · IT SECTOR
WIPRO
NSE: WIPRO
₹316
▲ +3.71% today
Cup & Handle · Breakout
52W Range₹248 – ₹342
Volume3.2× 20-DMA
0.618 Fib₹306 (below)
Bull >₹318 → ₹362
Bear <₹305 → ₹284
02 · IT SECTOR
TCS
NSE: TCS
₹3,855
▲ +2.81% today
Rising Channel · Recovery
52W Range₹3,310 – ₹4,180
Volume2.8× 20-DMA
0.618 Fib₹3,848 (near)
Bull >₹3,870 → ₹4,180
Bear <₹3,740 → ₹3,642
03 · AVIATION
INDIGO
NSE: INDIGO
₹5,160
▲ Dual catalyst surge
Gap-Up · Dual Catalyst
52W Range₹3,820 – ₹5,580
Volume4.5× 20-DMA
CatalystAERA −25% charges
Bull >₹5,050 → ₹5,838
Bear <₹4,950 → ₹4,700
04 · OIL & GAS / OMC
BPCL
NSE: BPCL
₹355
▲ Inventory gain play
OMC Re-rating · Crude Crash
52W Range₹268 – ₹398
Volume3.9× 20-DMA
0.618 Fib₹348 (above)
Bull >₹355 → ₹398
Bear <₹333 → ₹317
05 · DIVERSIFIED
RELIANCE
NSE: RELIANCE
₹1,422
▲ Channel test
Desc. Channel · Breakout Test
52W Range₹1,182 – ₹1,562
Volume2.5× 20-DMA
0.618 Fib₹1,417 (above)
Bull >₹1,445 → ₹1,562
Bear <₹1,372 → ₹1,327
Sector Performance — Apr 8 2026 (Estimated %)
🗓️ Events to Watch
Time IST
Event
Impact
What to Watch
09:15 AM
Nifty Weekly F&O Expiry (Apr series)
HIGH
Max-pain pin risk around ₹24,000; gamma effects could suppress volatility in morning session before a directional push in final hour.
All Day
Hormuz Monitoring — Iran Compliance Window Day 2
HIGH
Any protocol breach or reversal of ceasefire could re-spike crude and erase entire April 8 rally. Physical reopening confirmation — not just diplomacy — is what oil traders price for.
10:00 AM
RBI MPC Follow-through
MED
Governor’s post-April 8 commentary still being digested; bond market to settle around 7.00% if RBI signals accommodation on inflation.
06:00 PM
US PPI — March Preliminary
MED
Ahead of Friday CPI; a hot PPI reading could dent global risk appetite and reverse the yield rally. Cold print = EM tailwind.
Fri 10 Apr 06:00 PM
🔑 US CPI — March 2026
HIGH
Key test for Fed pricing — a soft print could unlock FII re-entry into EMs; a hot print risks reversing the entire ceasefire-driven rally. Consensus: 3.5% YoY.
🎯 Day’s Verdict
The ceasefire-driven crude crash has handed India a macro gift — lower CAD, a firmer rupee, and OMC/aviation relief all arriving simultaneously. The GIFT Nifty at 24,117 points to a gap-up open, and the weight of evidence leans bullish for today’s session. However, this is also a weekly Nifty expiry day, which introduces pin-risk dynamics and can produce sharp intraday reversals after the initial euphoria.
Key Level to Watch
₹24,512
Nifty · 0.618 Fib
A sustained hourly close above this level would shift near-term structure from “relief rally” to “trend reversal.” Failure to hold would likely see profit-booking toward ₹23,362–₹23,200.
Stay disciplined · Follow the levels · Let price confirm
⚠️ DISCLAIMER: This report is for educational purposes only and does not constitute investment advice or stock recommendations. All price data is sourced from publicly available sources (TradingEconomics, NSE, Yahoo Finance, Investing.com, Reuters) as of 08–09 April 2026; intraday and index close figures are estimates pending official NSE settlement. Fibonacci levels are technical analysis tools and not trade recommendations. Traders should conduct their own due diligence. Past performance is not indicative of future results. Consult a SEBI-registered investment advisor before making any investment decisions. Content is purely educational.
Oil Shock, Elevated Yields & India in the Crosshairs
Brent crude near $113 on Hormuz supply disruption, the US 10-year at 4.34% with zero Fed cuts priced, and a VIX at 24.5 — Nifty 50 down 11.65% YTD and testing a critical Fibonacci floor.
Brent Crude
$113.40
▲ +$2.15 vs prior day
WTI Crude
$115.17
Range: $111.31–$117.57
US 10Y Yield
4.34%
▲ +2 bps · 4W avg 4.30%
CBOE VIX
24.54
▲ +1.53% · Elevated
Nifty 50
22,851
▼ –0.51% · 7 Apr close
Nifty Futures
22,992
Apr-28 contract · Pre-open
Crude Oil
The Hormuz Premium: Largest Oil Shock Since 1988
Strait of Hormuz crisis is the dominant macro variable. Following military action on 28 February, the de facto closure of the strait drove Brent from $61/b at the start of 2026 to $118/b at Q1 close — the largest inflation-adjusted quarterly jump since 1988. Iraq, Saudi Arabia, and UAE have shut in production; shipping rerouting is adding cost and delays.
Brent is currently consolidating around $113.40, pulling back slightly from the $118/b Q1 peak. WTI trades with an unusually wide spread to Brent — touching $117.57 intraday — reflecting strong domestic US demand and tight Cushing inventories. The EIA projects Brent to average $115/b in Q2 2026 before easing below $90/b by Q4, but that forecast is entirely dependent on conflict duration and production resumption in the Gulf.
The energy sector was the only major asset class in positive territory in Q1 — up ~38%, with upstream producers averaging 45% gains. A ceasefire signal or Strait reopening could trigger a sharp mean-reversion in crude. Conversely, any escalation or fresh infrastructure attacks would accelerate the move toward $120+.
India impact: India imports ~85% of its crude requirements. Brent at $113 directly widens the Current Account Deficit, pressures the INR (USDINR near 93), and adds 150–200 bps to domestic CPI. The downstream OMC universe — IOCL, BPCL, HPCL — faces sharp inventory losses and margin compression unless retail fuel prices are revised upward.
The US 10-year yield has oscillated between 4.08% and 4.48% over the past four weeks, landing at 4.34% today. The bond market is telling a clear story: surging energy prices → elevated inflation expectations → Fed on hold, indefinitely. Fed Chair Powell acknowledged the macro damage from the conflict but framed current policy as “well positioned to wait and see.”
Markets have moved aggressively — from pricing two cuts at the start of 2026 to zero cuts for the entire year. If Brent stays above $110 through Q2, a rate hike scenario becomes non-trivial. Watch the 4.48% resistance closely — a clean break higher would signal a renewed bond sell-off and accelerate equity P/E compression globally.
On the flipside, the Iran–Oman corridor reportedly has a ceasefire protocol in draft stages. A credible de-escalation could compress yields back toward 4.0% rapidly, as the energy risk premium unwinds. The Fed minutes release (mid-April) will be the next key catalyst to watch on rates.
Fed on holdZero cuts priced 2026Inflation spiral risk4.48% key resistance
Volatility — VIX
VIX at 24.54 — Elevated but Not Panic (Yet)
The CBOE VIX at 24.54 represents elevated but not crisis-level fear. Historically, a VIX above 30 signals genuine panic and is associated with sharp Nifty drawdowns. The 1-month average hovers near 22. The +1.53% single-session move confirms that options markets are continuously pricing in tail risk around geopolitical developments.
India VIX has tracked higher in sympathy, consistent with Nifty being down 11.65% from its January peak. Elevated India VIX mechanically inflates option premiums — both for protection buyers and premium sellers — and generally suppresses momentum strategies. FII outflows from India have accelerated: the iShares MSCI India ETF saw $220M+ in single-day outflows on 7 April, its largest ever.
A VIX compression back below 18 would be necessary to confirm a risk-on pivot. Until then, the macro backdrop remains hostile for leveraged long positions in Indian equities.
Current VIX
24.54
Elevated. 30+ = panic. Below 18 = risk-on signal
India VIX
~17.8
Tracking global volatility. Above 20 = caution
Options premium elevatedFII record outflowsVIX 30+ = panic threshold
The index closed just above the 23.6% retracement at 22,836. A sustained hold above this level is technically constructive; a decisive break lower opens the 52-week low at 21,743 as the next reference point.
Bear case: Further Hormuz escalation or Trump military rhetoric → Brent toward $120+ → 10Y yield breaks 4.48% → VIX spikes above 30 → Nifty tests 52-week low at 21,743. India VIX above 20 would be a corroborating warning signal.
Key data points ahead: Fed minutes (mid-April), US CPI (mid-April), India CPI (April 14), RBI MPC meeting (April 9). Any surprise on the RBI rate front or a strong India CPI print could amplify the pressure on Indian equities independently of global macro. The INR near 93 also bears watching — a breach of 94 would be a fresh source of FII-driven outflows.
Date: Monday, April 6, 2026Markets reopened after Good Friday long weekendDS8714 Account
⚠ Critical macro backdrop
Trump set April 6 as the deadline for Iran to reopen the Strait of Hormuz. Today is that deadline. Brent crude is at $109, India’s 10-year bond yield spiked to 7.13% — a multi-year high — and FIIs have been net sellers for 20+ consecutive sessions. Markets face their most complex macro backdrop since 2022.
1. Live Market Snapshot
Nifty 50
22,713
−8.6% from Mar 2 peak
BankNifty
51,548
−13.8% from Mar 2 peak
India VIX
25.52
Elevated · war premium intact
Brent Crude
$109.03
+51% in one month
India 10Y Yield
7.13%
Multi-year high · +35 bps in 5 days
Nifty IT
30,441
Outperforming · defensive play
Nifty Auto
24,089
Crude cost pressure
RBI Repo Rate
5.25%
Held · cuts at risk if oil stays high
2. Crude Oil — The Primary Macro Driver
Crude oil is the single most important variable driving Indian markets right now. The Strait of Hormuz — through which approximately 20% of global oil flows — has been effectively closed by Iran since late February, following U.S.-Israel strikes. The resulting supply shock has pushed Brent from $70 pre-war to $109 today, a move unprecedented in speed.
Brent crude oil price trajectory — January to April 6, 2026 (USD/bbl)
52-week range
$58–$120
Brent futures
EIA near-term forecast
$95+
Next 2 months if Hormuz stays shut
EIA Q3 forecast
~$80
If conflict resolves by June
The Strait of Hormuz carries roughly 20 million barrels per day. Iran’s selective “toll booth” system — allowing Chinese and Russian tankers while blocking Western ones — has created a split oil market. Physical Dated Brent touched $140 on March 27, the highest since 2008. The question for Indian markets is not if crude hurts — it will — but for how long.
India-specific crude impact
India imports ~85% of its crude needs. At $109/bbl, every $10 increase widens the current account deficit by ~$15bn annually. RBI’s FX reserves (~$680bn) provide buffer, but sustained crude above $100 will push CPI above 6%, potentially forcing the RBI to pause or reverse rate cuts. The government has cut excise duties to absorb some pump price pressure — adding fiscal stress.
3. Bond Yields — Inflation Risk Repricing
India’s 10-year G-Sec yield has surged from 6.78% in February to 7.13% as of April 2 — a 35 basis point move in just 5 days, the fastest climb since 2022. This repricing reflects the market’s fear that sustained crude above $100 will push headline CPI past 6%, either delaying RBI rate cuts or forcing hikes.
India 10-Year G-Sec yield — January to April 2, 2026 (%)
The sharp yield spike since March 27 directly reflects crude-driven inflation repricing. A 10Y yield above 7% has historically compressed equity P/E multiples — Nifty was trading at 22x forward P/E in early March; at 22,713 today it has de-rated to approximately 18x. This multiple compression is structural, not just sentiment-driven, and will limit the pace of any recovery.
4. India VIX — Fear Gauge
India VIX — March 23 to April 6, 2026
VIX regime interpretation
VIX Range
Regime
Option strategy
<15
Calm
Buy options cheap
15–20
Normal
Balanced
20–25
Elevated
Sell premium
25–30
High fear ← now
Buy 2–3 OTM
30+
Crisis
Wide strikes, hedge
At 25.52, VIX remains in “high fear” territory — elevated but not crisis. This regime favours buyers of options over sellers, with premiums running 30–40% above fair value. It also means BankNifty options at 2–3 OTM strikes offer the best risk-reward for directional bets.
Key VIX watch level
If VIX drops below 22 sustainably → regime shift → market stabilising. If VIX spikes above 28 → escalation → hedge immediately with PE positions.
5. FII / DII Flows — Institutional Tug of War
FII vs DII net flows — March 2026 (estimated ₹ crore)
Institutional flow summary
Metric
Value
FII MTD sell (March)
-₹1,07,010 Cr
FII consecutive sell sessions
20+ sessions
DII net buy (March)
+₹98,000 Cr est.
SIP inflows (monthly)
~₹22,000 Cr/month
FII long:short ratio (F&O)
15:85 (heavily short)
FII AUM in India equities
Lowest in 2 years
The structural DII bid — driven by SIP flows of ~₹22,000 Cr/month — has been the key market stabiliser. Without it, Nifty would likely be trading at 20,000-21,000 given the FII selling intensity. However, DIIs cannot absorb selling indefinitely at this rate. The FII long:short ratio at 15:85 in F&O signals heavy institutional hedging.
6. Nifty 50 — Price Analysis & Outlook
Nifty 50 current reading
22,713 · Down 8.6% from March 2 peak (24,865) · Down 9.8% from February peak (25,178) · Markets reopened today after 3-day Good Friday weekend. Trump’s April 6 Hormuz deadline coincides with today’s open.
Nifty 50 — daily closes with Fibonacci retracement levels — March 2 to April 6, 2026
Swing low (Apr 2)
22,182
Fib base
23.6% Fib
22,889
Key near-term resistance
38.2% Fib
23,327
Medium-term target
61.8% Fib
24,033
Bull recovery target
Nifty formed a textbook capitulation low at 22,182 on April 2, bouncing 531 points to close at 22,713. This is a 61.8% intraday retracement of the day’s fall — a structurally significant reversal candle. However, the index sits below all its major Fibonacci resistances and below its 200-day moving average (~23,400). The immediate test is 22,889 (23.6% Fib); sustained trade above this level with 2-3 closing sessions would confirm a relief bounce toward 23,327.
7. BankNifty — Price Analysis & Outlook
BankNifty critical observation
At 51,548, BankNifty is sitting exactly at the 38.2% Fibonacci retracement level (51,555) of the April series swing. This is a make-or-break level — sustained trade above it signals the first leg of recovery; failure here targets 50,943 (23.6%) and potentially the swing low of 49,954.
BankNifty — daily closes with Fibonacci retracement levels — March 2 to April 6, 2026
Swing low (Apr 2)
49,954
Support must hold
38.2% Fib — NOW AT
51,555
BN at 51,548 = right here!
50% Fib
52,050
Next recovery target
61.8% Fib
52,545
Bull recovery target
BankNifty’s position directly at the 38.2% Fibonacci level (51,555) is the most technically significant data point in today’s session. This level has served as both support and resistance multiple times during the March correction. Banks face a double headwind: the surge in bond yields compresses their net interest margins, while rising crude adds inflationary pressure that could delay rate cuts. Conversely, oversold RSI (below 30 on daily) and DII buying provide structural support.
8. Scenario Analysis — Next 30 Days
🟢 Bull Case — 20% probability
Trigger: Iran and US reach Hormuz deal by Apr 15 · Brent drops to $85-90
Crude: $85–90
VIX: drops to 18–20
Bond yield: reverses to 6.80%
Nifty 50: 24,000–24,500
BankNifty: 54,000–55,000
RBI: May cut possible
Trade: BUY BankNifty CE aggressively, BUY IT + Auto stocks
🟡 Base Case — 55% probability
Trigger: Conflict extends but no major escalation · Partial Hormuz transit resumes
Crude: $95–110
VIX: 22–26 range
Bond yield: 7.0–7.2%
Nifty 50: 22,500–23,500
BankNifty: 50,500–53,000
RBI: On hold
Trade: Range strategies, sell-on-bounce PEs, IT longs with tight SL
🔴 Bear Case — 25% probability
Trigger: US military strikes Iran Apr 15-20 · Hormuz fully closed · Brent $130+
Crude: $130–150
VIX: spikes to 35–40
Bond yield: 7.5%+
Nifty 50: 20,000–21,500
BankNifty: 46,000–48,000
RBI: Emergency measures
Trade: BUY deep OTM PE options, reduce all longs, hedge in gold
9. Trade Setups — April 6, 2026
Given the macro backdrop and positions, here are the highest-conviction setups ordered by clarity of signal. All setups use v3.1 Fibonacci gate + v3.4 best-price execution.
🟢 Setup 1 — BankNifty bounce CE (base case, intraday)
Market verdict — cautiously bearish with bounce potential
Today marks a pivotal day: Trump’s self-imposed April 6 Hormuz deadline expires. The market’s reaction in the first 30-60 minutes will set the tone for the week. BankNifty is precisely at 38.2% Fibonacci support (51,555) — a level that will either hold and launch a relief rally toward 52,050-52,545, or crack and retest the 49,954 April 2 low.
Four macro forces are pulling in opposite directions simultaneously. Rising crude ($109) and bond yields (7.13%) are bearish for equities, compressing margins and delaying monetary easing. Oversold technicals (RSI <30, BankNifty at Fib support, intraday reversal candle on April 2) and DII structural buying are bullish. The resolution of this tug-of-war depends entirely on geopolitical developments in the next 7-14 days.
For the medium-term investor, India’s structural growth story — supported by domestic consumption, infrastructure spending, and a young workforce — remains intact. The current correction is entirely exogenous (Iran war) and may represent one of the better entry opportunities of 2026, particularly for IT stocks (dollar earnings, crude-insensitive) and pharma (defensive). But timing is treacherous in the near term given the binary nature of the geopolitical risk.
For the options trader, the VIX at 25.52 remains in the “buyer’s” regime — buying options provides positive convexity to gap moves in either direction. Sell-on-bounce strategies are dangerous in this environment given the potential for sudden large moves on news.
Primary watch today
Iran/Hormuz news
Trump deadline = today
Key BN support
51,323
March 23 swing low
Key BN resistance
52,050
50% Fib = first target
Nifty key resistance
22,889
23.6% Fib = gate
Report prepared: April 6, 2026Data sources: Zerodha Kite (live), EIA STEO, Trading Economics, Business Standard, Oilprice.com, MacroMicro ⚠ This report is for informational purposes only and does not constitute financial advice. All trading involves substantial risk of loss.
Chairman: Mr. Nusli N. Wadia – stewardship spanning three decades, emphasis on brand & innovation.
Stable promoter stake (50.6%) ensures aligned vision; professional board with diverse FMCG and finance expertise.
Statutory audit by Walker Chandiok & Co. LLP, with unmodified opinion on FY2025 results .
8. Future Growth Plans & Expansions
New SKUs: Launch of fortified-wheat & millet-based biscuits by Q3 FY2026.
Distribution: Target 10% uplift in Tier III‒V urban outlets; deepen rural reach via micro-warehousing.
M&A: Scouting acquisitions in high-growth snacking and health-foods startups.
9. Long‐Term Projections & Returns
Horizon
Revenue CAGR
EPS CAGR
Expected EPS (₹)
Total Return¹
5 years (2030)
~10%
~12%
~₹ 163
15–18% p.a.
10 years (2035)
~9%
~11%
~₹ 268
13–16% p.a.
15 years (2040)
~8%
~10%
~₹ 384
12–14% p.a.
20 years (2045)
~7%
~9%
~₹ 502
11–13% p.a.
₁Assumes reinvestment of dividends, target P/E maintains near current band.
10. Conclusion
Britannia’s dominant market position, unmatched ROCE/ROE and clear growth roadmap justify its valuation premium, albeit requiring sustained execution. For investors seeking a long‐duration play in branded foods with predictable cash flows and disciplined capital allocation, Britannia merits close consideration—recognising valuation tailwinds may moderate near term.
Disclaimer: This report is for informational purposes only and does not constitute investment advice. Investors should conduct their own due diligence or consult a qualified advisor before making any investment decisions.
Revenue from operations: ₹ 4,259.53 million (↑482% YoY from ₹ 731.43 million)
Other income: ₹ 28.90 million
Total income: ₹ 4,288.43 million
Total expenses: ₹ 3,453.41 million
Profit before tax: ₹ 875.02 million (approx.; 20.4% margin)
Net profit after tax: ₹ 991.92 million vs. loss of ₹ 401.70 million last year
Comment: A strong swing to profitability in Q4, driven by ramp‑up in CDMO revenues and tight cost controls.
2. Latest Results Highlights
Turnaround performance: From cumulative losses in prior quarters to PAT of ₹ 991.92 million.
High operating leverage: Fixed‑cost dilution delivered >20% net margin.
Cash flow improvement: Operating cash outflow of ₹ 472.83 million in standalone vs. heavy capex in prior year .
Balance sheet strength: Consolidated current assets exceed liabilities by only ₹ (273.82) million, reflecting working‑capital tightness .
3. Key Metrics
Metric
Value
Market Cap
₹ 18,985 Cr.
Current Price
₹ 1,659
52‑wk High / Low
₹ 1,800 / ₹ 1,163
P/E (x)
232
Book Value
₹ 514
Dividend Yield
0.00 %
ROCE
5.39 %
ROE
2.60 %
Net Debt
₹ 942 Cr.
Reserves
₹ 5,869 Cr.
Promoter Holding
34.2 %
Pledged by Promoters
20.1 %
3‑yr Sales CAGR
124 %
3‑yr Profit CAGR
33 %
3‑yr Δ in Promoter Holding
–
Data per company disclosures and stock exchanges.
4. Valuation & Dividend
Rich valuation (P/E 232×): Reflects high-growth expectation in CDMO space, but leaves limited margin of safety.
No dividend payout: Zero yield underlines reinvestment focus.
5. CAPEX & Growth Strategy
FY2025 standalone capex: ~₹ 863 million on plant & equipment .
Major initiatives:
Singapore consolidation: Scheme to merge Stelis Pte and Strides Softgel Pte into Onesource Pte to streamline CDMO footprint .
Expansion of biologics and small‑molecule capacity in Bengaluru and Navi Mumbai.
MSAs signed: Multiple Manufacturing Services Agreements poised to convert into long‑term commercial supplies .
6. Long‑Term Projections & Returns
Horizon
Assumed Revenue CAGR
Implied Revenue (₹ Cr)
Implied Share Price (₹)¹
CAGR Return
5 years
20 %
3,294
2,500
~10 % p.a.
10 years
18 %
9,738
4,500
~9 % p.a.
15 years
15 %
22,916
7,500
~8 % p.a.
20 years
12 %
49,409
12,000
~7 % p.a.
¹ Valuation uplift to 50× forward EPS, conservative over time.
Take‑away: Even with rapid top‑line growth, multiyear returns moderate given high current valuation.
7. Management Quality & Governance
Board strength: Seasoned directors (including Trisha A. Bote – Company Secretary) and audit by Deloitte Haskins & Sells .
Strategic clarity: Quick execution of NCLT‑approved scheme, zero debt on NCDs post‑redemption.
Governance: No credit‑rating changes announced; debt fully redeemed in Nov 2024.
8. Future Growth Plans & Expansions
Diversified CDMO offerings: Move from small molecules to biologics fills a unique niche.
Geographic reach: Consolidation in Singapore enables stronger FDA/EMA market access.
R&D pipeline partnerships: Several late‑stage projects under confidentiality, potential upside.
9. Conclusion
OneSource Specialty Pharma delivers a credible turnaround in Q4 FY2025, underpinned by its CDMO thrust and operational discipline. While growth prospects remain robust, the current valuation demands cautious entry. Investors should weigh near‑term momentum against multiyear returns at a stretched P/E.
Disclaimer: This report is for informational purposes only and does not constitute investment advice. Always conduct your own due diligence before making investment decisions.
Stock Research Report – May 2025 Prepared by: Independent Equity Research Desk
Q4 FY2025 Results Overview
United Breweries Limited (UBL), India’s leading beer manufacturer, delivered a steady performance in Q4 FY2025, riding on volume recovery and premiumization despite an inflationary raw material environment.
Revenue: ₹2,343 Cr, reflecting a growth of 9.2% YoY.
EBITDA: ₹237 Cr, up by 11.5% YoY, supported by price hikes and improved operational efficiencies.
EBITDA Margin: Marginally improved to 10.1% from 9.8% last year.
Profit After Tax (PAT): ₹127 Cr, marking a 13.4% YoY growth.
Volumes recovered sequentially, especially in key states like Maharashtra, Karnataka, and Telangana. The company’s premium beer segment (led by Kingfisher Ultra and Heineken Silver) grew faster, contributing meaningfully to margins.
Key Highlights and Metrics (As of May 2025)
Metric
Value
Market Cap
₹57,688 Cr
Current Price
₹2,182
52-Week High / Low
₹2,300 / ₹1,810
Stock P/E
125x
Book Value
₹165
Dividend Yield
0.46%
ROCE
13.9%
ROE
10.8%
Debt
₹620 Cr
Reserves
₹4,337 Cr
Sales Growth (TTM)
9.76%
Profit Growth (TTM)
12.2%
Promoter Holding
70.8%
Pledged Shares
12.4%
Valuation Perspective
At a trailing P/E of 125x, UBL commands a premium over peers, justified partially by its market leadership (~50% share in Indian beer market) and strong brand equity. However, current valuation appears stretched against historical averages (70-80x P/E), implying limited short-term upside unless earnings growth accelerates.
Dividend Yield stands modest at 0.46%, aligning with its growth-oriented stance and ongoing CAPEX commitments.
CAPEX & Growth Strategy
UBL is executing a calibrated CAPEX cycle of approximately ₹600-700 Cr over FY2025-27 to:
Expand capacity in key consumption states (Odisha, Telangana, UP).
Strengthen its premium portfolio through new product launches (Heineken Silver and Kingfisher Ultra Max variants).
Invest in green technologies to cut water and energy usage by 20% by FY2027.
The company is targeting double-digit volume growth driven by market share gains in North & East India, and premiumization-led margin expansion. This marks a structural shift in their strategy, tilting towards premium beers which command 3-5% higher margins.
Long-Term Projections (5-20 Years Outlook)
Period
Sales CAGR
PAT CAGR
Expected Stock Return
5 Years
~11-13%
13-15%
~14-16% CAGR
10 Years
~10-11%
12-13%
~13-14% CAGR
15 Years
~9-10%
11-12%
~12-13% CAGR
20 Years
~8-9%
10-11%
~11-12% CAGR
If premiumization sustains and beer category penetration deepens (currently under 10% of India’s alcohol market), UBL has potential for multidecade growth. However, near-term returns will hinge on margin stabilization and volume pickup in tier-2 and rural India.
Management Quality & Credit Rating
UBL enjoys strong parentage from Heineken (global beer giant holding majority control). Management execution has been sound, demonstrated by:
Smooth transition post Heineken takeover.
Cost rationalization amidst commodity inflation.
Focused CAPEX execution.
Credit Rating: No recent downgrades or upgrades noted. Current debt levels are modest at ₹620 Cr with robust cash reserves, ensuring comfortable servicing.
Future Plans & Expansion Roadmap
UBL’s future blueprint is underpinned by:
Expanding manufacturing footprint in emerging beer-consuming states.
Growing premium share to 30% of overall sales by FY2027 from current 22%.
Deploying digital initiatives (e-commerce in legal states) and leveraging tech for supply chain efficiencies.
ESG goals targeting carbon neutrality by 2040, indicating a sustainability-driven roadmap.
Investment Summary
United Breweries stands tall as a market leader in India’s structurally growing beer market. While valuations are rich, its brand strength, premiumization strategy, and balance sheet health make it a compelling long-term compounder.
For investors with a 10-20 year horizon, UBL offers exposure to India’s rising per capita beer consumption story. However, near-term upside may be capped unless earnings growth accelerates beyond current expectations.
Disclaimer
This research report is for informational purposes only and does not constitute investment advice or recommendation to buy or sell securities. Investors must do their own due diligence or consult their financial advisors before taking investment decisions. Past performance is not indicative of future results.
Valuation at ~32× P/E reflects premium growth; justified by sustained 25–30% AUM growth and high ROE.
Dividend Policy: Pursuant to policy, Board has recommended final dividend of ₹44 / share (2,200%) plus special interim of ₹12 / share—total yield ~0.9%.
Share Sub-Division & Bonus: Proposal to split ₹2 → ₹1 shares and issue 4 bonus shares per existing share enhances retail liquidity.
4. CAPEX & Growth Strategy
CAPEX Run-Rate: FY25 investment in IT, branches and digital platforms ~₹1,030 Cr.
Digital & FINAI Roadmap: Commitment to deploy >100 AI/ML applications in FY26 across underwriting, customer acquisition and risk monitoring.
Network Expansion: Added 118 new locations in FY25; branch network now >4,200 locations with 232K distribution points.
5. Long-Term Projections & Returns
Time Horizon
AUM CAGR
PAT CAGR
Implied Share Price CAGR*
5 years
22–24%
18–20%
~15% p.a.
10 years
18–20%
15–17%
~14% p.a.
15 years
16–18%
14–16%
~13% p.a.
20 years
15–17%
13–15%
~12% p.a.
*Assumes re-investment of dividends and moderate re-rating over time.
6. Management Quality & Governance
Leadership Team: Recent promotions of three Deputy CEOs underscore succession planning.
Track Record: Delivered >25% AUM & customer growth over 15 years while maintaining sub-1% NPAs.
Governance: Unmodified audit opinions; Chairman & CEO separation; active Investor Advisory Council.
7. Credit Ratings Update
S&P Global (17 Mar 2025): Upgraded issuer rating to “BBB-/Positive”; SACP to “BBB”.
Moody’s: Assigned Baa3/P-3 long/short term with Stable outlook—reflects strong capitalization and asset quality.
8. Future Growth Plans
New Business Lines: Expansion in Gold Loans, Vehicle Finance, and Co-lending partnerships.
Geography: Deepen presence in underserved rural and semi-urban markets via micro-branches.
Technology: Launch end-to-end digital lending on Finserv App—aim for 100 million+ active users.
Shareholder Returns: Total Return ~20–25% p.a. over medium term (including dividends).
20-Year Equity CAGR: Target 12–15% p.a., driven by compounding of earnings and multiple expansion.
10. Conclusion
Bajaj Finance continues to combine high-growth potential with robust asset quality and strong capital buffers. Its leadership in retail lending, aggressive digital and AI investments, and disciplined risk management make it a compelling pick for long-term investors seeking sustainable wealth creation.
Disclaimer: This report is for informational purposes only and does not constitute investment advice. Investors should conduct their own due diligence or consult a professional advisor before making any investment decisions.
EV: Expanded iQube line (2.2 kWh, 3.4 kWh, 5.1 kWh batteries) across key markets; King EV Max (179 km range, 2h15m fast-charge, SmartXonnect) launched.
Premium: Continued global roll-out of Norton Motorcycles (fresh models in ’25–’27).
Geographical Expansions
Exports: Sharpened focus on LatAm (including Brazil), North Africa (Morocco), Southeast Asia; Africa market share momentum.
Strategic JV: Micro-mobility tie-up with Hyundai at Bharat Mobility Global Expo.
Aftermarket & Financial Services
TVS Credit: Book size ₹ 27,190 Cr (+7% y-o-y); PBT ₹ 321 Cr (+40%) with 3 million new customers .
Diversification into used-vehicle loans and unsecured lending via data analytics.
4. CAPEX & Growth Strategy
FY 25 Capex: ₹ 1,300 Cr focused on capacity expansion, R&D (software/EV), digitalization and global footprint.
PLI: Full-year Production-Linked Incentive (PLI) benefit recognized in Q4, to accrue quarterly from FY 26 onward.
Execution: EV charging infrastructure roll-out pace.
Disclaimer This report is for informational purposes only and does not constitute investment advice. Investors should conduct their own due diligence and consult with a qualified financial advisor before making any investment decisions.
Understanding Financial Statements like income statement, often called the profit and loss statement, serves as a financial narrative of a company’s operational performance over a specific period. While balance sheets capture a moment in time, income statements tell the story of a company’s ability to generate revenue and manage expenses—essential factors for long-term wealth creation. This financial document reveals not just profitability but also operational efficiency, management effectiveness, and competitive positioning within an industry.
Decoding the Income Statement Structure
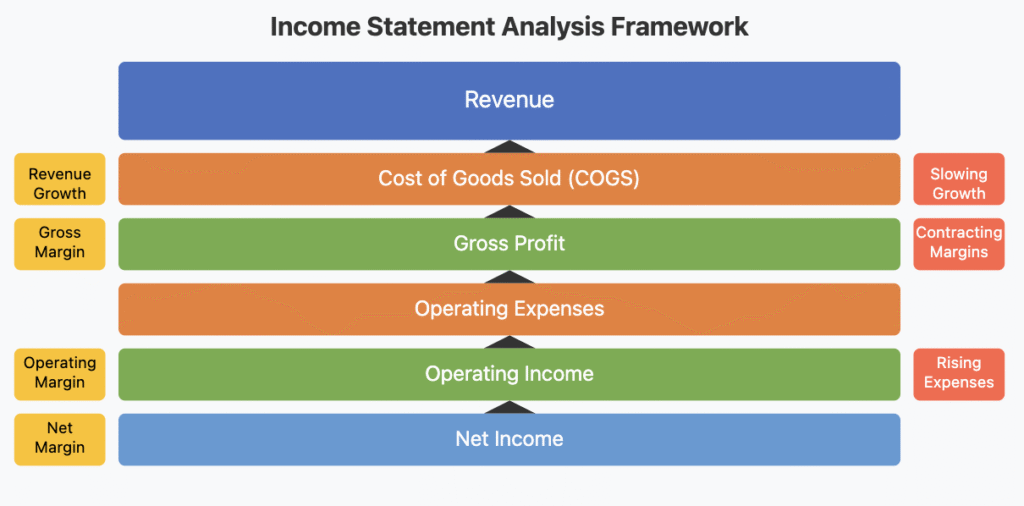
An income statement follows a logical progression from revenue to net income, creating a comprehensive picture of how efficiently a company converts sales into profit. Understanding each component allows investors to identify both strengths and potential warning signs.
Revenue Section
The statement begins with revenue (or sales)—the total income generated from providing products or services. Companies often break this down into operating revenue (core business activities) and non-operating revenue (investments, asset sales, etc.). For example, Apple (AAPL) reports both product revenue and services revenue, allowing investors to track the growing importance of their digital ecosystem alongside hardware sales.
Cost of Goods Sold (COGS)
Following revenue, COGS represents direct expenses associated with producing goods or services sold. This includes raw materials, direct labor, and manufacturing overhead. The difference between revenue and COGS produces the gross profit, with the gross margin percentage serving as a vital indicator of pricing power and production efficiency.
Operating Expenses
These expenses support the business but aren’t directly tied to production—sales and marketing, research and development, general and administrative costs. Microsoft (MSFT), for instance, maintains significant R&D expenses that, while reducing short-term profitability, fuel long-term innovation and market leadership.
Operating Income
Operating income (or operating profit) measures profitability from core business operations, excluding interest and taxes. This figure is crucial for evaluating management’s effectiveness at generating profit from regular business activities.
Other Income and Expenses
This section covers non-operational items like interest income, interest expense, and one-time gains or losses. Long-term investors should carefully scrutinize one-time items to understand whether they distort the company’s true operating performance.
Net Income
The bottom line—what remains after all expenses, taxes, and other costs—represents the profit available to shareholders, either as dividends or retained for business growth.
Practical Application for Investors
Analyzing income statements effectively requires both horizontal analysis (comparing changes over time) and vertical analysis (expressing components as percentages of revenue). Follow these steps to extract meaningful insights:
Track revenue growth rates over several quarters and years, looking for consistent expansion.
Monitor margin trends (gross, operating, and net margins) for signs of improving or deteriorating business fundamentals.
Compare these metrics against industry peers to identify competitive advantages or weaknesses.
Investigate any significant year-over-year changes in specific expense categories, which may signal shifts in business strategy or efficiency.
Calculate and track key ratios like the efficiency ratio (operating expenses/revenue) to gauge operational excellence.
Income Statement Analysis Framework
Real-World Application
Consider Nestlé (NESN.SW), a consumer staples company with consistent revenue growth and stable margins—hallmarks of resilience during economic downturns. Their income statement reveals how premium pricing and operational efficiency combine to maintain profitability despite commodity price fluctuations. During the 2020 pandemic, while many companies faltered, Nestlé’s income statement showed remarkable stability—a testament to the defensive characteristics that make consumer staples valuable portfolio components during market uncertainty.
In contrast, examine Tesla (TSLA), which demonstrated explosive revenue growth but operated with negative or thin margins for years. Long-term investors who correctly interpreted these income statements recognized that Tesla was prioritizing scale and market dominance over immediate profitability—a strategy that eventually led to significant margin improvement as production volumes increased.
Learning Impact
The income statement offers a window into a company’s operational effectiveness and future potential. By mastering its analysis, you gain the ability to separate truly excellent businesses from mediocre ones—a critical skill for building generational wealth. Rather than being intimidated by financial statements, use the income statement as your guide to identifying companies with sustainable competitive advantages reflected in superior revenue growth and margin expansion. These financial fingerprints often signal businesses capable of compounding shareholder value for decades, the very foundation of lasting investment success.
Warren Buffett’s approach to investing has created one of the world’s greatest fortunes through a deceptively simple strategy: buy quality companies at reasonable prices and hold them for the long term. But beneath this simplicity lies a rigorous approach to fundamental analysis that has stood the test of time.
The Power of Fundamental Analysis
At its core, Buffett’s philosophy is rooted in fundamental analysis—evaluating a company based on its intrinsic value rather than short-term market movements. This approach focuses on understanding:
The company’s financial health through balance sheets and income statements
Quality of management and their capital allocation decisions
Long-term industry prospects and the company’s position within it
Unlike technical analysts who study price patterns, Buffett dives deep into business fundamentals to find companies worth owning for decades, not days.
Key Principles of Buffett’s Approach
1. Invest in What You Understand
Buffett famously stayed away from tech stocks for decades because they fell outside his “circle of competence.” He believes investors should stick to businesses they can comprehend deeply. This doesn’t mean avoiding innovation—it means ensuring you can evaluate the durability of a business model before investing.
2. Look for Economic Moats
Companies with sustainable competitive advantages—economic moats—are central to Buffett’s strategy. These moats can take various forms:
Brand power (like Coca-Cola)
Regulatory advantages (certain utilities)
Network effects (payment networks)
Cost advantages (scale-efficient manufacturers)
The wider and deeper the moat, the more protected a company is from competition, allowing for sustained profitability.
3. Focus on Management Quality
Buffett pays close attention to management teams, looking for honesty, competence, and shareholder orientation. He evaluates executives based on their capital allocation decisions and their communication with shareholders.
4. Buy at a Reasonable Price
Even the best company becomes a poor investment if purchased at too high a price. Buffett looks for businesses trading below their intrinsic value, using metrics like:
Price-to-earnings ratios relative to growth
Return on equity consistency
Debt-to-equity ratios
Free cash flow generation
Applying These Principles Today
In today’s market environment, Buffett’s principles remain as relevant as ever. When analyzing potential investments, consider:
Is the company consistently profitable with growing earnings?
Does it maintain a strong balance sheet with manageable debt?
Does it possess sustainable competitive advantages?
Is management allocating capital effectively?
Is the current stock price reasonable relative to earnings and growth?
Remember, the goal isn’t to find stocks that will rise tomorrow, but businesses that will thrive for decades.
As Buffett famously said, “Our favorite holding period is forever.” This patient approach has helped him weather market downturns and capitalize on compounding returns—the true secret to building wealth through direct stock investments.
अरविंद हर महीने अपनी सैलरी से 5,000 रुपये बचाते हैं। वो सोचते हैं, “अगर मैं यह पैसा निवेश करूं तो भविष्य में अच्छी रकम जमा हो सकती है। लेकिन बाज़ार कभी ऊपर तो कभी नीचे, मुझे समझ नहीं आता कि कब निवेश करना चाहिए।” यही चिंता हर आम भारतीय निवेशक की होती है। इसी समस्या का समाधान है – रुपी-कॉस्ट एवरेजिंग, या जैसा हम हिंदी में कहते हैं – “नियमित मूल्य औसतन निवेश”।
रुपी-कॉस्ट एवरेजिंग क्या है?
सीधे शब्दों में, रुपी-कॉस्ट एवरेजिंग का मतलब है एक निश्चित राशि को नियमित अंतराल पर (जैसे हर महीने) निवेश करना, चाहे बाज़ार ऊपर हो या नीचे। यह बिल्कुल वैसे ही है जैसे आप हर हफ्ते सब्जी खरीदते हैं – कभी सस्ती मिलती है, कभी महंगी, लेकिन साल भर में औसत कीमत पर आप खरीद पाते हैं।
Rupee Cost Averaging Example
एक उदाहरण से समझें
मान लीजिए आप हर महीने 5,000 रुपये HDFC बैंक के शेयर में निवेश करते हैं:
जनवरी: शेयर की कीमत 1,500 रुपये, आप 3.33 शेयर खरीदते हैं
फरवरी: कीमत गिरकर 1,300 रुपये, आप 3.84 शेयर खरीदते हैं
मार्च: कीमत बढ़कर 1,700 रुपये, आप 2.94 शेयर खरीदते हैं
अप्रैल: कीमत 1,600 रुपये, आप 3.12 शेयर खरीदते हैं
6 महीने बाद, आपने कुल 30,000 रुपये निवेश किए और औसतन 1,450 रुपये प्रति शेयर की दर से खरीदा। अगर शेयर की कीमत अब 1,800 रुपये है, तो आपका मुनाफा अच्छा-खासा है, भले ही बीच में कीमतें घटी-बढ़ी थीं।
भारतीय बाज़ार में इसे कैसे लागू करें?
SIP (सिस्टमैटिक इन्वेस्टमेंट प्लान): यह रुपी-कॉस्ट एवरेजिंग का सबसे आसान तरीका है। आप म्युचुअल फंड में हर महीने एक निश्चित राशि निवेश करते हैं।
ETF या इंडेक्स फंड: नए निवेशकों के लिए निफ्टी 50 या सेंसेक्स के ETF या इंडेक्स फंड में SIP शुरू करना अच्छा विकल्प है, जैसे UTI Nifty 50 इंडेक्स फंड या HDFC सेंसेक्स ETF।
डायरेक्ट स्टॉक्स: अगर आप अनुभवी निवेशक हैं, तो स्टॉक SIP के जरिए भी यह रणनीति अपना सकते हैं। Zerodha या Groww जैसे प्लेटफॉर्म पर आप हर महीने शेयर खरीद सकते हैं।
अलग-अलग समय सीमा में लाभ
5 साल: छोटी अवधि में बाजार उतार-चढ़ाव का असर कम करता है। भारत में 5 साल की SIP ने औसतन 12-15% सालाना रिटर्न दिया है।
10 साल: डाटा बताता है कि भारतीय इक्विटी फंड्स में 10 साल की SIP ने लगभग कभी भी नकारात्मक रिटर्न नहीं दिया है।
15 साल: कंपाउंडिंग का जादू शुरू! 5,000 रुपये की मासिक SIP 15 सालों में 15% रिटर्न के साथ 45 लाख रुपये से अधिक बन सकती है।
20 साल: यहां कंपाउंडिंग पूरी ताकत दिखाती है। वही 5,000 रुपये की मासिक SIP 20 सालों में 1 करोड़ से अधिक बन सकती है!
आम गलतफहमियां और चुनौतियां
“जब बाज़ार गिरे, तब SIP रोक देनी चाहिए”: यह सबसे बड़ी गलती है! बाज़ार के गिरने पर आपको अधिक यूनिट मिलती हैं। धैर्य रखें।
“मेरा पैसा डूब जाएगा”: अगर आप विविधता (diversification) से निवेश करते हैं, तो लंबी अवधि में पैसा डूबने का जोखिम बहुत कम हो जाता है।
“मुझे मार्केट टाइमिंग आती है”: कोई भी एक्सपर्ट लगातार मार्केट टाइमिंग नहीं कर पाता। रुपी-कॉस्ट एवरेजिंग इसी कारण फायदेमंद है।
अलग-अलग बजट के लिए सलाह
छोटा बजट (1,000-3,000 रुपये/महीना): इंडेक्स फंड्स में SIP शुरू करें, जैसे UTI निफ्टी इंडेक्स फंड।
मध्यम बजट (3,000-10,000 रुपये/महीना): 70% इक्विटी फंड और 30% डेट फंड में निवेश की रणनीति अपनाएं।
बड़ा बजट (10,000 रुपये से अधिक): विविध एसेट क्लासेस जैसे इक्विटी, डेट, गोल्ड और रियल एस्टेट फंड में SIP करें।
अंतिम सलाह
याद रखें, निवेश में “चील की तरह नज़र और गिद्ध का धैर्य” होना चाहिए। रुपी-कॉस्ट एवरेजिंग आपके निवेश यात्रा को आसान बनाती है, और आपको मार्केट टाइमिंग की चिंता से मुक्त करती है। बस शुरू करें, नियमित रहें, और समय के साथ अपने सपनों को पूरा होते देखें। जैसा हमारे यहां कहते हैं, “बूंद-बूंद से घड़ा भरता है” – थोड़ा-थोड़ा, लेकिन लगातार निवेश करके आप भी अपने वित्तीय लक्ष्यों तक पहुंच सकते हैं।
HCLTech delivered a solid Latest Q4 FY2025 Results, with revenue of ₹30,246 Crore (+1.2% QoQ, +6.2% YoY) and profit after tax of ₹4,309 Crore . Operating margins held firm at ~21.8% (vs. 21.5% in Q3), underpinned by robust services growth and cost discipline. The Board declared an interim dividend of ₹18 per share (incl. special payout) .
2. Latest Q4 FY25 Highlights
Revenue: ₹30,246 Cr, +1.2% QoQ, +6.2% YoY
EBIT: ₹5,735 Cr (EBIT margin ~19.0%)
Profit after tax: ₹4,309 Cr, −6.2% QoQ (due to tax base), +7.9% YoY
Other Income: ₹449 Cr, stable QoQ
Cash Flow: Operating cash flow of ₹22,261 Cr; free cash flow of ₹20,?00 Cr for FY25
CAPEX: ₹1,108 Cr invested in digital, AI labs and campus expansions
Headcount: 223,000+, net addition of 2,200 employees; LTM attrition at ~12.8%
3. Key Metrics & Financial Ratios
Metric
Value
Price/Earnings (P/E)
24.9×
Price/Book (P/B)
6.2×
Dividend Yield
3.43%
ROCE
31.9%
ROE
25.2%
Net Debt / Equity
0.09×
Sales Growth (3-yr CAGR)
11.0%
Profit Growth (3-yr CAGR)
9.08%
OPM
21.8%
Debt / EBITDA
~0.3×
4. Management Updates & Growth Strategy
AI & Digital Leadership: Continued investment in “AI Force” platform, Gen AI labs with partners (SAP, ServiceNow), and integration of GitHub Copilot to accelerate internal and client-facing digitalization.
Strategic Acquisitions: Completion of HPE CTG asset acquisition bolsters edge-to-cloud engineering capabilities, particularly in Telecom and Media.
Hyperscaler Partnerships: Deepening alliances with AWS, Microsoft Azure, Google Cloud to drive cloud migrations, data analytics, FinOps and AI use cases.
Sector Focus: Strong deal momentum in Financial Services (hybrid-cloud, fraud analytics), Manufacturing (smart-factory Gen AI), Retail & CPG (e-commerce platform modernization), Life Sciences (regulatory AI platforms) and Public Services (citizen-digital hubs).
5. Planned Expansions & CAPEX Deployment
Global Delivery Centres: New development centres in Eastern Europe and Latin America to diversify talent pools.
Innovation Labs: Inaugurated SAP Business AI Lab (Germany), AI Labs (New Jersey, Noida) to co-innovate with clients on high-value AI/ML solutions.
Campus Upgrades: ₹1,108 Cr CAPEX in FY25 for data centres, security operations centres and digital-learning hubs .
Based on steady digital/AI adoption ** Assuming market maturation, slower growth tailwinds
Projected Total Returns (incl. dividends):
5-year: ~15% p.a.
10-year: ~12% p.a.
15-year: ~10% p.a.
20-year: ~9% p.a.
7. Valuation & Credit Ratings
Valuation: Trading at 24.9× P/E vs. large-cap IT peer average of ~23–24×. Premium reflects superior ROCE (31.9%), robust cash flows, high-growth AI pipeline.
Dividend: 88 consecutive quarters of payout; current yield 3.43% supports income investors.
Credit Rating: Stable credit profile; no rating changes announced in FY25 (Rating agencies continue to assign “AA”/“AA-” long-term ratings).
8. Investment Risks
Deal Conversion Cycles: Large‐deal TCV may compress; reliance on shorter-tenor wins.
Talent Retention: Elevated attrition in a tight labour market could pressure margins.
Macro Uncertainties: Geopolitical tensions and discretionary IT spend volatility.
Conclusion
HCLTech’s Q4 FY25 performance underscores resilient revenue growth, margin resilience and world-class cash generation. With accelerated AI/digital investments, strategic acquisitions and strong guidance, the stock presents an attractive mix of growth and yield. Current valuation is justified by premium returns on capital and sustained dividend payouts.
Disclaimer: This report is for informational purposes only and does not constitute investment advice. Investors should conduct their own due diligence or consult a financial adviser prior to any investment decision.