Valuation at ~32× P/E reflects premium growth; justified by sustained 25–30% AUM growth and high ROE.
Dividend Policy: Pursuant to policy, Board has recommended final dividend of ₹44 / share (2,200%) plus special interim of ₹12 / share—total yield ~0.9%.
Share Sub-Division & Bonus: Proposal to split ₹2 → ₹1 shares and issue 4 bonus shares per existing share enhances retail liquidity.
4. CAPEX & Growth Strategy
CAPEX Run-Rate: FY25 investment in IT, branches and digital platforms ~₹1,030 Cr.
Digital & FINAI Roadmap: Commitment to deploy >100 AI/ML applications in FY26 across underwriting, customer acquisition and risk monitoring.
Network Expansion: Added 118 new locations in FY25; branch network now >4,200 locations with 232K distribution points.
5. Long-Term Projections & Returns
Time Horizon
AUM CAGR
PAT CAGR
Implied Share Price CAGR*
5 years
22–24%
18–20%
~15% p.a.
10 years
18–20%
15–17%
~14% p.a.
15 years
16–18%
14–16%
~13% p.a.
20 years
15–17%
13–15%
~12% p.a.
*Assumes re-investment of dividends and moderate re-rating over time.
6. Management Quality & Governance
Leadership Team: Recent promotions of three Deputy CEOs underscore succession planning.
Track Record: Delivered >25% AUM & customer growth over 15 years while maintaining sub-1% NPAs.
Governance: Unmodified audit opinions; Chairman & CEO separation; active Investor Advisory Council.
7. Credit Ratings Update
S&P Global (17 Mar 2025): Upgraded issuer rating to “BBB-/Positive”; SACP to “BBB”.
Moody’s: Assigned Baa3/P-3 long/short term with Stable outlook—reflects strong capitalization and asset quality.
8. Future Growth Plans
New Business Lines: Expansion in Gold Loans, Vehicle Finance, and Co-lending partnerships.
Geography: Deepen presence in underserved rural and semi-urban markets via micro-branches.
Technology: Launch end-to-end digital lending on Finserv App—aim for 100 million+ active users.
Shareholder Returns: Total Return ~20–25% p.a. over medium term (including dividends).
20-Year Equity CAGR: Target 12–15% p.a., driven by compounding of earnings and multiple expansion.
10. Conclusion
Bajaj Finance continues to combine high-growth potential with robust asset quality and strong capital buffers. Its leadership in retail lending, aggressive digital and AI investments, and disciplined risk management make it a compelling pick for long-term investors seeking sustainable wealth creation.
Disclaimer: This report is for informational purposes only and does not constitute investment advice. Investors should conduct their own due diligence or consult a professional advisor before making any investment decisions.
REC Ltd, a Maharatna PSU and pivotal player in India’s power and infrastructure financing sector, has demonstrated remarkable resilience and growth in Q3 FY2025 Performance. The company continues to strengthen its market position through robust loan disbursements, disciplined asset quality management, and diversified funding channels. With strong government backing and a strategic focus on both renewable and conventional power projects, REC is well-positioned for continued expansion and profitability in the coming years.
Q3 FY2025 Financial Performance
Q3 FY2025 Financial Highlights
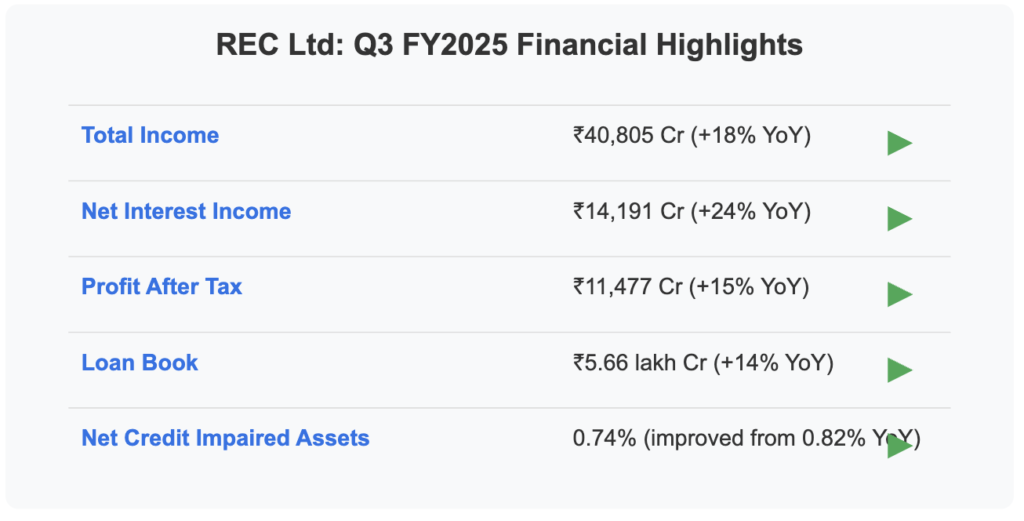
REC Ltd posted impressive financial results for Q3 FY2025, showcasing strong growth across all key metrics. Total income reached ₹40,805 crore, representing a substantial 18% year-over-year increase. Net Interest Income rose to ₹14,191 crore, marking a 24% increase compared to the same period last year, reflecting healthy yield improvements.
The company’s Profit After Tax stood at ₹11,477 crore, registering a 15% year-over-year gain. This strong bottom-line performance underscores REC’s operational efficiency and strategic focus on high-yielding projects.
The loan book expanded to ₹5.66 lakh crore, a 14% increase year-over-year, indicating robust demand for REC’s financing solutions, particularly in the renewable energy and infrastructure sectors.
Asset Quality & Dividend Policy
REC’s asset quality showed notable improvement, with net credit impaired assets reduced to 0.74% from 0.82% in the previous year. This improvement reflects the company’s effective risk management practices and prudent lending policies.
The company announced a Q3 interim dividend of ₹4.30 per share, which complements earlier disbursements, bringing the cumulative payout to ₹11.80 per share for FY2025. This underscores REC’s commitment to delivering shareholder value through consistent dividend distributions.
Financial & Operational Analysis
Operational Metrics
Revenue & Earnings
REC’s solid income growth has been primarily driven by increased loan disbursements, particularly in the renewable and infrastructure sectors. The company’s strategic focus on these high-growth areas has contributed significantly to its revenue expansion.
Cost Efficiency
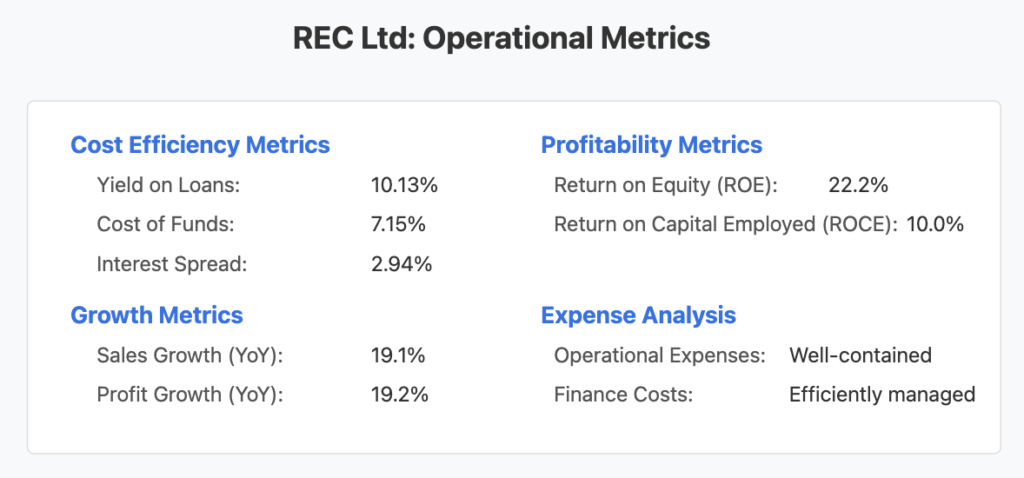
The yield on loans remained robust at approximately 10.13%, while the cost of funds decreased to around 7.15%. This favorable spread of 2.94% has bolstered REC’s profitability and operational efficiency.
Profitability Metrics
REC demonstrated strong profitability with a Return on Equity (ROE) of 22.2% and Return on Capital Employed (ROCE) of 10.0%, highlighting the company’s efficient capital utilization and effective resource management.
Expense Management
Operational expenses and finance costs have been well-contained, underpinning stable margins despite the challenging macroeconomic environment. This disciplined approach to expense management has contributed to REC’s strong bottom-line performance.
Growth Metrics
The company recorded impressive sales growth of 19.1% year-over-year, accompanied by a profit growth of 19.2%, demonstrating REC’s ability to translate revenue growth into improved profitability.
Future Growth Plans & Expansion Strategy
Future Growth Plans & CAPEX Strategy
Renewable Energy Focus
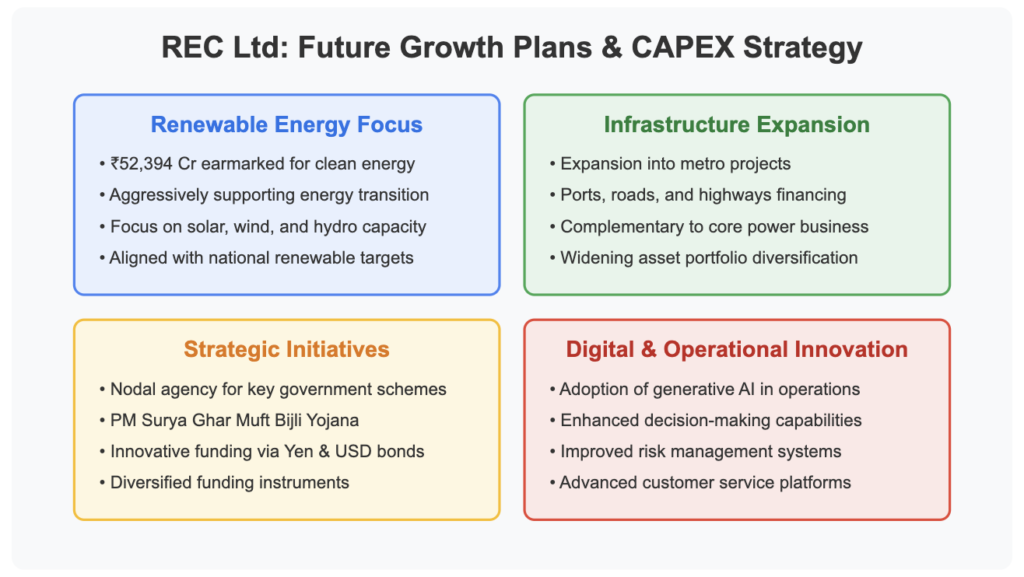
REC has allocated over ₹52,394 crore for clean energy projects, demonstrating its aggressive support for India’s energy transition. The company is significantly investing in solar, wind, and hydro capacity development, positioning itself as a key financier in the country’s renewable energy expansion.
Infrastructure Expansion
Beyond its core power financing business, REC is strategically expanding into metro projects, ports, roads, and highways. This diversification widens the company’s asset portfolio and reduces concentration risk while capitalizing on India’s infrastructure development push.
Strategic Initiatives
REC’s role as the nodal agency for key government schemes, including the PM Surya Ghar Muft Bijli Yojana, enhances its strategic importance in India’s energy landscape. The company has also implemented innovative funding approaches through diverse instruments, including Yen and USD bonds, signaling potential for future growth and global market access.
Digital & Operational Innovation
REC’s adoption of generative AI in its operations aims to improve decision-making processes, enhance risk management capabilities, and elevate customer service standards. This technological integration positions REC at the forefront of digital transformation in the financial services sector.
Key Metrics & Valuation
Key Metrics & Valuation
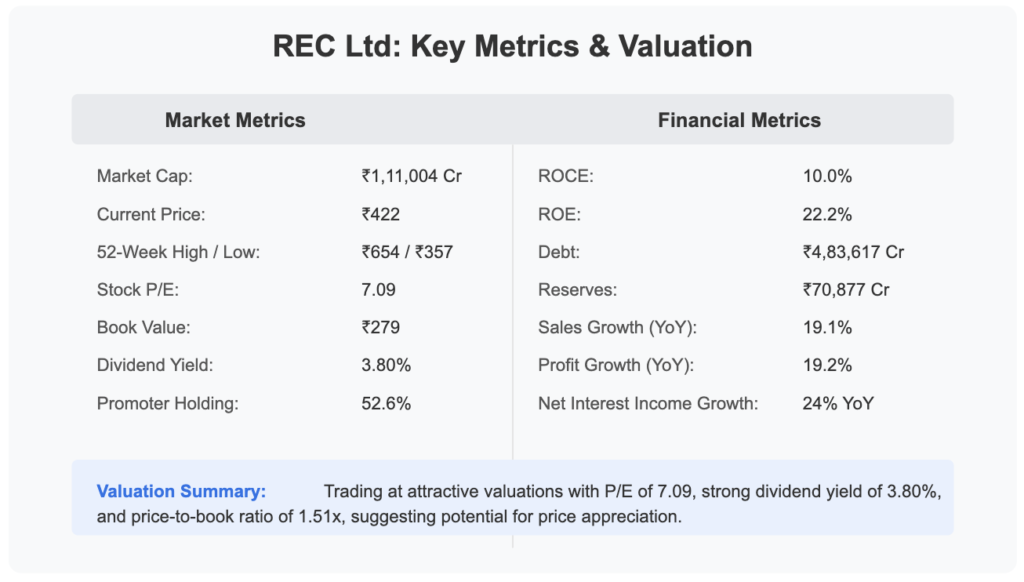
REC Ltd currently trades at a P/E ratio of 7.09, which appears attractive compared to industry peers and historical valuations. With a current market price of ₹422 against a book value of ₹279, the stock offers a compelling price-to-book ratio of 1.51x. The company’s dividend yield stands at an impressive 3.80%, making it an attractive option for income-focused investors.
The company’s strong financial metrics, including a ROE of 22.2% and ROCE of 10.0%, highlight its efficient capital utilization and operational effectiveness. With promoter holding at 52.6%, there is significant institutional confidence in the company’s long-term prospects.
Investment Scenarios
Bull & Bear Case Scenarios
Bull Case
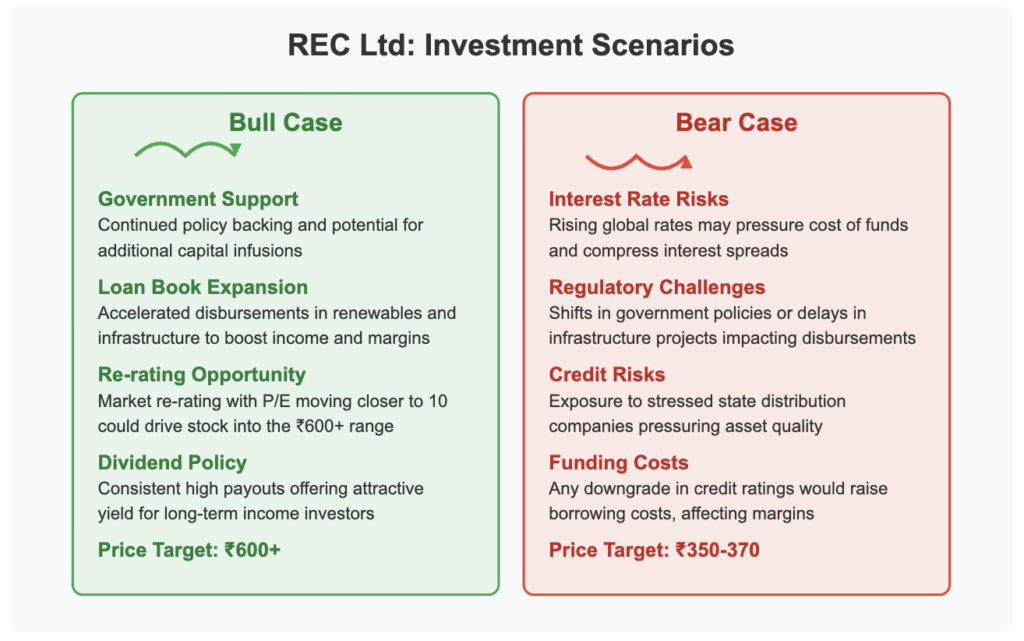
Government Support: Continued policy backing and potential for additional capital infusions could further strengthen REC’s market position and boost investor confidence.
Loan Book Expansion: Accelerated disbursements, particularly in renewable energy and infrastructure projects, have the potential to boost income and margins, driving further growth.
Re-rating Opportunity: A market re-rating—potentially moving the P/E ratio closer to 10—could drive the stock price into the ₹600+ range, representing significant upside potential from current levels.
Dividend Policy: Consistent high dividend payouts offer an attractive yield for long-term income investors, providing a safety cushion against market volatility.
Bear Case
Interest Rate Risks: Rising global interest rates may pressure the cost of funds and compress interest spreads, potentially impacting profitability.
Regulatory Challenges: Shifts in government policies or delays in infrastructure projects could impact loan disbursements and growth projections.
Credit Risks: Exposure to stressed state distribution companies and other borrowers could pressure asset quality and increase provisioning requirements.
Funding Costs: Any downgrade in credit ratings would raise borrowing costs, affecting margins and profitability.
Long-Term Projections
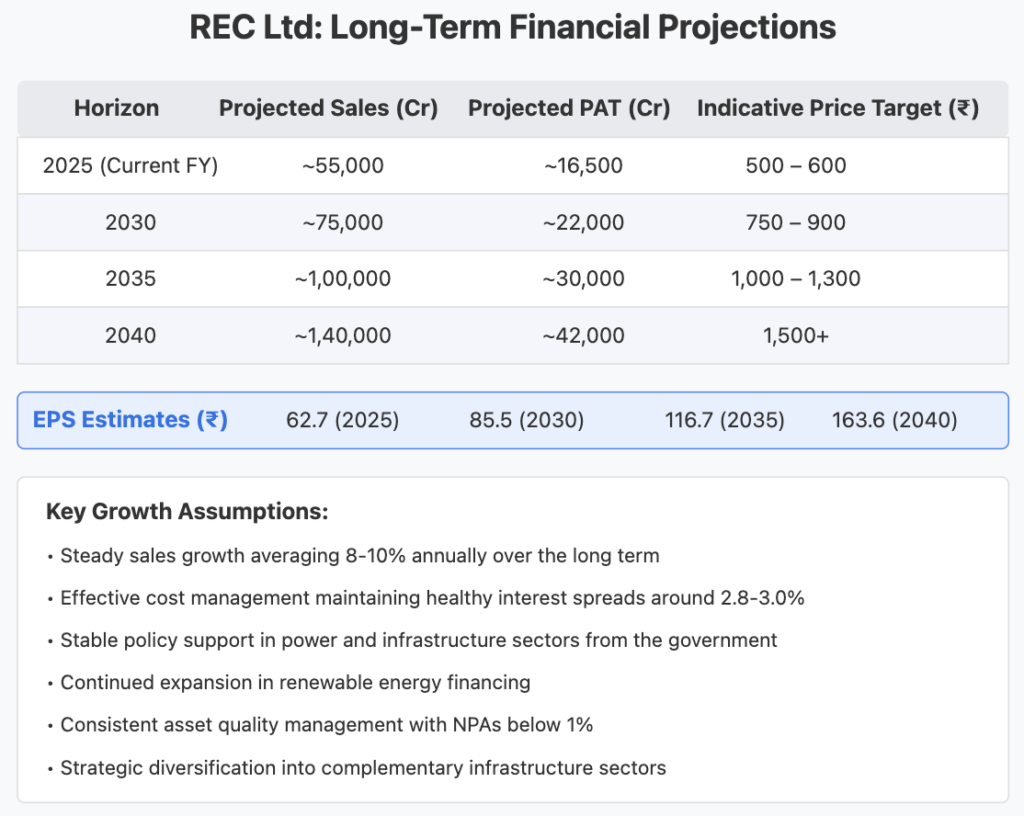
REC Ltd’s long-term growth trajectory appears promising, with projections indicating substantial expansion across key financial metrics. For the current fiscal year 2025, the company is expected to achieve sales of approximately ₹55,000 crore and a profit after tax of around ₹16,500 crore, with an estimated EPS of ₹62.7. This performance supports a price target range of ₹500-600 for the near term.
Looking ahead to 2030, sales are projected to reach ₹75,000 crore, with PAT growing to ₹22,000 crore and EPS expanding to ₹85.5. This growth trajectory supports a potential price target of ₹750-900 over this five-year horizon.
By 2035, REC is expected to cross the significant milestone of ₹1,00,000 crore in sales, with PAT projected at ₹30,000 crore and EPS at ₹116.7. These metrics could justify a price target range of ₹1,000-1,300.
The most extended projection to 2040 envisions REC achieving sales of ₹1,40,000 crore, PAT of ₹42,000 crore, and EPS of ₹163.6, potentially driving the stock price above ₹1,500.
These projections are underpinned by several key assumptions:
Steady sales growth averaging 8-10% annually over the long term
Effective cost management maintaining healthy interest spreads around 2.8-3.0%
Stable policy support in power and infrastructure sectors from the government
Continued expansion in renewable energy financing
Consistent asset quality management with NPAs below 1%
Strategic diversification into complementary infrastructure sectors
Funding & Credit Ratings Update
Credit Ratings & Funding Profile
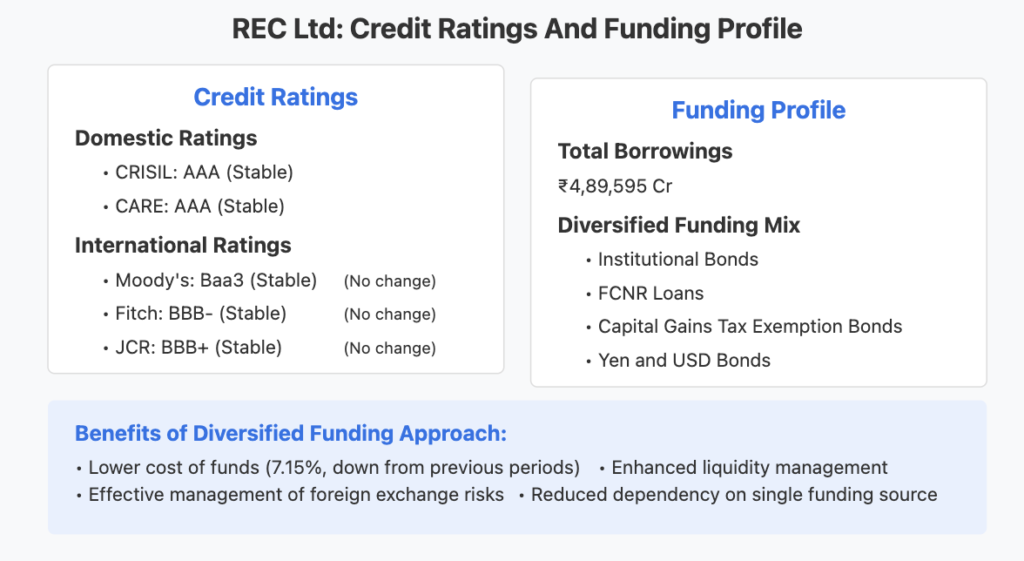
REC maintains strong credit ratings across both domestic and international rating agencies, reflecting its robust financial health and strategic importance in India’s power and infrastructure financing landscape.
Domestic Ratings
REC continues to hold the highest possible AAA (Stable) ratings from leading domestic agencies such as CRISIL and CARE. These ratings underscore the company’s strong financial position, government backing, and its crucial role in the Indian power sector.
International Ratings
The company maintains stable ratings from key international agencies:
Moody’s: Baa3 (Stable)
Fitch: BBB- (Stable)
JCR: BBB+ (Stable)
No changes in credit ratings have been reported during the quarter, indicating the market’s continued confidence in REC’s financial stability and business model.
Borrowing Profile
REC’s total borrowings currently stand at ₹4,89,595 crore, representing a well-diversified funding mix that includes institutional bonds, FCNR loans, capital gains tax exemption bonds, and international instruments such as Yen and USD bonds. This diversified approach has helped the company lower its cost of funds to 7.15% and effectively manage foreign exchange risks.
Dividend History & Yield
Dividend History & Yield
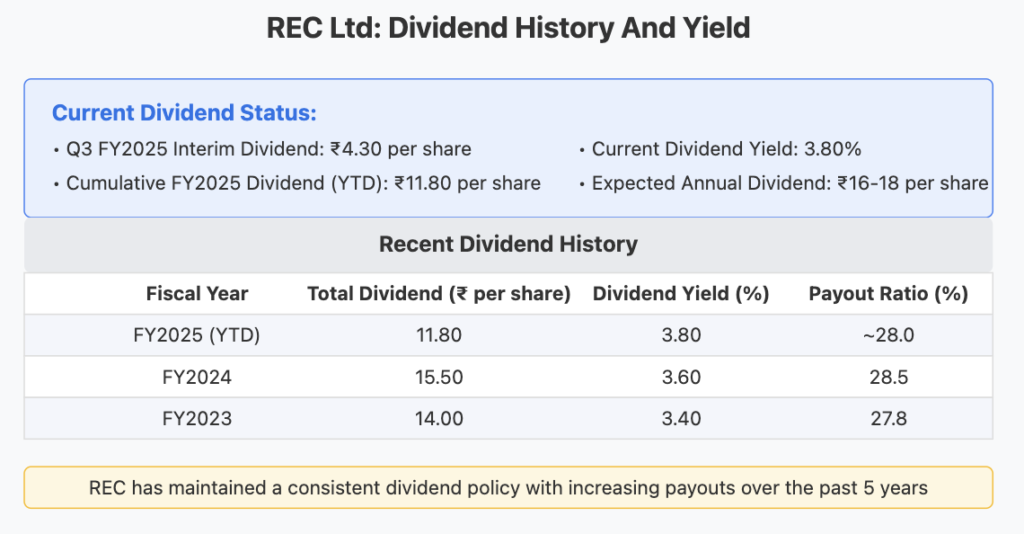
REC has maintained a strong and consistent dividend policy, reinforcing its commitment to shareholder returns. For Q3 FY2025, the company announced an interim dividend of ₹4.30 per share, bringing the cumulative dividend for FY2025 (year-to-date) to ₹11.80 per share.
The current dividend yield stands at an attractive 3.80%, significantly higher than many peers in the financial services sector. Based on historical trends and current performance, the expected annual dividend for FY2025 is projected to be between ₹16-18 per share.
Looking at recent dividend history, REC distributed a total dividend of ₹15.50 per share in FY2024 with a yield of 3.60% and a payout ratio of 28.5%. In FY2023, the company paid a total dividend of ₹14.00 per share with a yield of 3.40% and a payout ratio of 27.8%.
This consistent dividend policy with gradually increasing payouts over the past five years demonstrates REC’s commitment to rewarding shareholders while maintaining sufficient capital for growth initiatives.
Conclusion
Investment Conclusion
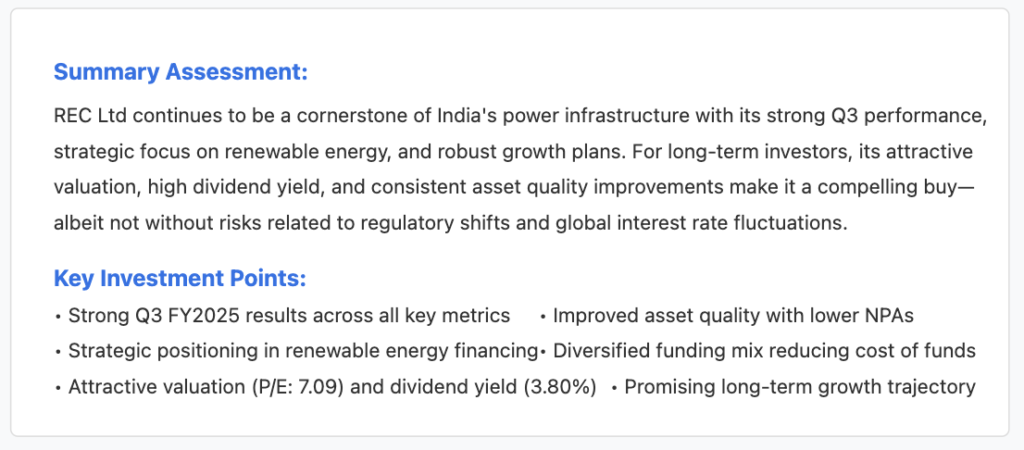
REC Ltd is a key player in India’s power sector, highlighted by its strong Q3 FY2025 performance and a strategic pivot towards renewable energy. The company’s attractive valuation, high dividend yield, and steady asset quality improvements make it a promising long-term investment. Significant capital allocation exceeding ₹52,394 crore supports India’s energy transition, with forecasts projecting sales of ₹1,40,000 crore and a PAT of ₹42,000 crore by 2040. Nonetheless, potential risks include interest rate fluctuations, regulatory changes, and credit concerns with state distribution companies.
Disclaimer
This report is for informational purposes only and does not constitute investment advice. Investors are encouraged to perform their own due diligence before making any investment decisions. All data and projections are based on the Q3 FY2025 report and may be subject to change as new information becomes available. Past performance is not indicative of future results.
Executive Summary BSE Ltd delivered a standout quarter in Q3 FY2025 with record quarterly revenues, robust profit growth, and operational improvements across its segments. The company’s performance was driven by a surge in transaction charges, expanding market activity in both the cash and derivatives segments, and strategic investments in technology and product innovation. Key metrics remain strong despite a high valuation, reflecting elevated growth expectations.
Q3 Results & Highlights
Record Revenues & Profitability: • Consolidated quarterly revenue reached approximately ₹835.4 crores—up 94% YoY—with operational revenues surging by 108% to ₹773.5 crores. • Net profit attributable to shareholders climbed to around ₹219.7 crores (103% YoY growth). • EBITDA margins improved significantly, with operating EBITDA rising from ₹91.9 crores to ₹236.5 crores (margins expanding from 25% to 31%), and further strengthening to 56% when core SGF contributions are excluded.
Segment Performance: • The primary market segment saw 30 new listings raising a record ₹95,512 crores—up 261% YoY—underscoring robust capital-raising activity. • Trading segments demonstrated resilience with the equity cash market maintaining an average daily turnover of approximately ₹6,800 crores, while the derivatives segment posted its highest-ever average daily premium turnover of around ₹8,758 crores. • Mutual fund distribution revenues jumped by 92% to ₹63.5 crores, driven by a 39% increase in transaction volumes.
Future Growth Plans & Planned Expansions
Technology & Infrastructure: • BSE is set to upgrade its trading systems, including enhancements in clearing and risk management, and is expanding its colocation (COLO) facilities to meet rising demand. • Investments are planned to support a “future-ready” infrastructure, ensuring robust scalability as market volumes increase.
Product & Market Innovation: • Continued development of new derivative products (such as revised Sensex and Bankex contracts) and the introduction of innovative indices through its subsidiary, AIPL, will deepen market participation. • The IPO pipeline remains healthy, with ongoing efforts to attract new listings and further strengthen its position as India’s preferred capital-raising platform.
Future Financial Projections & Long-Term Returns While explicit numerical forecasts for the next 5, 10, 15, and 20 years were not provided, several key factors suggest a favorable long-term outlook:
Growth Drivers: Increasing trading volumes, expansion in the IPO market, and recurring revenue streams (e.g., from transaction charges and listing fees) provide a solid foundation for future revenue growth.
Margin Expansion: Continued operational leverage—particularly as SGF contribution impacts stabilize—could boost profitability over time.
Sustainable Scale: Investments in technology and infrastructure will enable BSE to capture a larger market share and support scalable growth across its diversified product lines. Investors may anticipate that these drivers, if sustained, could lead to attractive long-term returns, albeit subject to market and regulatory risks.
Expense & Operational Analysis
Rising Operating Expenses: • Operating expenses increased by 86%, mainly driven by higher contributions to the core Settlement Guarantee Fund (SGF) due to new SEBI stress testing norms. • However, as trading volumes mature and the incremental SGF impact diminishes, efficiency improvements are expected to support margin expansion.
Cost Management: • Despite short-term expense pressures, ongoing investments in automation and technology are aimed at streamlining operations and reducing per-unit costs over the long term.
Growth Indicators: • Sales and profit growth at 119% and 130%, respectively, underpin a strong growth narrative even as valuation multiples remain on the higher side, implying market expectations of sustained expansion.
Bull Case vs. Bear Case
Bull Case: • Continued innovation and expansion in trading and listing segments can drive further revenue and profit growth. • Enhanced technology, broader investor participation, and an expanding suite of products (including derivatives and mutual funds) could solidify BSE’s market leadership and yield strong long-term returns.
Bear Case: • Regulatory uncertainties (e.g., evolving SGF norms) and market volatility could pressure margins and trading volumes. • A high P/E ratio might expose the stock to corrections if growth drivers fail to meet expectations or if market sentiment shifts. • Competitive pressures from other exchanges might impede market share gains.
CAPEX & Growth Strategy
BSE’s strategic roadmap includes significant CAPEX for technology upgrades and expanded colocation services, aimed at bolstering capacity and improving operational efficiency.
Long-term investments are also targeted at product innovation and enhanced market connectivity, which are essential for sustaining its competitive edge.
Credit Rating & Regulatory Outlook
No notable changes in credit agency ratings were mentioned during the call, suggesting stability in BSE’s credit profile despite ongoing regulatory adjustments.
────────────────────────────── Conclusion & Disclaimer BSE Ltd’s Q3 FY2025 performance underscores its strong operational momentum and strategic positioning within India’s capital markets. With robust revenue and profit growth, coupled with clear plans for technological and product innovation, BSE appears well positioned for sustained long-term growth. However, investors should remain cautious of the inherent regulatory risks and high valuation multiples.
Disclaimer: This report is for informational purposes only and does not constitute investment advice. Investors should conduct their own due diligence before making any investment decisions.
CMS Info Systems Limited – a market leader in cash logistics and managed services – is undergoing a technology‐driven transformation. With robust financial metrics and an expanding order book, the company is well positioned to capitalize on industry consolidation and new revenue streams, including AIoT-based remote monitoring and non‐BFSI initiatives.
2. Q3 FY2025 Results
Revenue & Profitability
Consolidated revenue for Q3 stood at INR 581.5 Cr. with service revenue growing by 3% YoY.
PAT increased 7% YoY to INR 93.2 Cr., with margins expanding by 140 bps to 16%.
Revenue declined by 10% (INR 210 Cr.) due to lower banking automation figures, though EBIT remained healthy at INR 38 Cr. (17.9% margin).
Operational Highlights
Order book execution improved significantly—from 15% in H1 to 30% in Q3—with a target of 60% by Q4.
The company recorded its highest-ever cash volume in Q3, with a 6% YoY increase and a 10% overall business point addition.
3. Growth Plans & Strategic Initiatives
Revenue Expansion
Targeting midterm revenue CAGR of 13%–15% through a balanced portfolio:
Cash Logistics expected to grow at 10%–13%.
Managed Services & Technology solutions poised for 15%+ growth.
AIoT Remote Monitoring to compound at 15%–20%.
Product & Market Diversification
Continued focus on deepening retail and quick-commerce engagements alongside traditional BFSI offerings.
Cross-selling opportunities leveraging an integrated service stack are being actively pursued.
Future Order Book & Execution
The execution of a large PSU order book, though delayed by testing and handover issues, is expected to lift FY26 service revenue growth to 15%+.
4. Capital Expenditure & Technology Investment
CAPEX Outlook
Q3 CAPEX stood at INR 50 Cr., with full-year projections in the range of INR 150–200 Cr.
Majority of the CAPEX is directed towards scaling Managed Services (order execution ramp-up) and AIoT/RMS capabilities.
Strategic Rationale
Increased tech spending from 1% to 1.5% of revenue supports superior service quality, automation, and enhanced risk management, positioning CMS for sustained margin improvement.
Assuming an organic revenue CAGR between 13% and 15% and maintenance of current margins and valuation multiples:
EPS Multipliers (Approximate)
Time Horizon
At 13% CAGR
At 15% CAGR
5 Years
1.84x
2.0x
10 Years
3.4x
4.0x
15 Years
6.2x
8.1x
20 Years
11.2x
16.4x
These figures suggest robust long-term potential if the company successfully converts order wins into recurring revenue and continues to execute its strategic initiatives.
6. Competitive Landscape & Risks
Industry Dynamics
The cash logistics sector is witnessing consolidation. CMS is benefiting from competitors’ operational disruptions, particularly in ATM management, as banks transition to stronger, tech-enabled providers.
Risks
Execution Delays: Ongoing delays in PSU order book execution may pressure short-term revenue.
Margin Pressures: Risks from pricing adjustments in outsourcing contracts and potential fluctuations in technology costs.
Operational Risks: Inherent risks in cash management (e.g., reconciliation issues, theft, and process delays) remain, though mitigated by enhanced risk management protocols.
Strategic Mitigation
A conservative capital allocation strategy with low debt (₹186 Cr.) and strong reserves (₹1,939 Cr.) underpins the company’s ability to weather short-term headwinds.
7. Valuation Estimate & Investment Thesis
Valuation
With a current Stock P/E of 20.1, ROE of 19.4%, and ROCE of 27%, CMS is trading at attractive levels relative to its growth prospects.
The strong balance sheet, low leverage, and disciplined CAPEX make the current market cap of ₹7,362 Cr. compelling for value-oriented investors.
Investment Thesis
Catalysts
Accelerated order book execution, technological upgrades, and entry into high-growth segments (AIoT, retail, bullion logistics).
Beneficial industry trends and consolidation, along with improved margins across segments.
Risks Managed
Execution delays and operational challenges are offset by a diversified revenue mix and strong cash generation.
Outlook
Long-term returns are projected to be attractive, with EPS multipliers potentially growing 2x–16x over 5–20 years, assuming sustained CAGR in the range of 13%–15% and steady valuation multiples.
Conclusion: CMS Info Systems Limited offers a compelling blend of growth, operational resilience, and disciplined capital management, making it an attractive long-term proposition despite near-term execution risks.
8. Key Financial Metrics
Market Cap
₹7,362 Cr.
Current Price
₹449
High/Low
₹616 / ₹373
Stock P/E
20.1
Book Value
₹129
Dividend Yield
1.28%
ROCE
27.0%
ROE
19.4%
Face Value
₹10.0
Debt
₹186 Cr.
Reserves
₹1,939 Cr.
No. of Equity Shares
16.3 Cr.
Change in Promoter Holding (3 Yr)
-65.6%
Sales
₹2,433 Cr.
Profit after Tax
₹366 Cr.
OPM
25.5%
Qtr Sales Variance
-0.14%
3-Year Sales Growth
20.1%
3-Year Profit Variance
26.4%
9. Disclaimer
This report is for informational purposes only and does not constitute investment advice. Investors are advised to conduct their own research and consult with a financial advisor before making any investment decisions.
Q3 FY2025 Performance Analysis & Future Growth Outlook
March 2, 2025
Financial Newsletter
Market Analysis
Investment Overview
Bajaj Holdings & Investment Ltd (BHIL) continues to deliver solid performance as a diversified holding and investment company. With strategic stakes in marquee group companies such as Bajaj Auto Ltd and Bajaj Finserv Ltd, the firm leverages a robust portfolio to generate income from dividends, interest, and fair‐value gains. The recent Q3 FY2025 results confirm both resilience and growth potential in an evolving regulatory and competitive landscape.
Key Market Metrics
Market Cap
₹1,28,811 Cr.
Current Price
₹11,574
High/Low
₹13,238 / ₹7,660
Stock P/E
17.2
Book Value
₹5,375
Dividend Yield
1.13%
ROCE/ROE
13.1% / 14.8%
Debt vs. Reserves
₹46.6 Cr. / ₹59,712 Cr.
Q3 FY2025 Performance
Standalone & Consolidated Results
Standalone PAT
Improved from ₹66 Cr. (Q3 FY24) to ₹84 Cr. in Q3 FY25
Driven by stronger dividend income and gains on investments.
Consolidated PAT
Rose to ₹1,748 Cr. vs ₹1,644 Cr. in Q3 FY24
Reflecting steady operating performance from key group companies.
Operating Margins
OPM of ~90.1% on standalone sales
Healthy sales growth with quarterly sales variation at 16.9%.
Balance Sheet Strength
Minimal debt juxtaposed with sizable reserves reinforces capital adequacy. A well-diversified investment portfolio valued at over ₹13,000 Cr. (market value) positions the company to weather market volatility.
Reserves
₹59,712 Cr.
Debt
₹46.6 Cr.
Portfolio Value
₹13,000+ Cr.
Q3 FY25 PAT
₹1,748 Cr.
Future Growth & Expansion Plans
Strategic Initiatives
The Board has approved transitioning BHIL into an Unregistered Core Investment Company, which will enable a realignment of its portfolio under RBI guidelines—potentially unlocking value and enhancing regulatory benefits.
Planned expansion revolves around strategic equity investments and selective buybacks (as seen in the recent equity share buyback yielding ~₹1,110 Cr. profit), which are expected to drive long-term EPS growth.
BHIL’s continued participation in high-growth segments through investments in Bajaj Auto, Bajaj Finserv, and other group companies supports both dividend income and capital gains.
Products & CapEx Rationale
BHIL’s “product” is its carefully curated portfolio. The capital expenditure is largely directed toward optimizing this mix, ensuring that investments meet evolving market conditions and regulatory norms.
By reinforcing its stake in core group companies and realigning its asset allocation, BHIL aims to enhance returns, reduce cost of capital, and maintain a competitive edge in a crowded financial landscape.
Long-Term Growth Projections
Based on current performance indicators and strategic initiatives, we’ve projected potential growth trajectories for BHIL over the next 5, 10, 15, and 20 years.
Return on Investment Projections
Timeframe
Estimated CAGR
Projected Market Cap
Estimated Dividend Yield
5 Years (2030)
12-14%
₹2,25,000-2,50,000 Cr.
1.4-1.6%
10 Years (2035)
10-12%
₹3,60,000-4,00,000 Cr.
1.6-1.8%
15 Years (2040)
9-11%
₹5,50,000-6,50,000 Cr.
1.8-2.0%
20 Years (2045)
8-10%
₹8,00,000-10,00,000 Cr.
2.0-2.2%
Key Growth Drivers for Long-Term Performance
Portfolio Optimization
Continual refinement of investment mix to capitalize on emerging opportunities while maintaining core holdings.
Regulatory Alignment
CIC transition enabling greater flexibility in capital allocation and potentially lower compliance costs.
Group Company Expansion
Growth of underlying Bajaj Group entities creating compound value for BHIL.
Sector Diversification
Strategic entries into new sectors to hedge against concentration risks and tap growth markets.
Competitive Landscape & Inherent Risks
Competitive Advantages
Group Synergies: BHIL benefits from its integration within the Bajaj Group, ensuring preferential access to high-quality investments and a diversified revenue stream.
Strong Fundamentals: With a robust balance sheet, low leverage, and high-quality earnings, BHIL stands resilient against market cyclicality.
Risks & Considerations
Regulatory Risks: The planned re-categorisation and changes in capital gains tax rates introduce uncertainty; delays or adverse regulatory shifts could affect valuations.
Market Volatility: As a holding company, fluctuations in the underlying group companies’ performances directly impact BHIL’s earnings.
Concentration Risk: Significant exposure to core group entities means that downturns in key sectors could impact overall results.
Valuation & Investment Thesis
Valuation Estimate
At a current P/E of 17.2 and healthy financial metrics (ROE 14.8%, ROCE 13.1%), BHIL is fairly valued relative to its growth prospects. Given its strong earnings base and strategic reallocation plans, a moderate multiple expansion along with continued EPS growth could drive the stock price higher over the medium to long term.
Investment Thesis
BHIL represents a compelling long-term opportunity for investors seeking stability combined with growth. Its unique position as a holding company with diversified, high-quality investments, minimal debt, and a strong balance sheet provides both income and capital appreciation.
The ongoing portfolio realignment under RBI’s CIC guidelines, coupled with strategic capital redeployment and a proven track record in generating high margins, underpins an attractive risk-adjusted return profile. As market conditions stabilize and the regulatory framework solidifies, BHIL is well-positioned to deliver sustainable long-term returns.
Disclaimer: This report is for informational purposes only and does not constitute investment advice. Investors should conduct their own research and consider their individual financial circumstances before making any investment decisions.
Satin Creditcare Network Ltd—a leading rural NBFC with over 34 years of legacy—delivered Q3 FY2025 results that underscore its resilient operating model, strategic expansion, and technology–driven efficiency. With attractive valuation multiples, the company appears undervalued relative to its strong operational fundamentals and growth potential. However, high leverage (debt ~₹8,388 Cr) and margin pressures require careful monitoring.
Q3 FY2025 Results Overview
AUM Growth
Consolidated AUM climbed to ₹12,128 Cr in Q3 FY2025—a 10% YoY increase—with SCNL’s AUM rising from ~₹9,811 Cr to ~₹10,778 Cr, reflecting strong disbursement performance and branch expansion (up 11% QoQ).
Profitability & Asset Quality
Q3 PAT
₹31 Cr
Collection Efficiency
99.8%
Credit Costs
<5.0%
Operational Efficiency
Improved cost ratios and robust underwriting processes have helped maintain competitive net interest margins despite sector headwinds.
Future Growth Plans & Expansion
Geographical & Product Diversification
The company continues expanding its branch network and deepening market penetration across 29 states. Its diversified product suite now spans microfinance (MFI), housing finance (SHFL), MSME lending (SFL), and a technology platform via Satin Technologies.
Technology & Process Initiatives
Heavy capital allocation into IT infrastructure—such as digital onboarding, real-time analytics, and AI/ML underwriting enhancements—is designed to reduce turnaround times, improve risk management, and drive operational efficiency.
Future Financial Projections
Timeline
Growth Factor
Expected Returns
Key Assumptions
5 Years
1.6×
60-70% cumulative
Margin improvements, balance sheet deleveraging
10 Years
2.6×
2-3× current price
Sustained growth trajectory
15 Years
4.2×
Substantial wealth creation
Successful capital expenditure
20 Years
6.7×
Significant capital appreciation
Effective risk management
Product Portfolio & Capital Expenditure Strategy
Product Offerings
MFI Loans: Catering to low-income rural households with ticket sizes up to ₹100,000
Housing Finance (SHFL): Targeting middle to low-income segments with larger loan sizes and longer tenures
MSME Lending (SFL): Focus on secured, small–ticket business loans (<₹2 Lacs) with significant growth potential
Technology Initiatives: Satin Technologies leverages in–house IT solutions
Capital Expenditure Strategy
Investments are directed towards:
Expanding branch networks
Digital platforms development
Risk management systems enhancement
Competitive Landscape & Inherent Risks
Competitive Position
Satin stands out due to its diversified rural footprint, strong technological integration, and a long history of profitable operations. Its product diversification and efficient ALM offer a competitive edge over traditional NBFC-MFIs and local banks.
Key Risks
High LeverageAsset Quality RiskRegulatory RiskMargin PressureCompetitive Disruption
Muthoot Finance Ltd – Stock Research Report (Q3 FY2025 Results)
Muthoot Finance Ltd – Stock Research Report
Q3 FY2025 Analysis
1. Executive Summary
Muthoot Finance Ltd, India’s largest gold loan NBFC, reported strong Q3 FY2025 results with robust growth in loan assets, profitability, and branch expansion. With a dominant presence in the gold loan segment and aggressive digitalization, Muthoot Finance is well-positioned to capitalize on the growing credit demand in India. However, increasing competition and regulatory uncertainties pose risks.
2. Q3 FY2025 Financial Highlights
Revenue
₹44,312 Cr
YoY growth: 40%
PAT
₹13,631 Cr
YoY growth: 33%
Loan AUM
₹97,487 Cr
YoY growth: 37%
Gold Loan AUM
₹92,964 Cr
YoY growth: 34%
Net Interest Margin
5.04%
Capital Adequacy Ratio
25.11%
ROE
17.9%
ROCE
13.2%
Debt-to-Equity
3.97x
Book Value per Share
₹673
Dividend Yield
1.10%
3. Future Growth Plans & Expansions
Branch Network
7,340 branches
+16% YoY
4,855 branches in India
Loan Disbursement
₹15,723 Cr
13.7 lakh new customers
Gold Holdings
202 tonnes
↑ from 184 tonnes YoY
Digital Transformation
Increased adoption of UPI, online gold loans, and AI-based chatbots
Subsidiary Growth
Muthoot Money: 265% YoY
Belstar Microfinance: 30% YoY
4. Products, Capital Expenditure & Strategic Rationale
Product Portfolio:
Gold Loans: Core business segment with strong growth and customer base.
Microfinance & Affordable Housing Loans: Expansion to semi-urban and rural India.
Vehicle Finance & Personal Loans: Growing segment with competitive interest rates.
Diversification Strategy: Scaling non-gold loan segments to de-risk revenue dependence.
5. Competitive Landscape & Risks
Competitive Strengths:
Market Leadership
~40% market share
Strong brand equity in gold loans
High Liquidity
67% of loans
Repaid within 6 months
Low NPAs
Stage III loan assets: 1.65%
Controlled credit risk
Key Risks:
Competition from Banks & NBFCs: Players like Manappuram Finance & Federal Bank gaining ground.
Regulatory Risks: RBI’s evolving NBFC guidelines could impact lending norms.
Gold Price Volatility: Direct impact on LTV and collateral value.
Higher Borrowing Costs: Rising interest rates could pressure margins.
6. Valuation & Investment Thesis
Current Market Price
₹2,183
P/E Ratio
18.5x
Reasonable given strong earnings growth
Price to Book Value
3.2x
Expected FY26 Target Price
₹2,800-3,000
Upside: 28-38%
Muthoot Finance remains a strong long-term compounder, backed by stable growth, high margins, and expanding product lines. Given its dominance in gold loans, strong capital position, and digital push, the stock is attractive for long-term investors seeking steady compounding returns.
7. Conclusion
Muthoot Finance Ltd continues to deliver strong financial performance with consistent growth in revenue and profitability. The company’s strategic expansion, digital transformation, and increasing customer base reinforce its leadership in the gold loan industry. While competition and regulatory risks persist, Muthoot’s fundamentals remain solid.
Central Depository Services (India) Ltd (CDSL) is a premier depository service provider, enabling secure and efficient maintenance of securities and transactions in the Indian financial market. As India’s only listed depository, CDSL holds a significant position in the evolving digital financial ecosystem.
Market Cap
₹ 31,355 Cr.
Current Price
₹ 1,500
52-Week High/Low
₹ 1,990 / 811
Stock P/E
56.5
Book Value
₹ 73.2
Dividend Yield
0.63%
ROCE
40.2%
ROE
31.3%
Debt
₹ 1.04 Cr.
Reserves
₹ 1,320 Cr.
Sales Growth (3Y)
33.2%
Profit Growth (3Y)
27.9%
Q3 FY2024 Results Highlights
Revenue from Operations: ₹ 2,348.67 Cr (up 29.7% YoY)
Net Profit: ₹ 555 Cr, reflecting a growth of 27.9% YoY
Repository and Data Entry segments reported strong growth at 18.5% YoY
Future Growth Drivers
Increased Market Participation
The expanding base of retail investors in India, driven by growing financial literacy and government initiatives, is expected to fuel higher account openings and transaction volumes.
Digitization of Financial Services
With a robust regulatory push, the migration to digital financial ecosystems offers CDSL an advantage, given its leadership in digital depository services.
New Revenue Streams
Repository services in commodities and insurance sectors
Expansion into data analytics and value-added services for clients
Expanding Geographies: Penetrating tier-2 and tier-3 cities
Strategic Expansions and Capital Expenditure (CapEx)
CapEx Plans:
Recent investments of ₹7,525.57 lakh in property, plant, and equipment
Investment in technology upgrades and cybersecurity
Strategic Rationale:
Strengthening core depository services to meet surging demand
Enhancing operational efficiencies through automation and AI-driven processes
Products and Innovations
Diversified offerings such as eKYC, insurance repositories, and centralized data management
Partnerships to integrate blockchain technology for secured and transparent financial transactions
Financial Projections (2025-2028)
Metric
2025E
2026E
2027E
2028E
Revenue (₹ Cr)
1,300
1,550
1,800
2,150
EBITDA Margin (%)
62
63
64
65
Net Profit (₹ Cr)
650
800
980
1,200
EPS (₹)
31.1
38.3
46.8
57.3
ROE (%)
32
33
34
35
Competitive Landscape
Peers:
CDSL primarily competes with NSDL in India, with NSDL holding a dominant position in institutional accounts. CDSL, however, leads in retail accounts.
Strengths:
Low-cost structure and minimal debt provide financial stability
Consistent innovation in services and technology enhances its competitive edge
Weaknesses:
Dependence on regulatory frameworks for depository services
Limited diversification outside India compared to global peers
Valuation Estimate
Target Price (12 Months): ₹1,800
Valuation Multiples:
Forward P/E: 47x
EV/EBITDA: 30x
Investment Thesis
Robust Financial Metrics: Industry-leading ROCE and ROE figures combined with consistent sales and profit growth
Tailwinds from Market Growth: India’s surging retail participation in equity markets offers long-term volume growth
Strategic Diversification: Expansion into insurance repositories and value-added data services
Strong Dividend Policy: Regular payouts provide steady returns
Bajaj Finance Limited (
BSE:
500034
NSE:
BAJFINANCE
) stands as a market leader in the non-banking financial sector (NBFC), demonstrating consistent growth, innovation, and adaptability. The company’s transition into “BFL 3.0,” a FINAI company, emphasizes AI integration across operations, which is expected to drive significant operational efficiency, cost savings, and improved customer engagement. With an ambitious target of achieving ₹4 lakh crore AUM by FY25 and a long-term vision of reaching ₹5 lakh crore AUM by FY29, BFL is well-positioned to sustain its industry dominance.
Key Financial Metrics
Market Cap
₹4,44,569 Cr
Stock Price
₹7,182
ROE
22.1%
ROCE
11.9%
Additional Financial Indicators
Book Value₹1,402
Dividend Yield0.50%
Net NPA0.37%
3-Year Sales CAGR27.3%
Operating Profit Margin69.6%
Future Growth Drivers
AI-Driven Transformation
Implementation of AI across operations with projected annual savings of ₹150 Cr from FY26, enhancing underwriting processes and customer experience through personalized recommendations.
Customer Expansion Strategy
Current customer base: 92.1 million
Target by FY29: 200+ million customers
Focus on underrepresented geographies (UP, Bihar)
Enhanced MSME segment penetration
Green Finance Initiatives
Commitment to finance ₹2,000 Cr worth of solar and EV projects by FY26, aligning with India’s sustainability goals and tapping into emerging markets.
Technology & Infrastructure
Digital Transformation
Multi-cloud orchestration implementation
Blockchain integration for secure transactions
40 critical applications to become cloud-agnostic
Zero Trust security framework implementation
Financial Projections
FY29 Targets
AUM Target₹5+ lakh crore
Customer Base200 million
App Downloads150 million
Location Presence5,500 locations
Valuation & Investment Recommendation
Valuation Metrics
Current PE Ratio28.9x
Fair Value Range₹7,500-₹8,000
Expected EPS CAGR~20% (3-5 years)
Investment Rating: BUY
Time Horizon: Medium to Long Term
BFL’s leadership position, technological innovation, and expansion into high-growth segments make it an attractive investment opportunity at current levels.
Disclaimer: This report is for informational purposes only and does not constitute investment advice. Investors should conduct their own analysis or consult a financial advisor before making investment decisions. Past performance is not indicative of future results.
Dolat Algotech Ltd, a leading technology-focused entity, has demonstrated robust growth with a remarkable 166% increase in sales and a 194% surge in profit in FY 2023-24. With a market capitalization of ₹2,300 crore and a stock P/E ratio of 9.28, the company is positioned attractively within its industry. Leveraging its high operational profit margin (OPM) of 77.4%, the company plans significant expansion supported by a proposed borrowing limit increase to ₹5,000 crore.
Company Overview
Business Focus
Dolat Algotech specializes in technology and financial services, leveraging advanced algorithms to deliver superior operational performance. The company operates with a high level of governance and transparency, supported by an experienced board and management team.
Key Metrics
Market Cap
₹2,300 Cr.
Current Price
₹131
52-Week High/Low
₹186 / ₹59.2
Dividend Yield
0.19%
ROCE
27.7%
ROE
22.0%
Financial Analysis
Performance Overview (FY 2023-24)
Revenue Growth
Consolidated revenue rose by 37.4% YoY to ₹3,314.82 million from ₹2,413.37 million in FY 2022-23
Standalone revenue increased by 41.3% to ₹2,173.55 million
Profitability
Net profit (consolidated) grew to ₹1,577.51 million, a 35.6% YoY increase
Consolidated profit margin stood strong at 47.6%, supported by high OPM of 77.4%
Balance Sheet Strength
Reserves stood at ₹791.75 crore, ensuring financial stability
Debt levels at ₹374 crore, with a manageable debt-to-equity ratio given robust cash flows
Future Growth and Expansion
Capex Plans
The company’s proposed increase in borrowing limits to ₹5,000 crore underscores its aggressive expansion strategy. This capital will be directed towards:
Scaling operational capabilities
Enhancing technology infrastructure
Funding mergers and acquisitions to drive market share growth
Industry Outlook
The financial and technology sectors in India are poised for exponential growth, driven by increased digital adoption and financial inclusion initiatives. Dolat’s technological edge places it well to capitalize on these trends.
Valuation Metrics
P/E Ratio
9.28
Price-to-Book Value
2.48
ROCE
27.7%
ROE
22.0%
Risks and Opportunities
Key Risks
Leverage Risk: Increased borrowing may elevate financial risk, especially in volatile market conditions
Regulatory Environment: Changes in technology and financial regulations could impact operations
Opportunities
Expanding digital ecosystems offer substantial growth potential
Cost-effective operations with a high OPM provide a competitive edge
Conclusion and Recommendations
Recommendation
Buy with a target price of ₹165, representing a potential upside of ~26% from the current price (₹131).
Investment Horizon
Medium to long-term (3-5 years)
Disclaimer
This report is for informational purposes only and does not constitute financial advice. Investors are advised to perform their own due diligence or consult a financial advisor before making investment decisions. The author or associated entities are not responsible for any direct or indirect losses incurred based on this report.
This report is for informational purposes only and does not constitute investment advice. Readers should conduct their due diligence or consult with a financial advisor before making investment decisions. This analysis is based on publicly available data as of Q2 FY25 and may not reflect the latest developments.
Investment Summary
IREDA, India’s premier green financing institution, operates under the administrative aegis of the Ministry of New and Renewable Energy (MNRE). With a market capitalization of ₹58,720 crores and its recent upgrade to a ‘Schedule A’ Central Public Sector Enterprise (CPSE), IREDA is poised for robust growth, driven by government policies promoting renewable energy and green infrastructure.
Key Highlights
Strong Revenue and Profit Growth:
Revenue from operations increased by 35% YoY, reaching ₹3,139.83 crores in H1 FY25
Profit after tax surged by 36% YoY to ₹771.44 crores in H1 FY25
Sectoral Diversification:
IREDA finances projects across solar, wind, hydro, biomass, ethanol, green hydrogen, and electric vehicles. Solar PV constitutes 26% of the loan portfolio, followed by wind energy (16%) and hydro (11%). Emerging technologies like battery storage and green hydrogen are growing contributors.
Operational Efficiency:
Gross NPA improved to 2.19% as of September 2024 from 3.13% in March 2024
Net NPA reduced to 1.04%, underscoring robust credit risk management
Government Ownership and Support:
75% ownership by the Government of India ensures policy alignment and financial backing
IREDA serves as a nodal agency for MNRE’s renewable energy schemes, enhancing its strategic importance
Financial Overview
Metric
H1 FY25
YoY Change
Revenue (₹ Cr.)
3,139.83
+35%
Net Profit (₹ Cr.)
771.44
+36%
Gross NPA (%)
2.19
-0.94%
Net NPA (%)
1.04
-0.61%
Debt-Equity Ratio
5.85
Improved
Cost of Borrowing (%)
7.80
Stable
Net Interest Margin (%)
3.34
+0.17%
Strategic Initiatives
Green Finance Leadership:
IREDA has maintained AAA domestic credit ratings, facilitating cost-effective borrowing. The company’s international S&P Global rating of ‘BBB-‘ supports global fundraising for renewable projects.
Capex and Expansion:
Significant lending to state utilities and private entities ensures a well-distributed loan portfolio
Expansion into emerging sectors like green hydrogen and energy storage strengthens future revenue streams
Regional and International Growth:
The establishment of a subsidiary in GIFT City and cross-border projects like Nepal’s hydro initiatives indicate global ambitions.
Growth Projections
Revenue CAGR: 20-25% over the next five years, driven by increasing disbursements in renewables
Profit Growth: Expected CAGR of 30% due to operational efficiencies and low-cost borrowing advantages
Loan Portfolio: Likely to expand at a CAGR of 15-20%, focusing on solar, wind, and emerging technologies
Valuation
Metric
IREDA
Peers (Median)
P/E Ratio
40.6
30.8
ROE (%)
17.3
13.66
Dividend Yield (%)
0.0
1.5
IREDA trades at a premium valuation due to its strong growth trajectory and strategic role in India’s energy transition.
Risks
High Valuation: The P/E ratio is significantly above industry peers, reflecting high growth expectations
Low Dividend Yield: Lack of dividend payments may deter income-focused investors
Sector Concentration: While diversified, reliance on specific RE technologies like solar and wind exposes the company to sectoral risks
Recommendation
Rating: Buy
Target Price: ₹280 (Upside of ~28% from current levels)
Rationale: IREDA’s strategic positioning, robust financial metrics, and alignment with national renewable energy goals make it a compelling investment. Potential policy support and international growth initiatives further strengthen the investment thesis.
Choice International Limited – Equity Research Report
Choice International Limited
Value Pick : Best stock to buy today : India’s leading financial services conglomerate
Executive Summary
Choice International Limited (Choice) has emerged as a leading financial services conglomerate in India with diversified operations spanning stock broking, insurance distribution, MSME lending, and government advisory services. The company’s robust financial performance, expanding market presence, and investment in technology-driven solutions position it well for sustainable long-term growth.
₹10,975 Cr
Market Capitalization
₹550
Current Price
71.6
P/E Ratio
24.8%
ROCE
Financial Performance Highlights
Q2 FY25 vs Q2 FY24
Revenue from Operations grew by 29.6% to ₹2,492 Mn. EBITDA increased by 51% to ₹777 Mn, with margins improving to 31.16%. PAT rose by 56% YoY to ₹465 Mn.
Stock Broking: Expanding presence in Tier III and below geographies
Insurance Distribution: 131% YoY growth in policies sold
MSME Lending: Recent acquisitions of Paisobuddy and Sureworth
Government Advisory: Substantial infrastructure consulting order book
2. Operational Metrics
30.2% Operating Profit Margin and 23.6% Return on Equity highlight strong operational efficiency. Continuous focus on client-centric innovations.
3. Tech-Driven Expansion
Proprietary digital tools enhance customer engagement with upcoming features like family mapping and simplified auto-pay journeys.
Future Projections
Projected revenue CAGR of 30-35% over the next three years. PAT growth expected to sustain at 50-55%. Pan-India expansion through 168 branch offices.
Investment Recommendation
Rating: BUY (Long-Term Horizon)
Target Price: ₹750 (12-month horizon)
Upside Potential: ~36% from current market price of ₹550
Disclaimer
This report is for informational purposes only and should not be considered as investment advice. The information contained herein is based on sources believed to be reliable, but no guarantee is made as to its accuracy. Investors should conduct their own research and consult with financial advisors before making investment decisions. Past performance is not indicative of future results.