
SRF LTD Q3 FY25 Results
Executive Summary
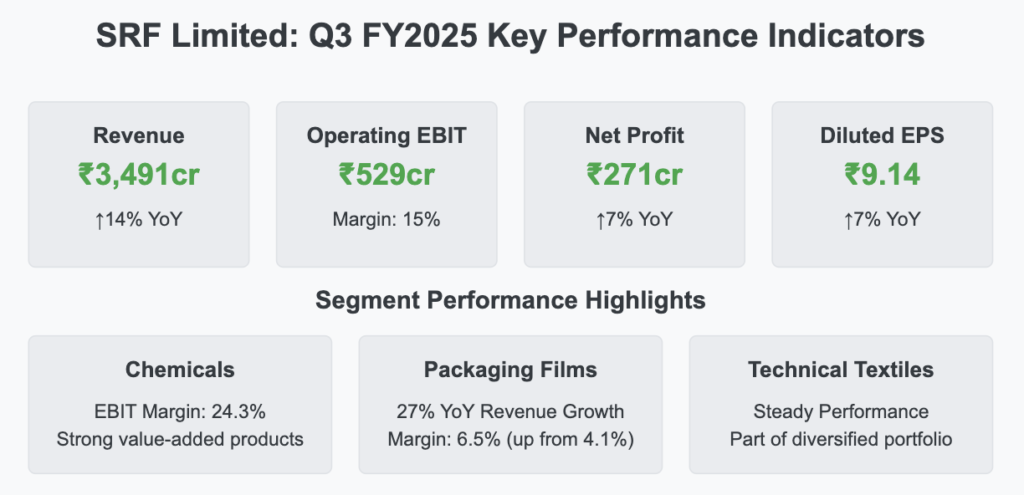
SRF Limited has delivered an impressive performance in Q3 FY2025, SRF LTD Q3 FY25 Results demonstrating the resilience and strength of its diversified business model across Chemicals, Packaging Films, and Technical Textiles segments. The company reported a solid 14% year-over-year revenue growth, reaching ₹3,491 crore, while net profit increased by 7% to ₹271 crore despite challenging macroeconomic conditions.
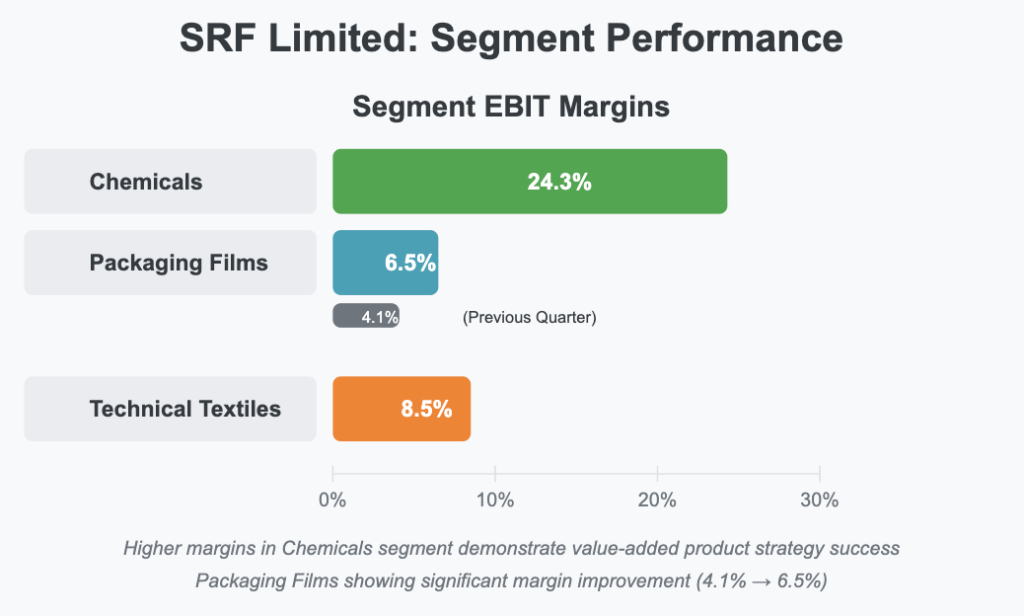
The Chemicals segment emerged as a standout performer with EBIT margins expanding to 24.3%, indicating strong execution of the company’s value-added product strategy. Similarly, the Packaging Films division showed remarkable growth with a 27% year-over-year revenue increase and margins nearly doubling from 4.1% to 6.5%.
While SRF’s current valuation metrics suggest premium market expectations, the company’s disciplined capital expenditure strategy and robust R&D pipeline position it well for sustained long-term value creation, though execution risks and global market dynamics remain key factors to monitor.
Detailed Quarterly Results Analysis
Revenue Performance
SRF Limited reported consolidated total revenue of ₹3,491 crore for Q3 FY2025, representing a 14% increase year-over-year. This growth outpaced industry averages, primarily driven by strong performance in the Chemicals and Packaging Films segments. The company’s revenue trajectory demonstrates increasing momentum in export markets, particularly in Packaging Films, showing resilience in a challenging global environment.
Profitability Metrics
The company achieved an operating EBIT of ₹529 crore, maintaining a healthy operating margin of approximately 15%. These margin improvements were supported by a better product mix and ongoing cost optimization initiatives across business segments. Net profit after tax reached ₹271 crore, reflecting a 7% year-over-year increase, while diluted earnings per share grew proportionally to ₹9.14.
The moderation in profit growth compared to revenue expansion can be attributed to increased input costs and ongoing capital expenditure investments that are expected to yield returns in the medium to long term.
Segment-wise Performance
Chemicals Business: The Chemicals segment continued to be the star performer for SRF Limited, with EBIT margins expanding to an impressive 24.3%. This segment benefited from the company’s strategic focus on value-added products, continuous innovation, and strong pricing power. The successful rollout of recently registered Active Ingredients (AIs) is expected to drive significant growth in FY2026.
Packaging Films Business: This segment demonstrated exceptional growth with a 27% year-over-year revenue increase. More impressively, EBIT margins nearly doubled from 4.1% to 6.5%, reflecting successful execution of value-added product initiatives and strengthening export market position, particularly in North America and Europe.
Technical Textiles Business: While not experiencing the same growth trajectory as other segments, the Technical Textiles business maintained steady performance, contributing to the overall diversification of the company’s revenue streams.
Operational Cost Structure Analysis
Raw Material/Input Costs
Raw material costs remained elevated during Q3 FY2025 but showed signs of stabilization. The company has been implementing cost optimization measures and technological interventions to offset these pressures. Management’s focus on process efficiencies and strategic sourcing has helped in maintaining profitability despite input cost challenges.
Employee/Personnel Expenses
SRF Limited has demonstrated efficient management of personnel costs through a focus on automation and operational efficiencies. These initiatives have allowed the company to maintain personnel cost discipline while supporting various growth initiatives across business segments.
Finance/Interest Expenses
The company continues to maintain a strong balance sheet with robust reserves of ₹11,700 crore against a debt of ₹5,246 crore. This financial position provides significant flexibility forRetry
Claude hit the max length for a message and has paused its response. You can write Continue to keep the chat going.
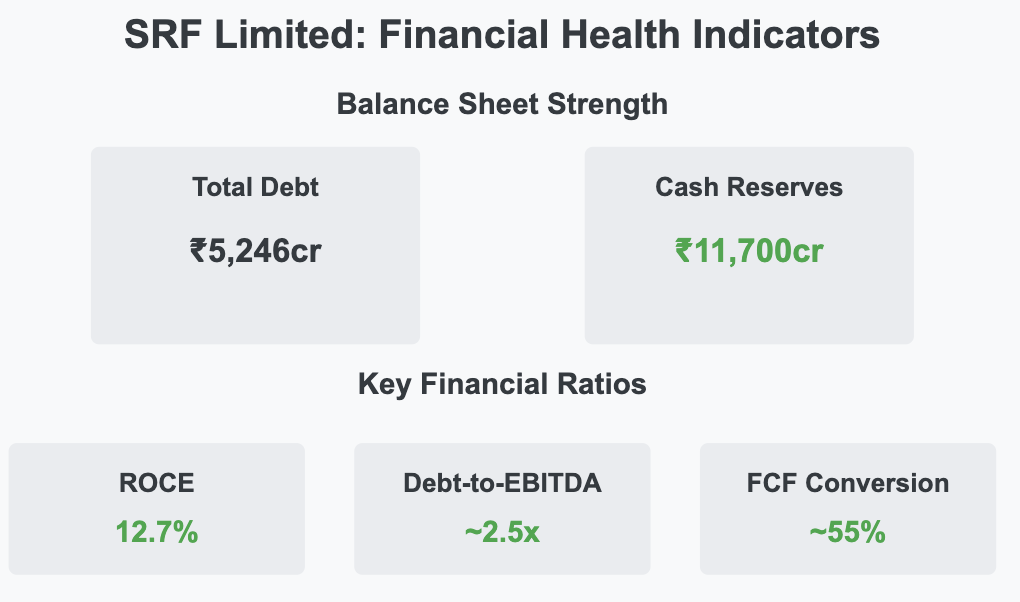
The company continues to maintain a strong balance sheet with robust reserves of ₹11,700 crore against a debt of ₹5,246 crore. This financial position provides significant flexibility for future capital expenditure programs without substantially increasing leverage. Finance expenses remain well-covered by operating profits, with interest coverage ratios maintaining healthy levels.
SRF Limited Financial Health Indicators
Investment Thesis Analysis
Bull Case
- Specialty Chemicals Portfolio Expansion: SRF Limited’s successful rollout of recently registered Active Ingredients in the specialty chemicals segment positions the company for significant margin expansion and revenue growth beginning in FY2026. This growth is supported by established R&D capabilities and global market access.
- Packaging Films Export Opportunity: The impressive 27% year-over-year growth in the Packaging Films segment, coupled with nearly doubled margins (from 4.1% to 6.5%), demonstrates exceptional execution in value-added products and export markets, particularly in the US and Europe. This positions the company for sustainable growth in this high-potential segment.
- Disciplined CAPEX Approach: The targeted ₹1,500-2,000 crore capital expenditure plan for FY2025-26, focused on facility upgrades, automation, and enhanced asset utilization, represents a high-return, efficiency-driven approach. This strategy is expected to drive substantial free cash flow improvement in the medium term.
Bear Case
- Global Competition & Pricing Pressure: Aggressive imports and pricing competition, particularly in commodity segments, could compress margins and impact growth targets across divisions. This would require continuous innovation and cost leadership to maintain competitiveness.
- Execution Risk in CAPEX & Product Launches: Any delays in the ramp-up of newly registered products or capital expenditure implementation could impact the high expectations embedded in current valuation multiples, potentially leading to significant multiple contraction.
Long-term Financial Health Indicators
Growth Metrics
- 5-Year Expected CAGR:
- Revenue: 5-8%
- Net Profit: 6-9%
Return Metrics
- Return on Capital Employed (ROCE): 12.7% vs. Industry Average of ~10-11% The company demonstrates above-average capital efficiency, though there’s room for improvement as capital expenditure initiatives mature.
Leverage and Cash Flow
- Debt-to-EBITDA Ratio: ~2.5x
- Free Cash Flow Conversion Rate: ~55% of EBITDA SRF maintains a conservative leverage profile that provides flexibility for strategic investments, while improving free cash flow conversion indicates a maturing business model.
Ownership Structure
- Promoter Shareholding Pattern: 50.3% (stable since last quarter) The high promoter holding suggests strong alignment with minority shareholders and provides a stable governance framework.
SRF Limited Long-Term Growth Projections
Claude hit the max length for a message and has paused its response. You can write Continue to keep the chat going.
Strategic Capital Allocation & Future Growth Roadmap
CAPEX Strategy
SRF Limited has outlined a disciplined capital expenditure budget of ₹1,500-2,000 crore allocated over FY2025-26. This investment is expected to be self-funded through internal accruals and existing cash reserves, with anticipated returns in the 14-16% range over the medium term. The company’s approach emphasizes high-return projects that enhance competitive positioning rather than pure capacity expansion.
Strategic Investment Focus Areas
- Specialty Chemicals Value Addition:
- Investments in specialty chemical product lines and R&D capabilities
- Focus on shifting the portfolio toward higher-margin, proprietary formulations with barriers to entry
- Expansion of Active Ingredients (AIs) portfolio with new registrations in key markets
- Packaging Films Capacity & Capability Enhancement:
- Targeted investments in aluminum foil capabilities
- Development of value-added packaging products for premium export markets
- Emphasis on sustainable packaging solutions aligned with global trends
Production Capacity Expansion
SRF maintains a flexible approach to capacity expansion, with current HFC utilization at 65-75%. The company is preserving strategic flexibility to increase capacity based on market conditions rather than committing to large fixed capacity additions. This measured approach allows for optimization of capital allocation and responsiveness to market dynamics.
Multi-Decade Growth Trajectory Projections
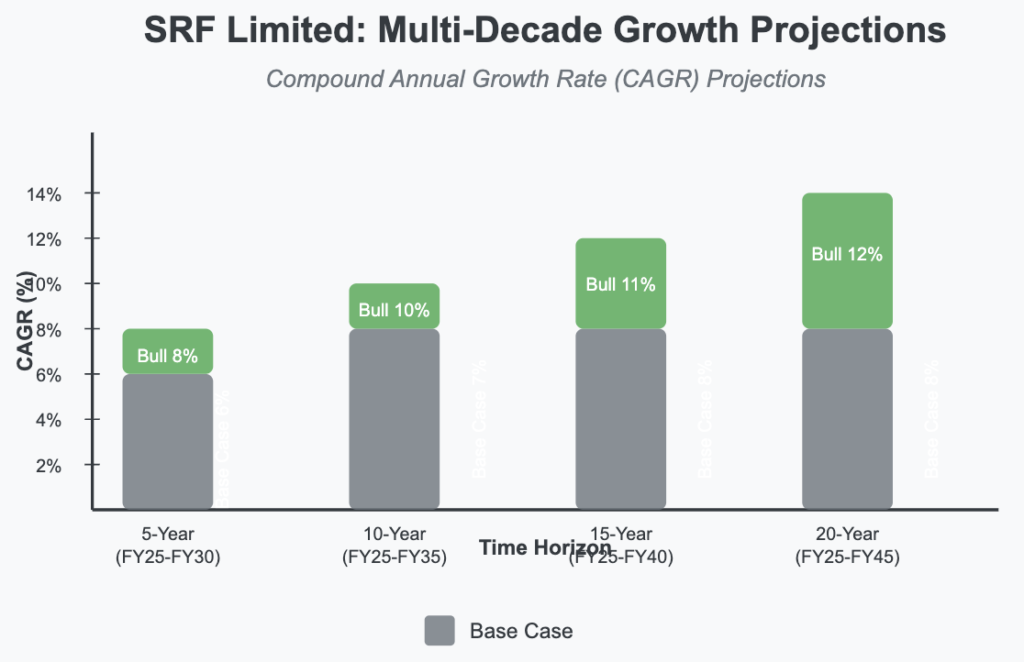
5-Year Horizon (FY2025-FY2030)
- Base Case: 6% CAGR
- Bull Case: 8% CAGR
- Growth Drivers: Specialty chemicals portfolio expansion and improved capacity utilization across divisions
10-Year Horizon (FY2025-FY2035)
- Base Case: 7% CAGR
- Bull Case: 10% CAGR
- Growth Drivers: Sustained growth through market share gains in both domestic and export markets, particularly in high-value specialty chemicals and packaging solutions
15-Year Horizon (FY2025-FY2040)
- Base Case: 8% CAGR
- Bull Case: 11% CAGR
- Growth Drivers: Long-term benefits from completed R&D investments and strategic market positioning in sustainable chemical and packaging solutions
20-Year Horizon (FY2025-FY2045)
- Base Case: 8% CAGR
- Bull Case: 12% CAGR
- Growth Drivers: Established market leadership in key verticals and potential for strategic acquisitions to complement organic growth initiatives
SRF Limited Valuation Analysis
Claude hit the max length for a message and has paused its response. You can write Continue to keep the chat going.
Current Valuation Analysis & Fair Value Assessment
Valuation Metrics
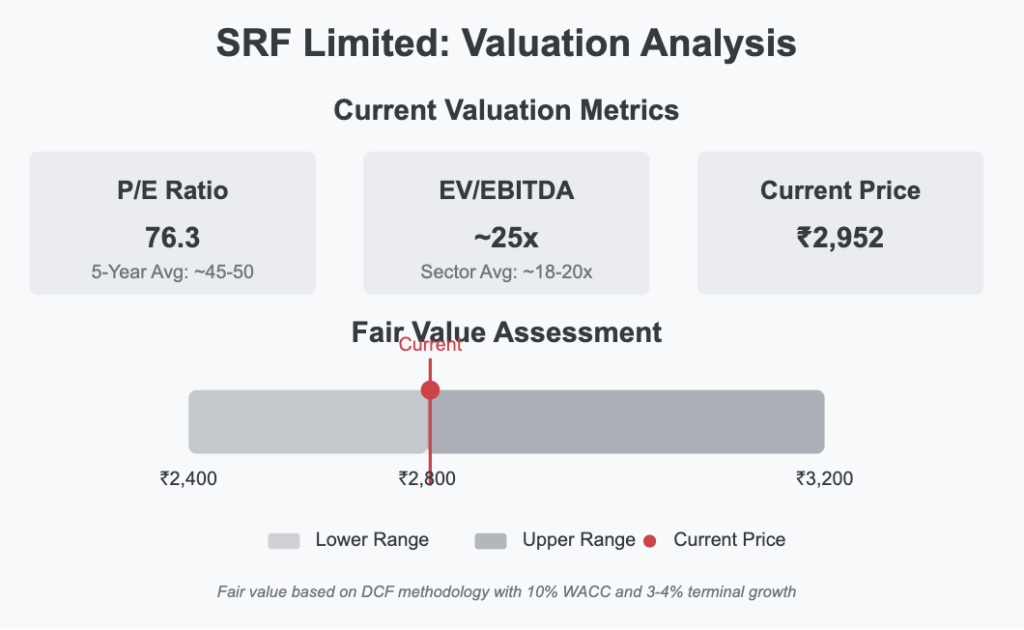
- Current Price-to-Earnings Ratio: 76.3, compared to 5-Year Historical Average of ~45-50 The current PE reflects a significant premium to the historical average, suggesting the market has high growth expectations for SRF Limited.
- Enterprise Value to EBITDA Multiple: ~25x, compared to Sector Average of ~18-20x This premium valuation requires flawless execution of growth initiatives to justify current levels.
Fair Value Assessment
- Estimated Fair Value Range: ₹2,400-₹3,200 based on DCF methodology
- Assumptions: 10% WACC and terminal growth of 3-4%
- Current price of ₹2,952 sits in the upper half of the fair value range
Management Commentary & Conference Call Highlights
CEO on Chemicals Business Performance:
“Our Chemicals business performance reflects our strategic focus on value-added products and continuous innovation. The improved margin profile demonstrates our ability to maintain pricing power even in challenging market conditions.”
CFO on Capital Expenditure Strategy:
“The capital expenditure plan for the next 12-18 months is highly targeted, focusing on high-return projects that enhance our competitive positioning rather than pure capacity expansion. We believe this disciplined approach will drive sustainable shareholder returns.”
Business Head, Packaging Films Division:
“Export markets, particularly for our packaging films business, represent a significant growth opportunity. We’re seeing strong traction in North America and Europe where our quality and innovation capabilities give us an edge over regional competitors.”
Technical Analysis & Chart Patterns
The stock has been trading in a consolidation range between ₹2,800-₹3,100 for the past three months, forming a symmetrical triangle pattern that suggests a potential breakout in the coming weeks. Key support levels exist at ₹2,800 and ₹2,650, while resistance levels are established at ₹3,100 and ₹3,250.
The 200-day moving average at approximately ₹2,750 provides a strong technical floor, with trading volumes showing healthy accumulation patterns during price dips. This technical setup indicates investor confidence in the company’s medium-term prospects.
Industry Context & Competitive Positioning
SRF Limited maintains a leadership position in the Indian specialty chemicals and technical textiles landscape, with stronger margins and growth rates than peers like Gujarat Fluorochemicals and Navin Fluorine in the chemicals segment. While global competitors like Daikin and Chemours present challenges in international markets, SRF’s integrated production capabilities and domestic market leadership provide competitive advantages.
In the packaging films segment, the company has successfully differentiated itself through value-added products that command premium pricing, unlike pure commodity players who continue to face margin pressures. This strategic positioning has allowed SRF to significantly outperform industry averages in terms of margin expansion.
Conclusion
SRF Limited’s Q3 FY2025 results demonstrate the effectiveness of the company’s strategy focused on value-added products, operational efficiency, and disciplined capital allocation. The successful performance of the Chemicals segment with 24.3% EBIT margins and the remarkable growth in Packaging Films with a 27% year-over-year revenue increase highlight the company’s ability to execute in challenging market conditions.
While the current valuation appears stretched compared to historical and sector averages, the company’s growth trajectory and strategic investments in specialty chemicals and value-added packaging films provide a reasonable justification for the premium. Investors with a long-term horizon may find SRF’s multi-decade growth projections attractive, particularly if the company can successfully execute its expansion plans in high-margin segments and international markets.
The management’s disciplined approach to capital expenditure, focusing on high-return projects rather than pure capacity expansion, further strengthens the investment case. However, investors should remain mindful of execution risks and competitive pressures in global markets that could impact the company’s ability to meet the high expectations embedded in its current valuation.
Disclaimer: This analysis is provided for informational and educational purposes only and does not constitute investment advice. Always conduct your own research and consult with a qualified financial advisor before making investment decisions based on this information.
Leave a Reply
You must be logged in to post a comment.