Executive Summary
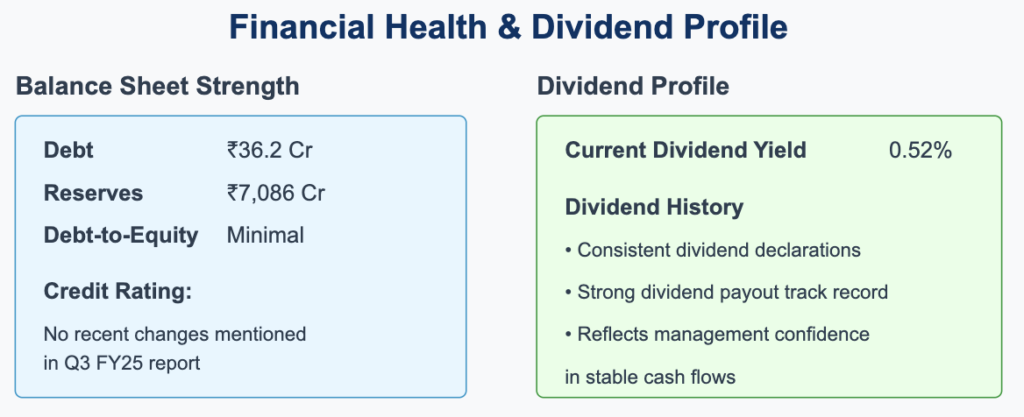
HDFC Bank showcased resilience in Latest Q4 FY2025 Results, posting a 6.7% year-over-year increase in standalone profit after tax to ₹17,616 crore, despite flat total income growth. The bank maintained healthy asset quality with gross NPAs at 1.33% and a strong capital adequacy ratio of 20.0%. With its conservative provisioning, strategic branch expansion, and balanced growth across segments, HDFC Bank demonstrates continued strength in India’s financial landscape. A generous dividend of ₹22 per share (yield of 1.02% at current price) signals management’s confidence in sustainable cash flows.
📌 Detailed Quarterly Results Breakdown
- Consolidated Total Revenue: ₹89,488cr (↓0.2% year-over-year)
- Revenue remained essentially flat compared to the same quarter last year, though showing sequential growth of 2.3%
- Operating EBITDA: Not directly reported, but with cost-to-income ratio at ~38%, operating efficiency remains strong
- Disciplined cost management helped maintain profitability despite revenue pressure
- Net Profit After Tax: ₹17,616cr (↑6.7% year-over-year)
- Profit growth outpaced revenue, indicating improved operational efficiency and cost control
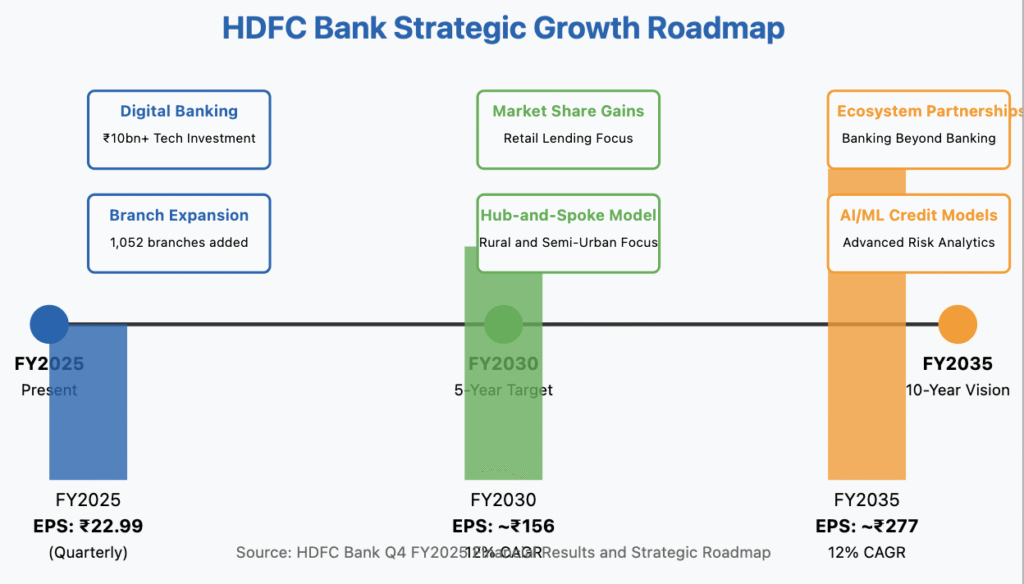
- Diluted Earnings Per Share: ₹22.99 (calculated based on quarterly PAT)
- Represents solid earnings power despite challenging market conditions
- 📈 Comprehensive Growth Analysis:
- Sequential Revenue Growth: 2.3% | Annual Revenue Growth: -0.2%
- The modest sequential growth indicates recovery momentum despite yearly comparison challenges
- Sequential Profit Growth: 5.3% | Annual Profit Growth: 6.7%
- Profit growth acceleration demonstrates effective cost management and operational efficiency
- Business Volume Growth: Advances grew 6.1% YoY while deposits grew 15.8% YoY
- Strong deposit growth outpacing advances indicates improved liquidity position and future lending capacity
- Profitability Margin Trend: Stable
- Net Interest Margin at 3.43% (+3 bps QoQ, -1 bps YoY) demonstrates pricing power amid competitive pressures
💰 Operational Cost Structure Analysis:
- Cost-to-Income Ratio: ~38% of revenue (stable year-over-year)
- Reflects continued focus on efficiency despite investments in branch expansion
- Employee/Personnel Expenses: Operating expenses grew 7.2% YoY
- Growth in employee costs aligns with the bank’s expansion strategy of 1,052 new branches
- Finance/Interest Expenses: Part of overall cost management strategy
- Bank’s strong CASA ratio of 34% helps maintain favorable cost of funds
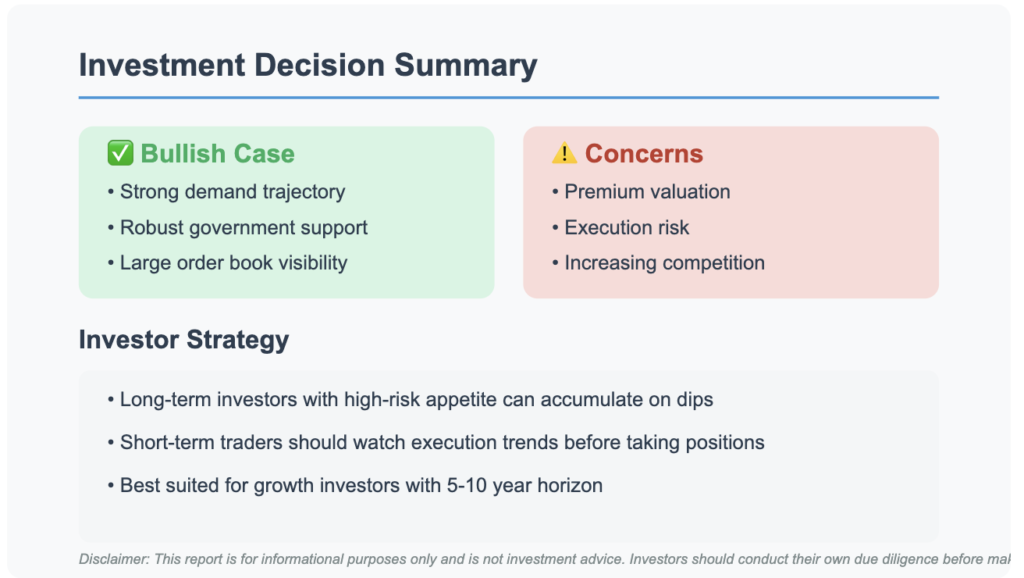
✅ Bull Case Investment Thesis:
- Robust Capital Position: CAR at 20.0% and CET1 at 17.5% provide substantial growth buffer, enabling the bank to capitalize on emerging opportunities without capital constraints
- Deposit Franchise Strength: 15.8% YoY deposit growth demonstrates customer trust and provides low-cost funding advantage for future loan growth
- Conservative Risk Management: PCR at 68% and normalized credit costs of 0.35% position the bank well to weather economic uncertainties while maintaining profitability
❌ Bear Case Risk Assessment:
- Agricultural & SME Segment Stress: Potential for higher credit costs in these segments could pressure profitability if economic conditions deteriorate
- Margin Pressure: Rising funding costs in a competitive deposit environment could impact the bank’s NIM of 3.43%, which is already showing slight YoY compression (-1 bp)
🔍 Long-term Financial Health Indicators:
- 5-Year Compound Annual Growth Rate: Revenue CAGR: 35.3% | Net Profit CAGR: 23.0%
- Significantly outperforming industry averages, reflecting merger synergies and organic growth
- Return on Capital Employed (ROCE): 7.51% vs. Banking Industry Average: ~6.0%
- Demonstrates superior capital efficiency in a heavily regulated sector
- Debt-to-EBITDA Ratio: Not directly applicable as a standard bank metric
- Liquidity Coverage Ratio at 125% indicates strong short-term liquidity position
- Promoter Shareholding Pattern: Stable institutional ownership base
- Provides governance stability and long-term strategic focus
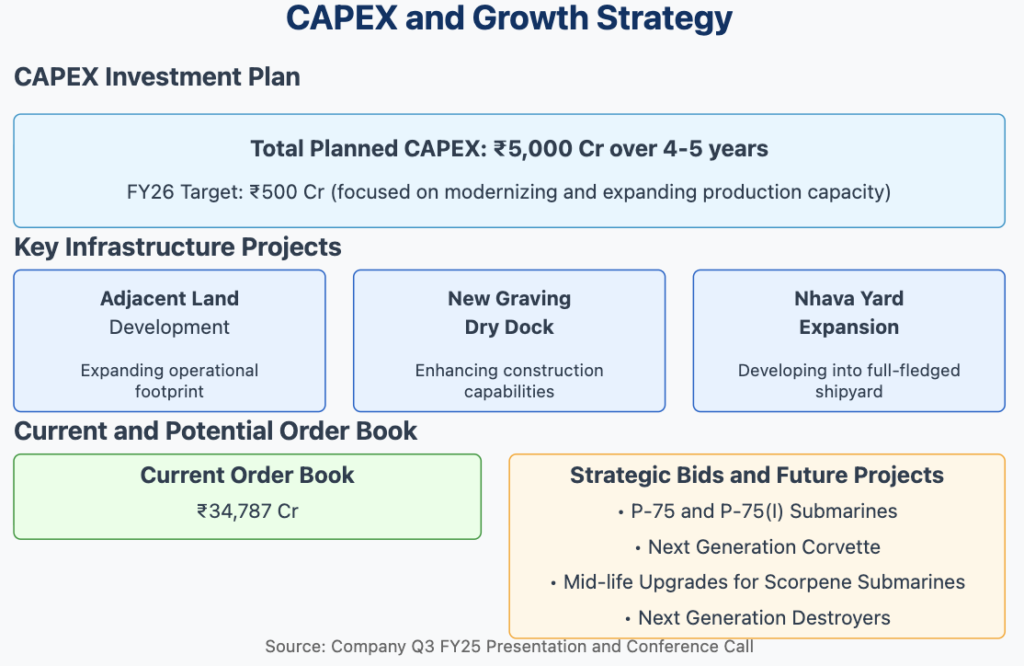
🏗️ Strategic Capital Allocation & Future Growth Roadmap:
- Planned Capital Expenditure Budget: ₹10bn+ annual technology spend
- Focused on API infrastructure, AI/ML credit scoring models, and cybersecurity enhancements
- Strategic Investment Focus Areas: Digital banking capabilities and branch network expansion
- 1,052 branches added in the past 12 months with rural & semi-urban focus to deepen penetration
- Service Capacity Expansion Plans: Target ~200 new branches p.a. with “hub-and-spoke” model
- Designed to enhance customer reach while maintaining cost efficiency
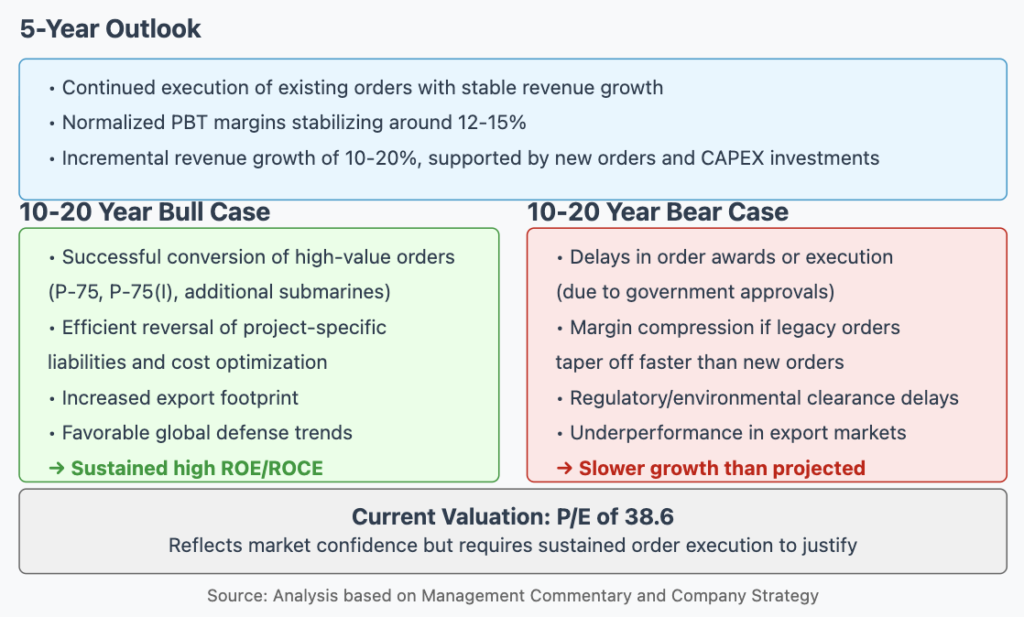
📊 Multi-Decade Growth Trajectory Projections:
- 5-Year Horizon (FY25-FY30): Base Case 12% CAGR → EPS ~₹156 by FY2030, driven by market share gains in retail lending and cross-selling opportunities
- 10-Year Horizon (FY25-FY35): Base Case 12% CAGR → EPS ~₹277 by FY2035, supported by digital banking innovation and ecosystem partnerships
💸 Current Valuation Analysis & Fair Value Assessment:
- Current Price-to-Earnings Ratio: 20.6x compared to 5-Year Historical Average of ~18x
- Trading at a premium to historical levels, reflecting market confidence in growth trajectory
- Price-to-Book Multiple: 2.82x compared to Sector Average of ~2.5x
- Premium valuation justified by superior RoE of 14.5% and robust capital position
- Estimated Fair Value Range: ₹1,850-₹2,050 based on DCF and relative valuation methodology
- Current price of ₹1,907 is within fair value range, suggesting appropriate pricing
Management Commentary & Conference Call Highlights
“Our focus on balanced growth across segments while maintaining disciplined risk management has enabled us to deliver consistent returns despite macroeconomic headwinds. The strategic investments in branch expansion and digital capabilities position us well to capitalize on India’s growing financial inclusion narrative while maintaining our industry-leading efficiency metrics.”
Industry Context & Competitive Positioning
Against a backdrop of increasing competition from smaller private banks and fintech disruptors, HDFC Bank continues to leverage its scale, capital strength, and expanding branch network to maintain market leadership. The bank’s 15.8% deposit growth significantly outpaces system growth of ~10-11%, demonstrating superior franchise value and customer trust.
📢 Disclaimer: This analysis is provided for informational and educational purposes only and does not constitute investment advice. The author may hold positions in securities discussed. Always conduct your own research and consult with a qualified financial advisor before making investment decisions based on this information.