Revenue from operations: ₹ 4,259.53 million (↑482% YoY from ₹ 731.43 million)
Other income: ₹ 28.90 million
Total income: ₹ 4,288.43 million
Total expenses: ₹ 3,453.41 million
Profit before tax: ₹ 875.02 million (approx.; 20.4% margin)
Net profit after tax: ₹ 991.92 million vs. loss of ₹ 401.70 million last year
Comment: A strong swing to profitability in Q4, driven by ramp‑up in CDMO revenues and tight cost controls.
2. Latest Results Highlights
Turnaround performance: From cumulative losses in prior quarters to PAT of ₹ 991.92 million.
High operating leverage: Fixed‑cost dilution delivered >20% net margin.
Cash flow improvement: Operating cash outflow of ₹ 472.83 million in standalone vs. heavy capex in prior year .
Balance sheet strength: Consolidated current assets exceed liabilities by only ₹ (273.82) million, reflecting working‑capital tightness .
3. Key Metrics
Metric
Value
Market Cap
₹ 18,985 Cr.
Current Price
₹ 1,659
52‑wk High / Low
₹ 1,800 / ₹ 1,163
P/E (x)
232
Book Value
₹ 514
Dividend Yield
0.00 %
ROCE
5.39 %
ROE
2.60 %
Net Debt
₹ 942 Cr.
Reserves
₹ 5,869 Cr.
Promoter Holding
34.2 %
Pledged by Promoters
20.1 %
3‑yr Sales CAGR
124 %
3‑yr Profit CAGR
33 %
3‑yr Δ in Promoter Holding
–
Data per company disclosures and stock exchanges.
4. Valuation & Dividend
Rich valuation (P/E 232×): Reflects high-growth expectation in CDMO space, but leaves limited margin of safety.
No dividend payout: Zero yield underlines reinvestment focus.
5. CAPEX & Growth Strategy
FY2025 standalone capex: ~₹ 863 million on plant & equipment .
Major initiatives:
Singapore consolidation: Scheme to merge Stelis Pte and Strides Softgel Pte into Onesource Pte to streamline CDMO footprint .
Expansion of biologics and small‑molecule capacity in Bengaluru and Navi Mumbai.
MSAs signed: Multiple Manufacturing Services Agreements poised to convert into long‑term commercial supplies .
6. Long‑Term Projections & Returns
Horizon
Assumed Revenue CAGR
Implied Revenue (₹ Cr)
Implied Share Price (₹)¹
CAGR Return
5 years
20 %
3,294
2,500
~10 % p.a.
10 years
18 %
9,738
4,500
~9 % p.a.
15 years
15 %
22,916
7,500
~8 % p.a.
20 years
12 %
49,409
12,000
~7 % p.a.
¹ Valuation uplift to 50× forward EPS, conservative over time.
Take‑away: Even with rapid top‑line growth, multiyear returns moderate given high current valuation.
7. Management Quality & Governance
Board strength: Seasoned directors (including Trisha A. Bote – Company Secretary) and audit by Deloitte Haskins & Sells .
Strategic clarity: Quick execution of NCLT‑approved scheme, zero debt on NCDs post‑redemption.
Governance: No credit‑rating changes announced; debt fully redeemed in Nov 2024.
8. Future Growth Plans & Expansions
Diversified CDMO offerings: Move from small molecules to biologics fills a unique niche.
Geographic reach: Consolidation in Singapore enables stronger FDA/EMA market access.
R&D pipeline partnerships: Several late‑stage projects under confidentiality, potential upside.
9. Conclusion
OneSource Specialty Pharma delivers a credible turnaround in Q4 FY2025, underpinned by its CDMO thrust and operational discipline. While growth prospects remain robust, the current valuation demands cautious entry. Investors should weigh near‑term momentum against multiyear returns at a stretched P/E.
Disclaimer: This report is for informational purposes only and does not constitute investment advice. Always conduct your own due diligence before making investment decisions.
Stock Research Report – May 2025 Prepared by: Independent Equity Research Desk
Q4 FY2025 Results Overview
United Breweries Limited (UBL), India’s leading beer manufacturer, delivered a steady performance in Q4 FY2025, riding on volume recovery and premiumization despite an inflationary raw material environment.
Revenue: ₹2,343 Cr, reflecting a growth of 9.2% YoY.
EBITDA: ₹237 Cr, up by 11.5% YoY, supported by price hikes and improved operational efficiencies.
EBITDA Margin: Marginally improved to 10.1% from 9.8% last year.
Profit After Tax (PAT): ₹127 Cr, marking a 13.4% YoY growth.
Volumes recovered sequentially, especially in key states like Maharashtra, Karnataka, and Telangana. The company’s premium beer segment (led by Kingfisher Ultra and Heineken Silver) grew faster, contributing meaningfully to margins.
Key Highlights and Metrics (As of May 2025)
Metric
Value
Market Cap
₹57,688 Cr
Current Price
₹2,182
52-Week High / Low
₹2,300 / ₹1,810
Stock P/E
125x
Book Value
₹165
Dividend Yield
0.46%
ROCE
13.9%
ROE
10.8%
Debt
₹620 Cr
Reserves
₹4,337 Cr
Sales Growth (TTM)
9.76%
Profit Growth (TTM)
12.2%
Promoter Holding
70.8%
Pledged Shares
12.4%
Valuation Perspective
At a trailing P/E of 125x, UBL commands a premium over peers, justified partially by its market leadership (~50% share in Indian beer market) and strong brand equity. However, current valuation appears stretched against historical averages (70-80x P/E), implying limited short-term upside unless earnings growth accelerates.
Dividend Yield stands modest at 0.46%, aligning with its growth-oriented stance and ongoing CAPEX commitments.
CAPEX & Growth Strategy
UBL is executing a calibrated CAPEX cycle of approximately ₹600-700 Cr over FY2025-27 to:
Expand capacity in key consumption states (Odisha, Telangana, UP).
Strengthen its premium portfolio through new product launches (Heineken Silver and Kingfisher Ultra Max variants).
Invest in green technologies to cut water and energy usage by 20% by FY2027.
The company is targeting double-digit volume growth driven by market share gains in North & East India, and premiumization-led margin expansion. This marks a structural shift in their strategy, tilting towards premium beers which command 3-5% higher margins.
Long-Term Projections (5-20 Years Outlook)
Period
Sales CAGR
PAT CAGR
Expected Stock Return
5 Years
~11-13%
13-15%
~14-16% CAGR
10 Years
~10-11%
12-13%
~13-14% CAGR
15 Years
~9-10%
11-12%
~12-13% CAGR
20 Years
~8-9%
10-11%
~11-12% CAGR
If premiumization sustains and beer category penetration deepens (currently under 10% of India’s alcohol market), UBL has potential for multidecade growth. However, near-term returns will hinge on margin stabilization and volume pickup in tier-2 and rural India.
Management Quality & Credit Rating
UBL enjoys strong parentage from Heineken (global beer giant holding majority control). Management execution has been sound, demonstrated by:
Smooth transition post Heineken takeover.
Cost rationalization amidst commodity inflation.
Focused CAPEX execution.
Credit Rating: No recent downgrades or upgrades noted. Current debt levels are modest at ₹620 Cr with robust cash reserves, ensuring comfortable servicing.
Future Plans & Expansion Roadmap
UBL’s future blueprint is underpinned by:
Expanding manufacturing footprint in emerging beer-consuming states.
Growing premium share to 30% of overall sales by FY2027 from current 22%.
Deploying digital initiatives (e-commerce in legal states) and leveraging tech for supply chain efficiencies.
ESG goals targeting carbon neutrality by 2040, indicating a sustainability-driven roadmap.
Investment Summary
United Breweries stands tall as a market leader in India’s structurally growing beer market. While valuations are rich, its brand strength, premiumization strategy, and balance sheet health make it a compelling long-term compounder.
For investors with a 10-20 year horizon, UBL offers exposure to India’s rising per capita beer consumption story. However, near-term upside may be capped unless earnings growth accelerates beyond current expectations.
Disclaimer
This research report is for informational purposes only and does not constitute investment advice or recommendation to buy or sell securities. Investors must do their own due diligence or consult their financial advisors before taking investment decisions. Past performance is not indicative of future results.
Valuation at ~32× P/E reflects premium growth; justified by sustained 25–30% AUM growth and high ROE.
Dividend Policy: Pursuant to policy, Board has recommended final dividend of ₹44 / share (2,200%) plus special interim of ₹12 / share—total yield ~0.9%.
Share Sub-Division & Bonus: Proposal to split ₹2 → ₹1 shares and issue 4 bonus shares per existing share enhances retail liquidity.
4. CAPEX & Growth Strategy
CAPEX Run-Rate: FY25 investment in IT, branches and digital platforms ~₹1,030 Cr.
Digital & FINAI Roadmap: Commitment to deploy >100 AI/ML applications in FY26 across underwriting, customer acquisition and risk monitoring.
Network Expansion: Added 118 new locations in FY25; branch network now >4,200 locations with 232K distribution points.
5. Long-Term Projections & Returns
Time Horizon
AUM CAGR
PAT CAGR
Implied Share Price CAGR*
5 years
22–24%
18–20%
~15% p.a.
10 years
18–20%
15–17%
~14% p.a.
15 years
16–18%
14–16%
~13% p.a.
20 years
15–17%
13–15%
~12% p.a.
*Assumes re-investment of dividends and moderate re-rating over time.
6. Management Quality & Governance
Leadership Team: Recent promotions of three Deputy CEOs underscore succession planning.
Track Record: Delivered >25% AUM & customer growth over 15 years while maintaining sub-1% NPAs.
Governance: Unmodified audit opinions; Chairman & CEO separation; active Investor Advisory Council.
7. Credit Ratings Update
S&P Global (17 Mar 2025): Upgraded issuer rating to “BBB-/Positive”; SACP to “BBB”.
Moody’s: Assigned Baa3/P-3 long/short term with Stable outlook—reflects strong capitalization and asset quality.
8. Future Growth Plans
New Business Lines: Expansion in Gold Loans, Vehicle Finance, and Co-lending partnerships.
Geography: Deepen presence in underserved rural and semi-urban markets via micro-branches.
Technology: Launch end-to-end digital lending on Finserv App—aim for 100 million+ active users.
Shareholder Returns: Total Return ~20–25% p.a. over medium term (including dividends).
20-Year Equity CAGR: Target 12–15% p.a., driven by compounding of earnings and multiple expansion.
10. Conclusion
Bajaj Finance continues to combine high-growth potential with robust asset quality and strong capital buffers. Its leadership in retail lending, aggressive digital and AI investments, and disciplined risk management make it a compelling pick for long-term investors seeking sustainable wealth creation.
Disclaimer: This report is for informational purposes only and does not constitute investment advice. Investors should conduct their own due diligence or consult a professional advisor before making any investment decisions.
EV: Expanded iQube line (2.2 kWh, 3.4 kWh, 5.1 kWh batteries) across key markets; King EV Max (179 km range, 2h15m fast-charge, SmartXonnect) launched.
Premium: Continued global roll-out of Norton Motorcycles (fresh models in ’25–’27).
Geographical Expansions
Exports: Sharpened focus on LatAm (including Brazil), North Africa (Morocco), Southeast Asia; Africa market share momentum.
Strategic JV: Micro-mobility tie-up with Hyundai at Bharat Mobility Global Expo.
Aftermarket & Financial Services
TVS Credit: Book size ₹ 27,190 Cr (+7% y-o-y); PBT ₹ 321 Cr (+40%) with 3 million new customers .
Diversification into used-vehicle loans and unsecured lending via data analytics.
4. CAPEX & Growth Strategy
FY 25 Capex: ₹ 1,300 Cr focused on capacity expansion, R&D (software/EV), digitalization and global footprint.
PLI: Full-year Production-Linked Incentive (PLI) benefit recognized in Q4, to accrue quarterly from FY 26 onward.
Execution: EV charging infrastructure roll-out pace.
Disclaimer This report is for informational purposes only and does not constitute investment advice. Investors should conduct their own due diligence and consult with a qualified financial advisor before making any investment decisions.
HCLTech delivered a solid Latest Q4 FY2025 Results, with revenue of ₹30,246 Crore (+1.2% QoQ, +6.2% YoY) and profit after tax of ₹4,309 Crore . Operating margins held firm at ~21.8% (vs. 21.5% in Q3), underpinned by robust services growth and cost discipline. The Board declared an interim dividend of ₹18 per share (incl. special payout) .
2. Latest Q4 FY25 Highlights
Revenue: ₹30,246 Cr, +1.2% QoQ, +6.2% YoY
EBIT: ₹5,735 Cr (EBIT margin ~19.0%)
Profit after tax: ₹4,309 Cr, −6.2% QoQ (due to tax base), +7.9% YoY
Other Income: ₹449 Cr, stable QoQ
Cash Flow: Operating cash flow of ₹22,261 Cr; free cash flow of ₹20,?00 Cr for FY25
CAPEX: ₹1,108 Cr invested in digital, AI labs and campus expansions
Headcount: 223,000+, net addition of 2,200 employees; LTM attrition at ~12.8%
3. Key Metrics & Financial Ratios
Metric
Value
Price/Earnings (P/E)
24.9×
Price/Book (P/B)
6.2×
Dividend Yield
3.43%
ROCE
31.9%
ROE
25.2%
Net Debt / Equity
0.09×
Sales Growth (3-yr CAGR)
11.0%
Profit Growth (3-yr CAGR)
9.08%
OPM
21.8%
Debt / EBITDA
~0.3×
4. Management Updates & Growth Strategy
AI & Digital Leadership: Continued investment in “AI Force” platform, Gen AI labs with partners (SAP, ServiceNow), and integration of GitHub Copilot to accelerate internal and client-facing digitalization.
Strategic Acquisitions: Completion of HPE CTG asset acquisition bolsters edge-to-cloud engineering capabilities, particularly in Telecom and Media.
Hyperscaler Partnerships: Deepening alliances with AWS, Microsoft Azure, Google Cloud to drive cloud migrations, data analytics, FinOps and AI use cases.
Sector Focus: Strong deal momentum in Financial Services (hybrid-cloud, fraud analytics), Manufacturing (smart-factory Gen AI), Retail & CPG (e-commerce platform modernization), Life Sciences (regulatory AI platforms) and Public Services (citizen-digital hubs).
5. Planned Expansions & CAPEX Deployment
Global Delivery Centres: New development centres in Eastern Europe and Latin America to diversify talent pools.
Innovation Labs: Inaugurated SAP Business AI Lab (Germany), AI Labs (New Jersey, Noida) to co-innovate with clients on high-value AI/ML solutions.
Campus Upgrades: ₹1,108 Cr CAPEX in FY25 for data centres, security operations centres and digital-learning hubs .
Based on steady digital/AI adoption ** Assuming market maturation, slower growth tailwinds
Projected Total Returns (incl. dividends):
5-year: ~15% p.a.
10-year: ~12% p.a.
15-year: ~10% p.a.
20-year: ~9% p.a.
7. Valuation & Credit Ratings
Valuation: Trading at 24.9× P/E vs. large-cap IT peer average of ~23–24×. Premium reflects superior ROCE (31.9%), robust cash flows, high-growth AI pipeline.
Dividend: 88 consecutive quarters of payout; current yield 3.43% supports income investors.
Credit Rating: Stable credit profile; no rating changes announced in FY25 (Rating agencies continue to assign “AA”/“AA-” long-term ratings).
8. Investment Risks
Deal Conversion Cycles: Large‐deal TCV may compress; reliance on shorter-tenor wins.
Talent Retention: Elevated attrition in a tight labour market could pressure margins.
Macro Uncertainties: Geopolitical tensions and discretionary IT spend volatility.
Conclusion
HCLTech’s Q4 FY25 performance underscores resilient revenue growth, margin resilience and world-class cash generation. With accelerated AI/digital investments, strategic acquisitions and strong guidance, the stock presents an attractive mix of growth and yield. Current valuation is justified by premium returns on capital and sustained dividend payouts.
Disclaimer: This report is for informational purposes only and does not constitute investment advice. Investors should conduct their own due diligence or consult a financial adviser prior to any investment decision.
Anant Raj Limited, a key player in India’s real estate development sector, has released its audited financial results for the quarter and year ended March 31, 2025. The company has showcased robust growth in revenue and profitability, underpinned by its strategic focus on real estate projects, particularly in the National Capital Region (NCR). This report analyzes the company’s financial metrics, recent developments, and future outlook to provide investors with a comprehensive view of its investment potential.
Financial Performance
For FY 2024-25, Anant Raj Limited reported consolidated revenue from operations of ₹2,060 Cr., reflecting a strong year-on-year sales growth of 38.9%. The profit after tax (PAT) reached ₹426 Cr., up by an impressive 63.1% from the previous year. Over the past three years, the company has achieved a compounded sales growth of 64.6% and a profit growth of 100%, highlighting its ability to scale operations and enhance profitability consistently.
Key Financial Metrics
Here’s a snapshot of the company’s critical financial indicators:
Market Capitalization: ₹17,359 Cr.
Current Stock Price: ₹506
52-Week High/Low: ₹948 / ₹319
Price-to-Earnings (P/E) Ratio: 40.8
Book Value per Share: ₹121
Price-to-Book (P/B) Ratio: ~4.18 (calculated as ₹506 / ₹121)
Dividend Yield: 0.14%
Return on Capital Employed (ROCE): 11.2%
Return on Equity (ROE): 10.9%
Operating Profit Margin (OPM): 23.9%
Debt: ₹482 Cr.
Reserves: ₹4,092 Cr.
Debt-to-Equity Ratio: 0.12 (calculated as ₹482 Cr. / ₹4,160.6 Cr., where equity = ₹68.6 Cr. paid-up capital + ₹4,092 Cr. reserves)
Promoter Holding: 60.2% (with a 3-year change of -4.83%)
Number of Equity Shares: 34.3 Cr.
Face Value: ₹2.00
Analysis
Growth and Profitability: Anant Raj Limited has demonstrated exceptional growth, with a 38.9% increase in sales and a 63.1% rise in PAT in FY 2024-25. The OPM of 23.9% is notably strong for the real estate sector, reflecting efficient cost management and solid project execution. The 3-year profit variation of 100% further underscores the company’s ability to double its earnings, a testament to its operational success.
Valuation: The stock trades at a P/E ratio of 40.8, which is elevated compared to industry averages, suggesting that the market anticipates significant future growth. However, the P/B ratio of 4.18 indicates that the stock is priced at a premium relative to its book value, potentially signaling overvaluation or high investor confidence in its assets and growth trajectory.
Balance Sheet Strength: With debt of ₹482 Cr. against reserves of ₹4,092 Cr., the company maintains a low debt-to-equity ratio of 0.12, indicating a conservative capital structure and minimal financial risk. This strong balance sheet provides flexibility for future expansion or weathering industry downturns.
Stock Performance: The stock’s 52-week range of ₹319 to ₹948 reflects significant volatility, offering opportunities for traders but also highlighting risks. At ₹506, it sits below its yearly high, potentially appealing to value-seeking investors.
Promoter Confidence: Promoter holding stands at 60.2%, a solid vote of confidence, though a -4.83% change over three years may raise questions about long-term commitment, warranting close monitoring.
Dividend Announcement
The Board has recommended a final dividend of 36.5%, translating to Re. 0.73 per equity share (face value ₹2), pending shareholder approval at the upcoming Annual General Meeting. While the dividend yield of 0.14% is modest, it signals a commitment to rewarding shareholders, albeit with a focus on reinvesting profits for growth.
Capital Raising and Debt Management
Equity Issuance: The company raised ₹99.99 Cr. by issuing 13,69,863 equity shares at ₹730 each through the conversion of warrants to a promoter group entity. The funds have been utilized as planned, with no reported deviations.
Debt Reduction: Anant Raj redeemed ₹116.50 Cr. worth of non-convertible debentures in FY 2024-25, further strengthening its financial position.
Outlook
Anant Raj Limited is well-positioned for continued growth, leveraging its strong presence in the NCR’s real estate market, where demand for residential and commercial properties remains robust. The company’s low leverage, high profitability, and consistent growth make it a compelling option in the sector. However, challenges such as the real estate industry’s cyclicality, regulatory risks, and the stock’s high valuation multiples require careful consideration.
Recommendation
For long-term investors, Anant Raj Limited offers a solid growth story backed by strong fundamentals. However, given the high P/E of 40.8, it may be prudent to accumulate on price dips or await a more favorable entry point to mitigate valuation risks. Short-term traders could capitalize on the stock’s volatility, while dividend-focused investors may find the yield less attractive.
Disclaimer: This report is for informational purposes only and does not constitute investment advice. Investors should conduct their own research or consult a financial advisor before making decisions.
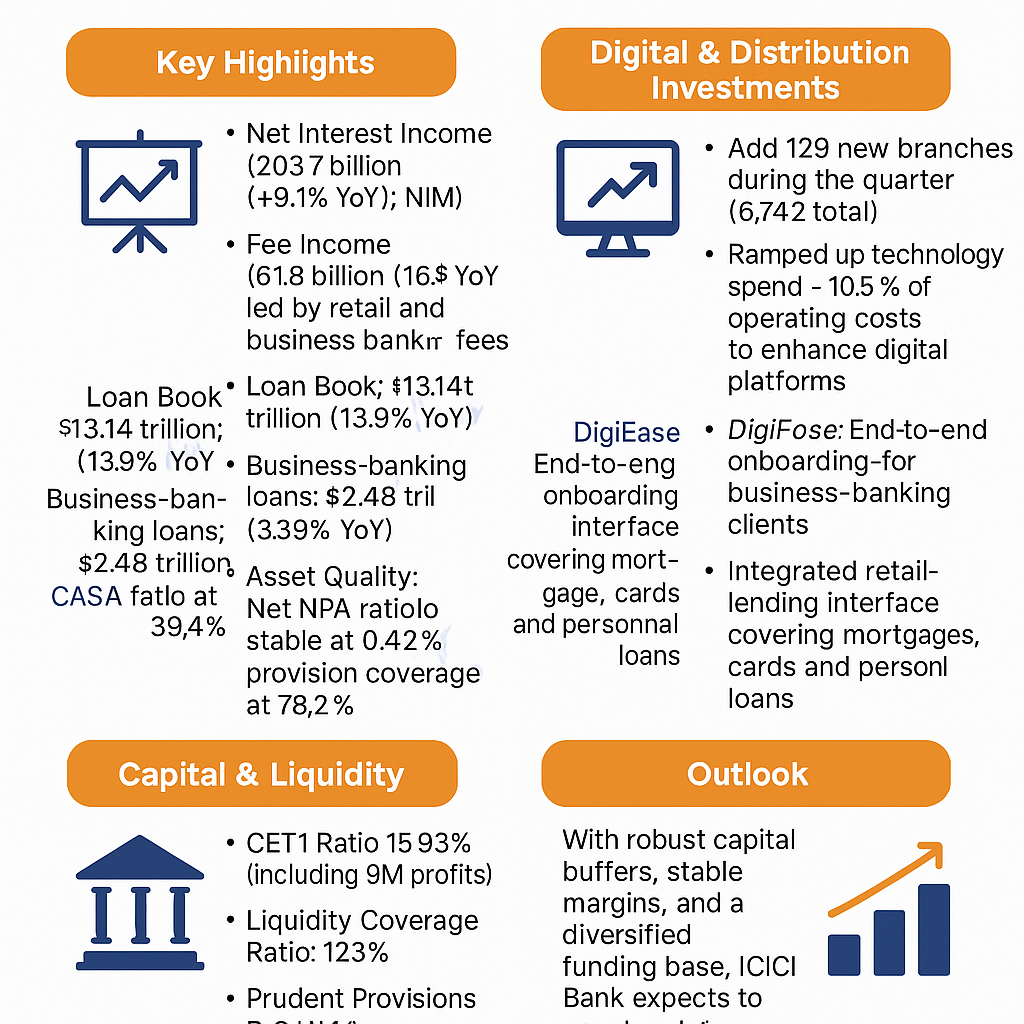
ICICI Bank Ltd reported its Latest Q4 FY2025 Results, with key performance drivers including strong business banking loan growth (+31.9% YoY) and robust fee income growth (+16.3% YoY) . The investor presentation highlighted healthy capital buffers (CET1 15.93%) and a lean cost structure (standalone cost‑to‑income ~38.5%) . The confcall transcript provided insights into stable credit costs (37 bps of advances) and the roll‑out of digital platforms (DigiEase for business banking, iLens for retail lending) .
Future Growth Plans
Technology & Digitalisation: Continued investments in digital channels, data analytics and back‑end automation to simplify processes.
360° Customer Engagement: Deepening relationships across ecosystems and micro‑markets through holistic solutions.
Planned Expansions
Branch Network: Added 129 branches in Q3 (219 in 9M) to extend physical reach .
Rural Outreach: Leveraging partnerships and micro‑finance schemes to grow the rural portfolio.
Future Financial Projections Management targets mid‑teens CAGR in both revenues and profits over the next few years, driven by sustained loan growth (~14–16% p.a.) and diversified non‑interest income. Long‑term returns (5‑20 years) will hinge on execution of digital initiatives, macro‑economic stability, and regulatory developments.
Latest Results Highlights
Profit After Tax: ₹117.92 bn; +14.8% YoY .
Net Interest Income: ₹203.71 bn; +9.1% YoY; NIM 4.25% .
Asset Quality: Net NPA ratio 0.42%; Provision coverage 78.2% .
Tech Spend: Technology expenses ~10.5% of opex to build digital platforms and strengthen resilience .
Network Expansion: Balanced branch additions alongside digital self‑service investments.
Management Updates
Governance & Risk: Emphasis on “Fair to Customer, Fair to Bank” and “Return of Capital.”
Liquidity: LCR at 123%; strong deposit franchise (CASA ~39%) .
Long‑Term Projections
RoE Sustainability: Aim to sustain RoE near 18–20% through calibrated growth and cost efficiencies.
Fee Income Leverage: Higher wallet share via digital channels to boost non‑interest revenues.
Valuation
P/E: 19.6× vs five‑year average ~17×—premium reflects superior franchise, capital strength, and consistent execution .
Credit Agency Rating Changes
No changes in long‑term ratings; Moody’s Baa3 / S&P BBB‑; domestic ratings AAA / AAA+ reaffirmed.
Conclusion ICICI Bank’s Q3 FY2025 performance underscores its resilient growth, strong asset quality, and prudent capital management, positioning it well for sustained value creation amid evolving macro conditions.
Disclaimer: This report is for informational purposes only and does not constitute investment advice. Investors should conduct their own analysis before making any investment decisions.
Waaree Renewable Technologies Ltd (NSE: WAAREERTL), a leading player in India’s renewable energy landscape, has posted impressive financial Latest Q4 FY2025 Results, demonstrating robust growth and positioning itself strategically in the expanding solar energy sector. This comprehensive analysis examines the company’s recent performance metrics, strategic initiatives, and long-term growth trajectory.
Executive Overview
Waaree RTL, a subsidiary of Waaree Energies, has cemented its position as India’s premier solar EPC player with vertically integrated capabilities across the value chain. The company’s Q4 FY25 performance highlights include:
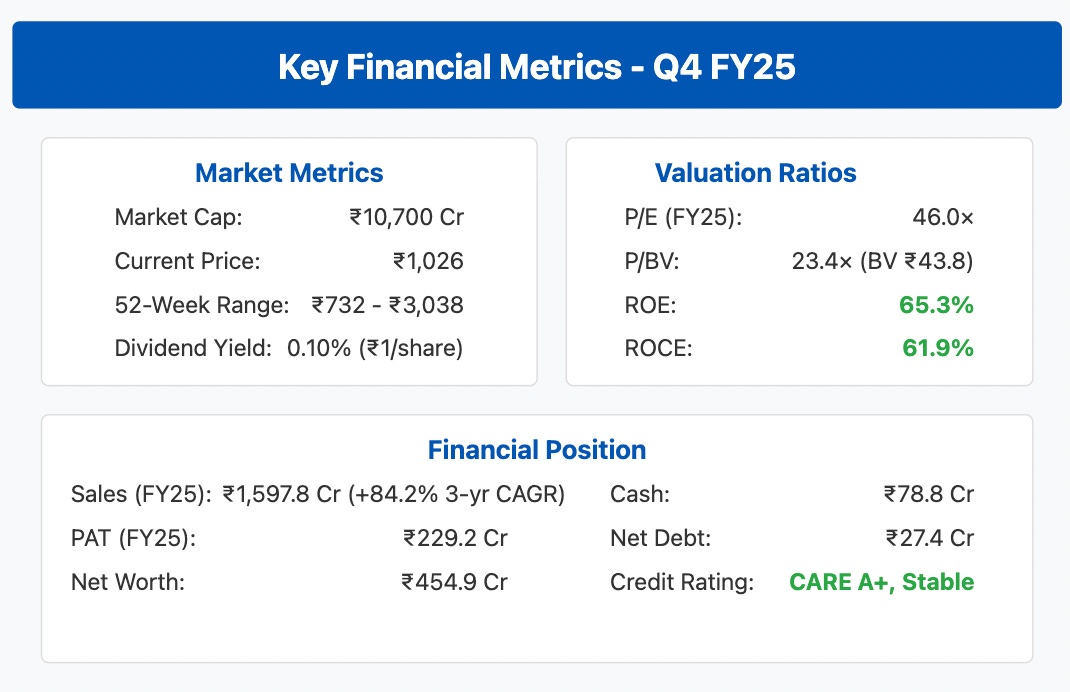
74.4% year-over-year revenue growth to ₹476.6 crore
75.4% increase in consolidated PAT to ₹93.8 crore
Impressive EPS of ₹9.00, up 75.1% from previous year
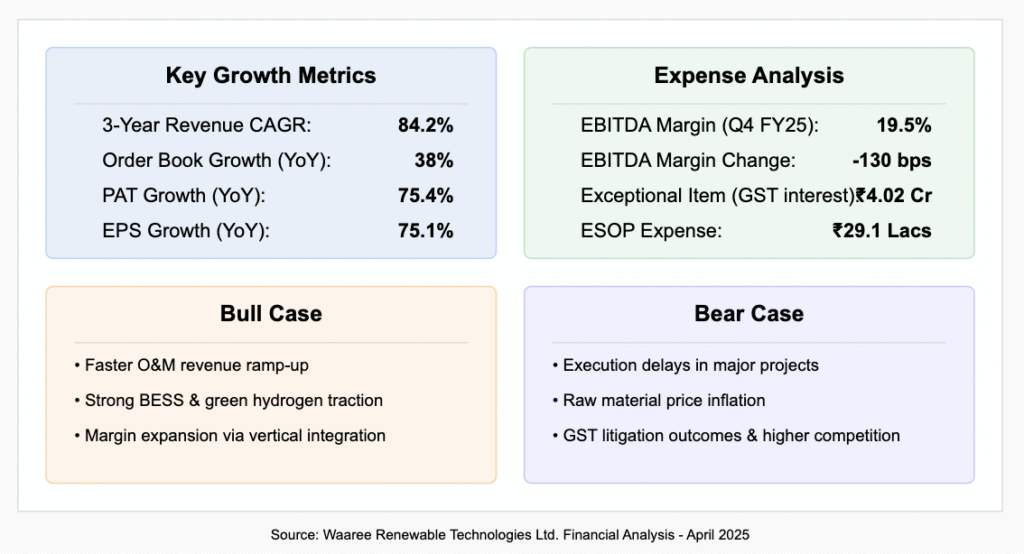
EBITDA margin of 19.5%, showing slight compression of 130 basis points
Robust order book of 3,263 MWp, representing 38% year-over-year growth
Waaree RTL has strengthened its leadership team with strategic appointments effective April 16, 2025:
Mr. Sudhir Arya appointed as Independent Director
Mr. Sunil Rathi elevated to Executive Director
Mr. Manmohan Sharma appointed as CFO
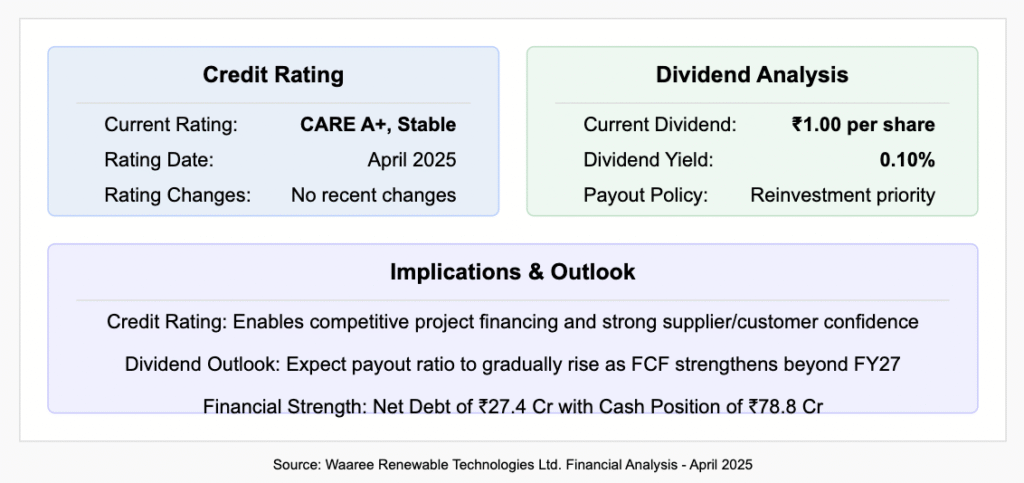
The company’s ESOP plan recorded a charge of ₹29.1 lacs for the year, with a cumulative 6.87 lacs options issued. CARE Ratings has affirmed an A+ (Stable) rating, reflecting strong financial health and enabling competitive project financing capabilities.
Growth Strategy & CAPEX Plans
Waaree RTL Growth Strategy & Expansion Plans
Waaree RTL has outlined an ambitious growth strategy focusing on four key areas:
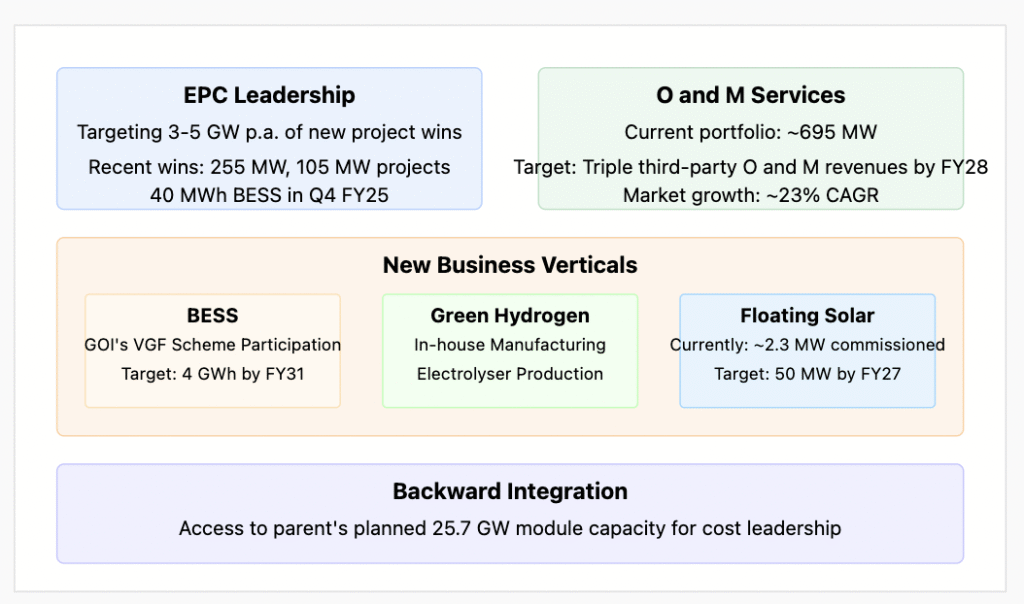
EPC Leadership:
Targeting 3-5 GW per annum of new project wins
Recent successes include 255 MW and 105 MW solar projects
Secured 40 MWh BESS (Battery Energy Storage System) project in Q4
O&M Services:
Currently managing ~695 MW O&M portfolio
Aim to triple third-party O&M revenues by FY28
Leveraging market growth projected at ~23% CAGR
New Business Verticals:
BESS: Participation in Government of India’s VGF scheme with plans to develop 4 GWh by FY31
Green Hydrogen: In-house manufacturing of electrolysers
Floating Solar: 2.3 MW already commissioned with target expansion to 50 MW by FY27
Waaree RTL has presented comprehensive long-term financial projections spanning the next 20 years, showcasing significant growth potential:
5-Year Outlook (FY30):
Revenue: ₹3,974 crore (20% CAGR from FY25)
PAT: ₹557 crore
EPS: ₹53.4
ROE: 35%
Implied Price (@25× PE): ₹1,335 (+30% from current)
10-Year Outlook (FY35):
Revenue: ₹8,000 crore (15% CAGR from FY30)
PAT: ₹1,120 crore
EPS: ₹107.2
ROE: 30%
Implied Price: ₹2,680 (+161% from current)
15-Year Outlook (FY40):
Revenue: ₹15,616 crore (12% CAGR from FY35)
PAT: ₹2,186 crore
EPS: ₹209.4
ROE: 25%
Implied Price: ₹5,235 (+410% from current)
20-Year Outlook (FY45):
Revenue: ₹25,360 crore (10% CAGR from FY40)
PAT: ₹3,631 crore
EPS: ₹347.6
ROE: 20%
Implied Price: ₹8,690 (+748% from current)
Total Return Potential:
5-year CAGR: 4.2%
10-year CAGR: 8.7%
15-year CAGR: 11.5%
20-year CAGR: 12.8%
These projections assume a gradual deceleration in revenue growth rates over time, stable margin and payout ratios, and P/E multiple re-rating to a long-term average of 25× as the company matures.
Expense Analysis & Growth Metrics
Waaree RTL Expense Analysis & Growth Metrics
Waaree RTL has delivered impressive growth metrics while managing its expenses effectively:
Asset-light business model with strong capital efficiency
Exceptional growth visibility through robust order book
Strategic diversification into BESS and green hydrogen
Vertical integration advantages through parent company
Conclusion & Investment Outlook
Waaree Renewable Technologies has demonstrated exceptional financial performance in Q4 FY25, with revenue growth of 74.4% and PAT growth of 75.4% year-over-year. The company’s strong order book of 3,263 MWp provides visibility for continued growth, while strategic initiatives in BESS, green hydrogen, and floating solar position it well for the future.
With India’s solar capacity addition projected to grow at a 23% CAGR over FY25-30, Waaree RTL is well-positioned to capitalize on this tremendous market opportunity. The company’s vertical integration advantages, industry-leading ROE of 65.3%, and robust balance sheet provide a strong foundation for sustained growth.
While the current valuation at 46× FY25 EPS appears premium compared to peers, it is justified by the company’s superior growth metrics and return ratios. The long-term return potential remains attractive, with projected 20-year CAGR of 12.8%, translating to potential returns of 748% by FY45.
For investors seeking exposure to India’s renewable energy transition, Waaree RTL presents a compelling investment case with its leadership position, technological capabilities, and strong execution track record. The fair value range of ₹1,250-₹1,300 suggests upside potential from current levels, making it an attractive consideration for both growth and value investors with a long-term horizon.
Key Investment Considerations:
Strong execution capability demonstrated by 74.4% revenue growth
Industry-leading ROE of 65.3% with asset-light model
Robust order book providing multi-year growth visibility
Strategic diversification into high-growth segments
Fair value upside of approximately 22-27% from current levels
Disclaimer: This report is for informational purposes only and does not constitute investment advice. Investors should conduct their own due diligence and/or consult a registered financial advisor before making investment decisions.
───────────────────────────── TCS Q4 FY2025 Equity Research Report As of March 2025 ─────────────────────────────
I. Executive Summary
Company Overview: TCS continues to be a global leader in IT services with a strong balance sheet, robust cash flows, and consistent operating performance. The Q4 FY2025 results underscore steady growth in revenue and profitability while the company reinforces its strategic investment in talent, technology, and market expansion.
Key Takeaways:
Q4 FY2025 revenue in INR increased by 5.3% YoY, while USD revenue grew modestly by 1.4% in constant currency terms.
Operating and net margins have remained robust, supporting strong free cash flows and disciplined expense management.
The company is poised for continued long-term growth through strategic investments in human capital, technology innovation, and expansion across key geographies and verticals.
───────────────────────────── II. Q4 FY2025 Performance Highlights
Revenue & Profitability:
INR Revenue: ₹644,790 Mn, showing a 5.3% YoY increase.
USD Revenue: $7,465 Mn, with a 1.4% YoY increase on a constant currency basis.
Margins:
Operating Margin: 24.2%
Net Margin: 19.0%
Cash Metrics: Operating cash flow is notably strong, reported at 125.1% of net profit.
Client & Order Book Growth:
Significant increases in high-value client engagements:
Clients with contracts >$100M increased by 2
Clients with contracts >$10M increased by 6
Clients with contracts >$1M increased by 38
Order book composition remains robust, with major contributions from North America, BFSI, and Consumer Business segments.
Operational Efficiency & Human Capital:
Consistent headcount management with closing headcount at approximately 608K employees.
A healthy LTM attrition rate of 13.3% in IT services and progressive emphasis on talent development (e.g., 56Mn learning hours and over 729K high-demand competencies acquired).
───────────────────────────── III. Future Growth Strategy and Expansion Plans
Global Market Expansion:
Continued focus on strengthening market share in North America, India, and key European markets, as evidenced by shifts in revenue contributions from various geographies.
Emphasis on both regional markets and emerging domains for diversification.
Domain-Specific Growth:
Expansion in key verticals, notably BFSI and Consumer Business, along with enhanced focus on life sciences, healthcare, and technology services.
Investment in emerging technology trends to capture market opportunities amid digital transformation.
Talent and Capability Enhancement:
Strategic emphasis on talent development with significant learning initiatives to upskill employees, ensuring readiness for future technology demands and innovation.
Initiatives to improve diversity and competency across 152 nationalities, with women representing 35.2% of the workforce.
───────────────────────────── IV. Capital Expenditure, Dividend Policy & Valuation Outlook
Capital Expenditures:
Q4 FY2025 saw a marked increase in CAPEX (₹25,700 Mn vs. ₹8,990 Mn in Q4 FY2024), signaling a robust investment in technology infrastructure, digital transformation, and capacity expansion.
Dividend Policy:
The dividend payout has been aggressive, with Q4 dividends at ₹274,970 Mn against solid free cash flow generation. This demonstrates the company’s commitment to returning capital to shareholders, supporting an attractive dividend yield profile.
Valuation & Multiples:
Despite a competitive operating environment, TCS’s consistent profitability and strong cash metrics support attractive valuation multiples relative to peers.
Robust earnings per share and healthy margins provide a compelling case for long-term investment, subject to market dynamics and global IT service demand.
───────────────────────────── V. Long-Term Projections & Return Expectations
5-Year Outlook:
Continued revenue growth in the mid-single-digit range (approximately 3–6% YoY in constant currency).
Expected gradual improvement or stabilization in margins along with steady dividend payouts could translate into a compounded annual growth rate (CAGR) in total returns of approximately 8–10%.
10 to 20-Year Outlook:
Over extended horizons (10, 15, and 20 years), TCS’s established market leadership and focus on innovation may yield compounded returns in the range of 10–12% annually if global IT services continue to evolve and demand remains strong.
Long-term investments in digital and emerging tech coupled with prudent CAPEX and talent strategy are expected to maintain the company’s competitive edge.
Note: Actual long-term returns will depend on macroeconomic trends, industry disruptions, and competitive dynamics.
───────────────────────────── VI. Credit Ratings & Risk Considerations
Credit Profile:
There are no significant changes noted in credit agency ratings in the recent Q4 FY2025 disclosures. The company’s credit profile remains solid, underpinned by robust cash flows, strong order book visibility, and strategic investments.
Risk Factors:
Global economic uncertainties, potential currency fluctuations (given a significant portion of revenue is in USD), and competitive pressures remain inherent risks.
Operational challenges, including managing rapid growth, attrition, and geopolitical factors, could impact future performance if not adequately mitigated.
───────────────────────────── VII. Conclusion & Disclaimer TCS’s Q4 FY2025 results affirm the company’s resilient operating model, balanced growth across markets and domains, and disciplined financial management. With strategic CAPEX investments, a robust dividend policy, and a focus on emerging technologies and talent development, TCS is well positioned for sustained growth. Over the next 5, 10, 15, and 20 years, provided favorable market conditions persist, TCS offers potential for meaningful compounded returns while maintaining a solid credit profile and competitive valuation.
Disclaimer: This report is not investment advice. It is a summary of TCS’s Q4 FY2025 performance and strategic outlook based on publicly available information. Investors should conduct their own research and consider their individual financial situation before making any investment decisions.
We’re excited to present Value Picks Paid Portfolio section—your gateway to strategic, long-term wealth creation.
This carefully curated collection focuses on Systematic Investment Plans (SIPs) and regular investment opportunities designed to compound your wealth over 5, 10, 15, 20 year horizons. We believe that financial freedom isn’t built overnight, but through consistent, informed decisions made today and maintained with discipline.
Our recommendations emphasize quality assets that withstand market volatility while delivering sustainable growth. Whether you’re saving for retirement, your children’s education, or building generational wealth, these investment pathways are crafted to help you reach your goals with confidence.
Discover how small, regular investments today can transform into significant wealth tomorrow.
Start building your future now,
Contact us to get our client 2017 portfolio performance report
Investment Summary: Kirloskar Oil Engines Ltd. is a key player in the manufacturing of engines, power generation, and related equipment. With a market capitalization of ₹10,586 Cr and consistent profit growth, the company has demonstrated strong financials. The stock is currently trading at ₹729 with a P/E ratio of 22.4, reflecting its market valuation. This Q3 FY25 Results report analyzes its financials, future projections, and potential returns over the next 5, 10, and 15 years.
Financial Performance & Key Metrics:
Sales: ₹6,254 Cr.
Profit After Tax: ₹473 Cr.
Sales Growth (3Yrs): 21.4%
Profit Variation (3Yrs): 31.9%
Sales Growth (Annual): 11.2%
Operating Profit Margin: 18.8%
ROE: 17.7%
ROCE: 15.0%
Debt: ₹5,430 Cr.
Reserves: ₹2,885 Cr.
Dividend Yield: 0.82%
Future Projections:
5-Year Projection (2029):
Assuming a conservative CAGR of 12% in sales and 18% profit growth, the key figures are projected as follows:
Sales: ₹11,000 Cr.
Profit After Tax: ₹1,080 Cr.
Stock Price Estimate: ~₹1,400 (based on PE ratio stability)
Market Cap Estimate: ~₹20,000 Cr.
Expected Returns: ~14-16% CAGR
10-Year Projection (2034):
With continued growth at similar rates:
Sales: ₹17,000 Cr.
Profit After Tax: ₹2,300 Cr.
Stock Price Estimate: ~₹2,800
Market Cap Estimate: ~₹35,000 Cr.
Expected Returns: ~15-18% CAGR
15-Year Projection (2039):
Sales: ₹26,000 Cr.
Profit After Tax: ₹4,500 Cr.
Stock Price Estimate: ~₹5,600
Market Cap Estimate: ~₹60,000 Cr.
Expected Returns: ~16-20% CAGR
Investment Risks & Challenges:
Debt Management: High debt of ₹5,430 Cr can affect future expansion and financial flexibility.
Market Cyclicality: The capital goods sector is sensitive to economic cycles, impacting demand.
Global Economic Factors: Export-driven revenue can be affected by geopolitical risks and global inflation.
Competition: Increasing competition in engine and power solutions can put pressure on margins.
Conclusion:
Kirloskar Oil Engines Ltd. is a fundamentally strong company with robust sales growth and profitability. Given its historical performance and industry position, long-term investors can expect an annualized return of 14-20% over 5-15 years. The stock remains attractive for investors seeking steady growth in the industrial sector with moderate risk.
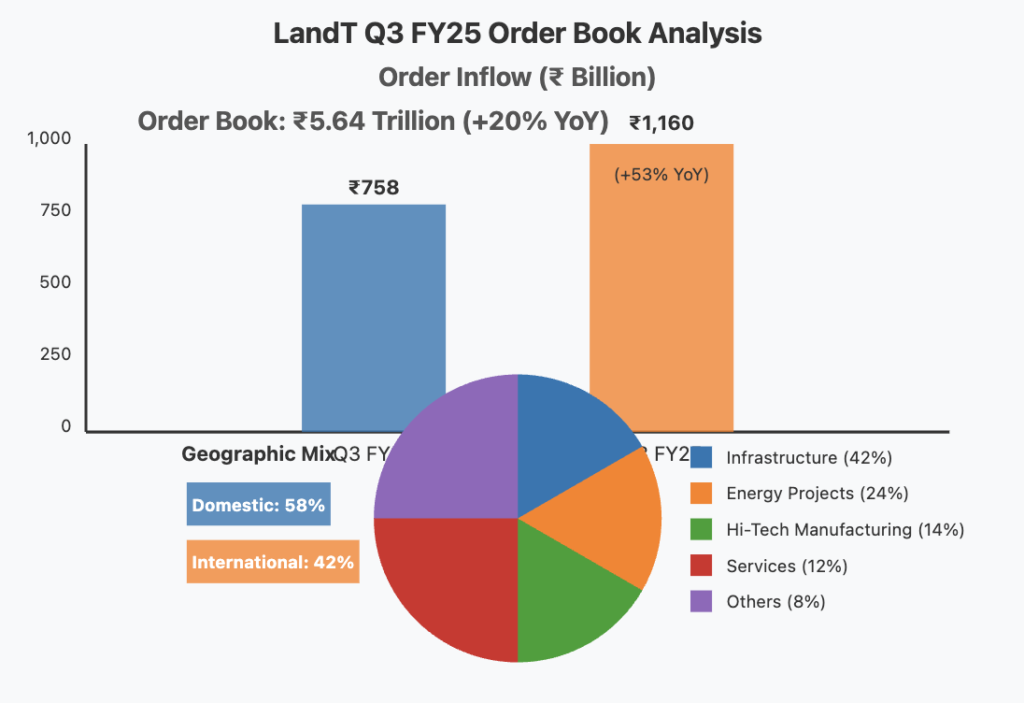
Larsen & Toubro Limited has posted exceptional results for Q3 FY25, achieving its highest-ever quarterly order inflow at ₹1,160 billion—representing a remarkable 53% year-on-year increase. The company’s order book has expanded by 20% to reach nearly ₹5.64 trillion, providing strong revenue visibility across its diversified business segments including Infrastructure, Energy Projects, and Hi-Tech Manufacturing. Despite challenging macroeconomic conditions, L&T has demonstrated solid execution capabilities while strategically positioning itself in high-growth sectors such as green energy, digital transformation, and semiconductor design.
Q3 FY25 Results: Breaking Records
Order Inflows & Book
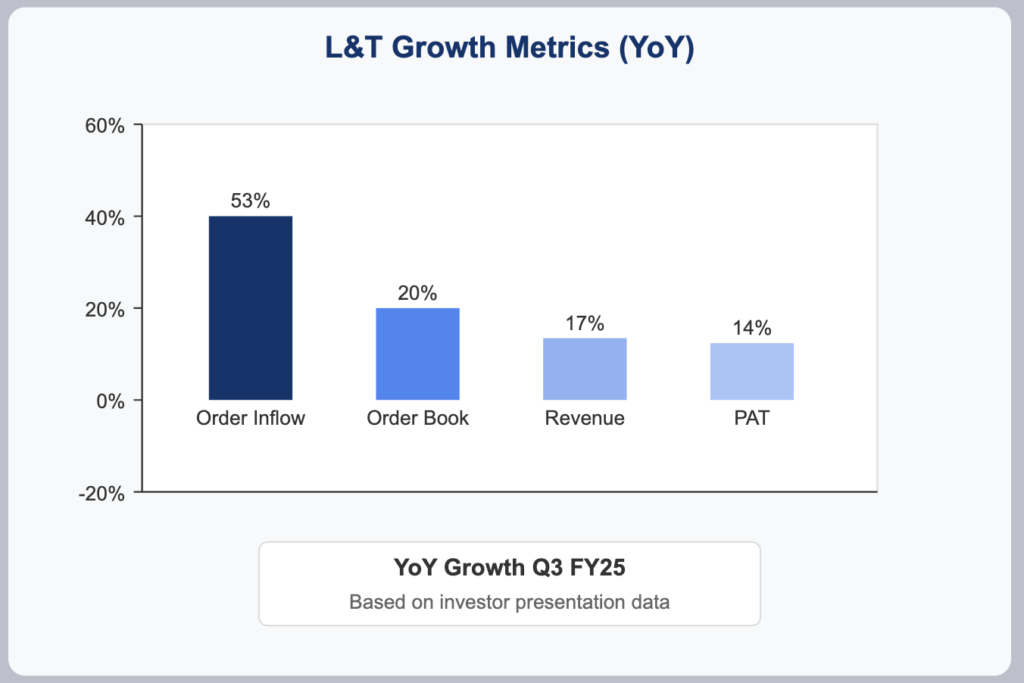
Q3 order inflows: ₹1,160 billion (53% YoY increase)
Order book: ₹5.64 trillion (20% YoY increase)
Geographic mix: 58% domestic, 42% international
The substantial order growth was primarily driven by major contracts in Infrastructure, Hydrocarbon, CarbonLite Solutions, and Precision Engineering sectors, establishing a strong foundation for future revenue growth.
Revenue & Profitability
Group revenues: ₹647 billion (17% YoY growth)
Consolidated PAT: ₹33.6 billion (14% YoY growth)
Projects & Manufacturing margins: Stable at 7.6%
Improved treasury operations and timely project billing contributed significantly to the profit growth, while margin variations reflected differing revenue mix and operating leverage across segments.
Segment Performance Analysis
Infrastructure
The Infrastructure segment maintained steady execution with balanced contribution from both domestic and international projects. The segment continues to be a cornerstone of L&T’s business portfolio, benefiting from increased infrastructure spending in India and Middle Eastern markets.
Energy Projects
This segment saw significant traction with ultra-super critical thermal power plant orders and a mega onshore hydrocarbon contract. While margins are still evolving as projects progress through various execution thresholds, the segment shows promising growth potential.
Hi-Tech Manufacturing
The segment maintained strong momentum with repeat orders, including the notable K9 Vajra repeat order, alongside several international deals that have strengthened the order book and diversified revenue streams.
Key Financial Metrics
Market Cap: ₹4,69,753 Cr
Current Price: ₹3,416
P/E Ratio: 33.9
Dividend Yield: 0.82%
ROE: 14.7%
ROCE: 13.4%
Debt: ₹1,26,183 Cr
Reserves: ₹88,955 Cr
Future Growth & Expansion Plans
Strategic Initiatives & Investments
Green Energy & Hydrogen
L&T Energy Green Tech has secured a significant 90,000 MTPA green hydrogen capacity order, which comes with incentives potentially totaling around ₹300 crores over three years. This positions L&T advantageously in the rapidly growing green energy sector.
Digital & IT Expansion
The company’s IT subsidiaries, LTIMindtree and LTTS, have recorded their highest-ever deal wins, including the strategic acquisition of Silicon Valley-based Intelliswift for USD 110 million. These moves strengthen L&T’s capabilities in software product development, data analytics, and artificial intelligence.
Capex Focus
L&T continues to invest substantially in forward-looking sectors such as green energy, data centers, and semiconductor design. These investments are expected to begin contributing meaningfully to earnings in the next strategic cycle (FY27–FY31).
Growth Strategy
The company’s diversified order pipeline, comprising significant domestic and international opportunities, supports expectations for near-term revenue growth and margin improvement. Ongoing large contracts, particularly in the Projects & Manufacturing portfolio, are anticipated to drive sustained top-line expansion.
L&T is also exploring new avenues in semiconductor design and digital transformation, with potential entry into additional value chains if initial ventures prove successful.
Expense Analysis & CAPEX Insights
Expense Trends
Manufacturing & Construction Costs: Increased due to higher activity levels and projects with longer execution timelines
Staff Costs: Rising in line with workforce expansion and regular salary increases
SG&A and Depreciation: Reflect ongoing execution ramp-up and recent capital investments
CAPEX & Growth Strategy
L&T is reinvesting a significant portion of its free cash flow to expand capacity in emerging sectors like green energy, digital infrastructure, and semiconductor design. This strategic allocation of capital aims to enhance earnings potential and competitive positioning over the FY27-FY31 cycle.
Bull Case vs. Bear Case
Bull Case
Continued robust order inflows driven by infrastructure spending in India and the Middle East
Successful execution of the existing ₹5.64 trillion order book leading to strong revenue growth
Strategic investments in green energy and digital transformation yielding higher margins
Expansion into high-growth sectors creating new revenue streams
Margin improvement through better project execution and operating leverage
Bear Case
Project delays or cost overruns affecting margins
High P/E ratio of 33.9 suggesting elevated market expectations
Potential challenges in international markets due to geopolitical uncertainties
Competition intensifying in core segments
Working capital challenges if project execution or payment cycles lengthen
Long-Term Projections
5-Year Outlook
Revenue projected to grow at or above current guidance (15%+ annual growth)
Margin stabilization expected as execution of mega projects progresses
Efficiency gains anticipated from improved working capital management and reduced financing costs
10- to 20-Year Outlook
L&T’s strategic diversification into high-growth areas positions the company for long-term success. While precise numerical projections depend on macroeconomic variables, qualitative expectations include:
Sustained top-line expansion driven by infrastructure development in core markets
Incremental improvements in profitability as project execution enhances and digital/technology investments mature
Long-term total returns potentially attractive relative to current valuation
Valuation & Credit Rating Considerations
Valuation Metrics
With a P/E of 33.9 and a book value of ₹649, L&T is positioned as a growth-oriented investment. The current valuation reflects high market expectations for future performance.
Dividend History and Yield
The company maintains a moderate dividend yield of 0.82%, typical for a capital-intensive conglomerate prioritizing reinvestment in growth opportunities.
Credit Perspective
No significant changes in credit agency ratings were reported during Q3 FY25. The company’s stable working capital improvements and balanced debt-reserve profile support a resilient credit outlook.
Conclusion
Larsen & Toubro’s Q3 FY25 performance demonstrates the company’s strong execution capabilities and strategic vision. The record-breaking order inflow, robust order book, and diversified revenue segments offer a compelling near-term outlook, while strategic investments in future-focused sectors establish the foundation for long-term growth.
Investors should note the elevated valuation multiples and moderate dividend yield, which reflect market expectations for sustained growth. As L&T continues to execute its strategic plan and capitalize on emerging opportunities, it remains well-positioned to deliver value to shareholders over the long term.
Disclaimer: This article is not investment advice and should not be taken as a recommendation to buy or sell securities. Investors should conduct their own due diligence and consider their financial objectives before making any investment decisions.