─────────────────────────────
TCS Q4 FY2025 Equity Research Report
As of March 2025
─────────────────────────────
I. Executive Summary
- Company Overview:
TCS continues to be a global leader in IT services with a strong balance sheet, robust cash flows, and consistent operating performance. The Q4 FY2025 results underscore steady growth in revenue and profitability while the company reinforces its strategic investment in talent, technology, and market expansion. - Key Takeaways:
- Q4 FY2025 revenue in INR increased by 5.3% YoY, while USD revenue grew modestly by 1.4% in constant currency terms.
- Operating and net margins have remained robust, supporting strong free cash flows and disciplined expense management.
- The company is poised for continued long-term growth through strategic investments in human capital, technology innovation, and expansion across key geographies and verticals.
─────────────────────────────
II. Q4 FY2025 Performance Highlights

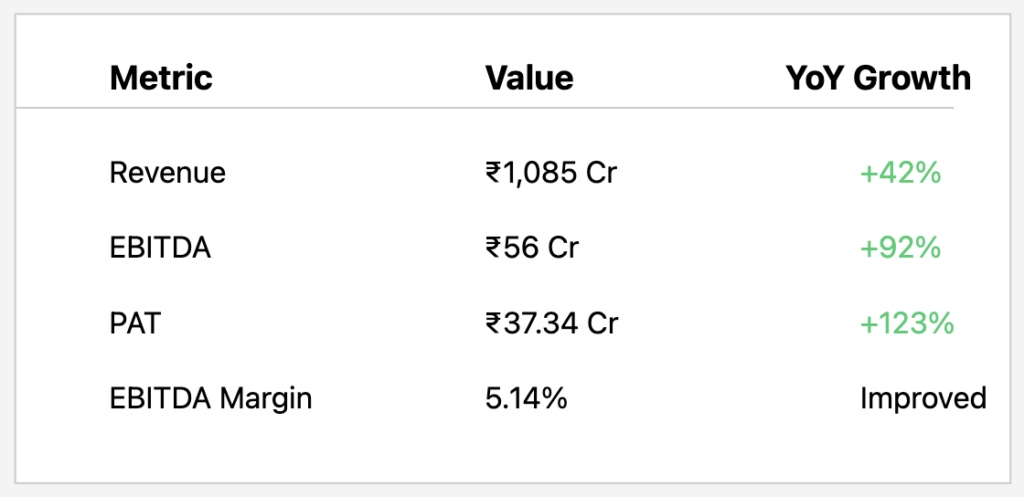
- Revenue & Profitability:
- INR Revenue: ₹644,790 Mn, showing a 5.3% YoY increase.
- USD Revenue: $7,465 Mn, with a 1.4% YoY increase on a constant currency basis.
- Margins:
- Operating Margin: 24.2%
- Net Margin: 19.0%
- Cash Metrics: Operating cash flow is notably strong, reported at 125.1% of net profit.
- Client & Order Book Growth:
- Significant increases in high-value client engagements:
- Clients with contracts >$100M increased by 2
- Clients with contracts >$10M increased by 6
- Clients with contracts >$1M increased by 38
- Order book composition remains robust, with major contributions from North America, BFSI, and Consumer Business segments.
- Significant increases in high-value client engagements:
- Operational Efficiency & Human Capital:
- Consistent headcount management with closing headcount at approximately 608K employees.
- A healthy LTM attrition rate of 13.3% in IT services and progressive emphasis on talent development (e.g., 56Mn learning hours and over 729K high-demand competencies acquired).
(Source: TCS Q4 FY2025 investor presentation & conf call )
─────────────────────────────
III. Future Growth Strategy and Expansion Plans
- Global Market Expansion:
- Continued focus on strengthening market share in North America, India, and key European markets, as evidenced by shifts in revenue contributions from various geographies.
- Emphasis on both regional markets and emerging domains for diversification.
- Domain-Specific Growth:
- Expansion in key verticals, notably BFSI and Consumer Business, along with enhanced focus on life sciences, healthcare, and technology services.
- Investment in emerging technology trends to capture market opportunities amid digital transformation.
- Talent and Capability Enhancement:
- Strategic emphasis on talent development with significant learning initiatives to upskill employees, ensuring readiness for future technology demands and innovation.
- Initiatives to improve diversity and competency across 152 nationalities, with women representing 35.2% of the workforce.
─────────────────────────────
IV. Capital Expenditure, Dividend Policy & Valuation Outlook
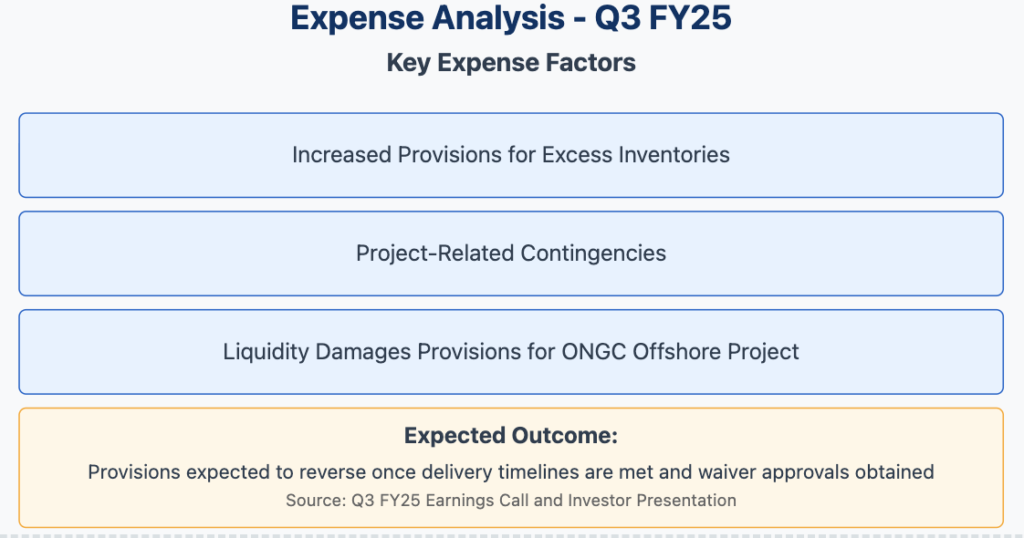
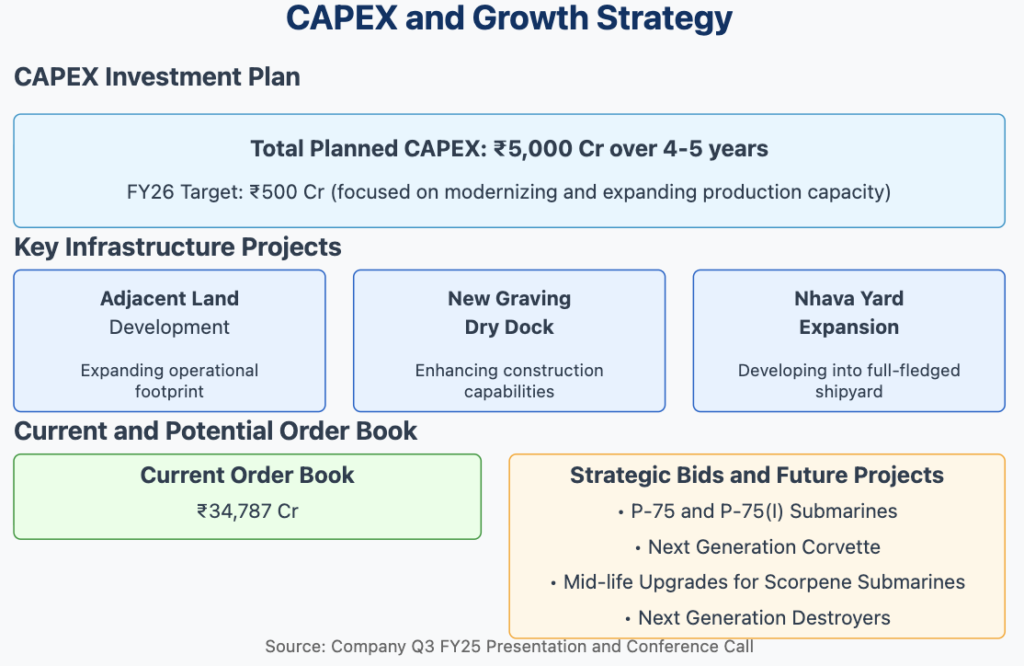
- Capital Expenditures:
- Q4 FY2025 saw a marked increase in CAPEX (₹25,700 Mn vs. ₹8,990 Mn in Q4 FY2024), signaling a robust investment in technology infrastructure, digital transformation, and capacity expansion.
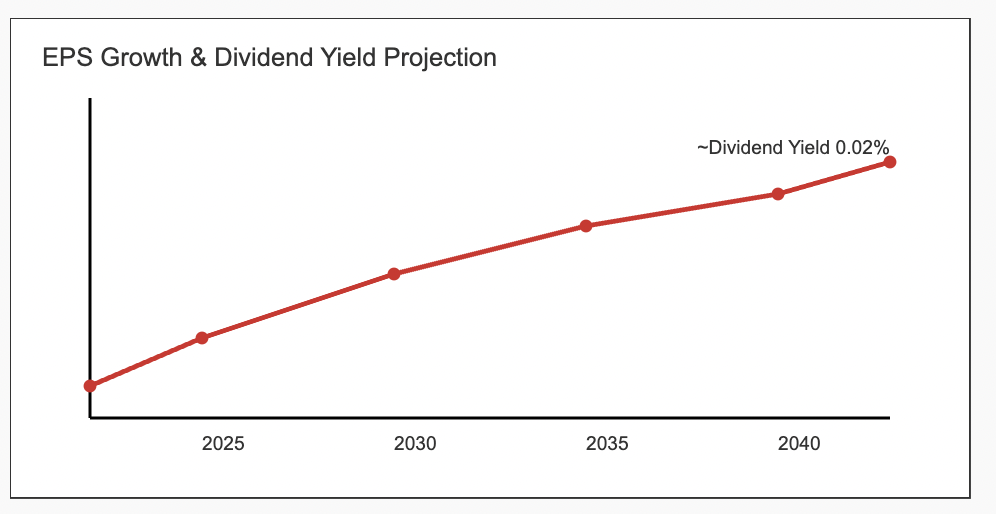
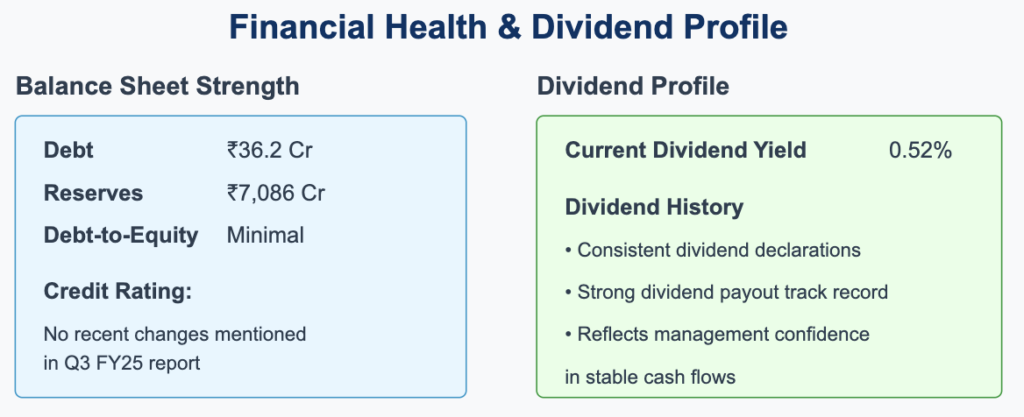
- Dividend Policy:
- The dividend payout has been aggressive, with Q4 dividends at ₹274,970 Mn against solid free cash flow generation. This demonstrates the company’s commitment to returning capital to shareholders, supporting an attractive dividend yield profile.
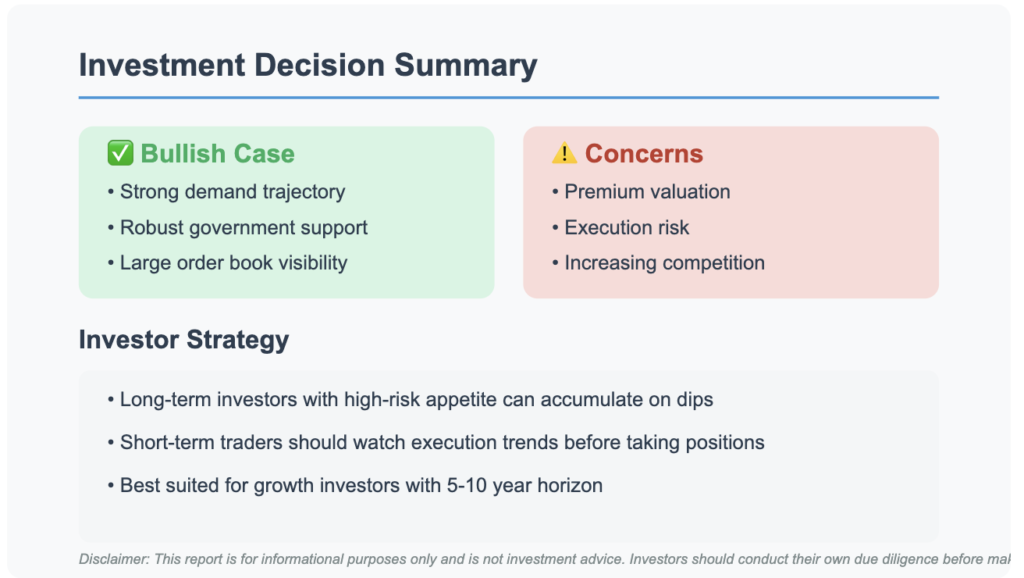
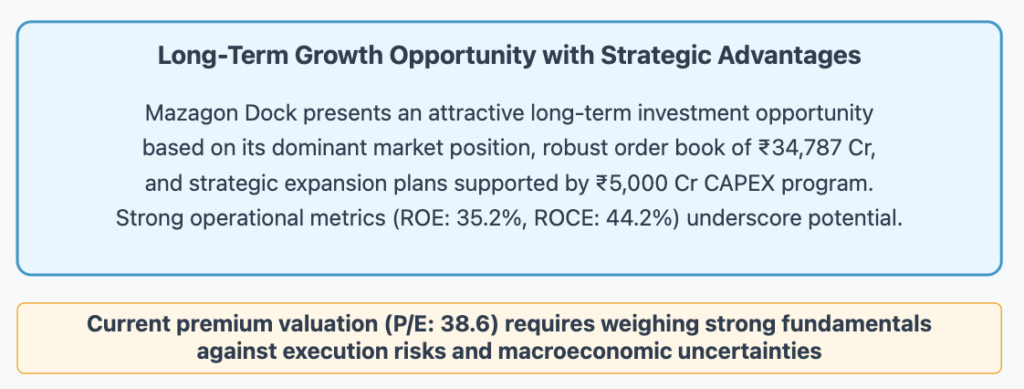
- Valuation & Multiples:
- Despite a competitive operating environment, TCS’s consistent profitability and strong cash metrics support attractive valuation multiples relative to peers.
- Robust earnings per share and healthy margins provide a compelling case for long-term investment, subject to market dynamics and global IT service demand.
─────────────────────────────
V. Long-Term Projections & Return Expectations

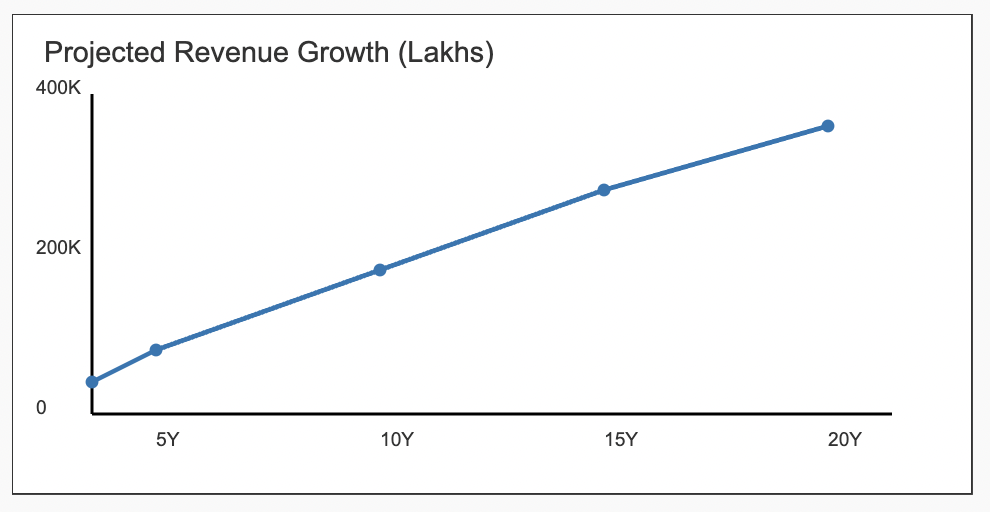
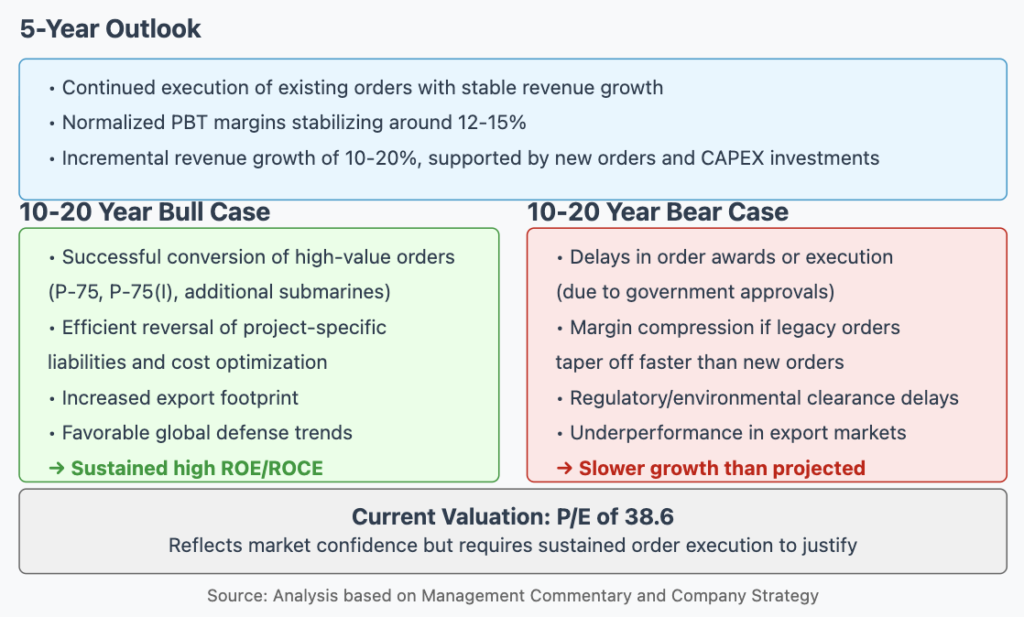
- 5-Year Outlook:
- Continued revenue growth in the mid-single-digit range (approximately 3–6% YoY in constant currency).
- Expected gradual improvement or stabilization in margins along with steady dividend payouts could translate into a compounded annual growth rate (CAGR) in total returns of approximately 8–10%.
- 10 to 20-Year Outlook:
- Over extended horizons (10, 15, and 20 years), TCS’s established market leadership and focus on innovation may yield compounded returns in the range of 10–12% annually if global IT services continue to evolve and demand remains strong.
- Long-term investments in digital and emerging tech coupled with prudent CAPEX and talent strategy are expected to maintain the company’s competitive edge.
Note: Actual long-term returns will depend on macroeconomic trends, industry disruptions, and competitive dynamics.
─────────────────────────────
VI. Credit Ratings & Risk Considerations
- Credit Profile:
- There are no significant changes noted in credit agency ratings in the recent Q4 FY2025 disclosures. The company’s credit profile remains solid, underpinned by robust cash flows, strong order book visibility, and strategic investments.
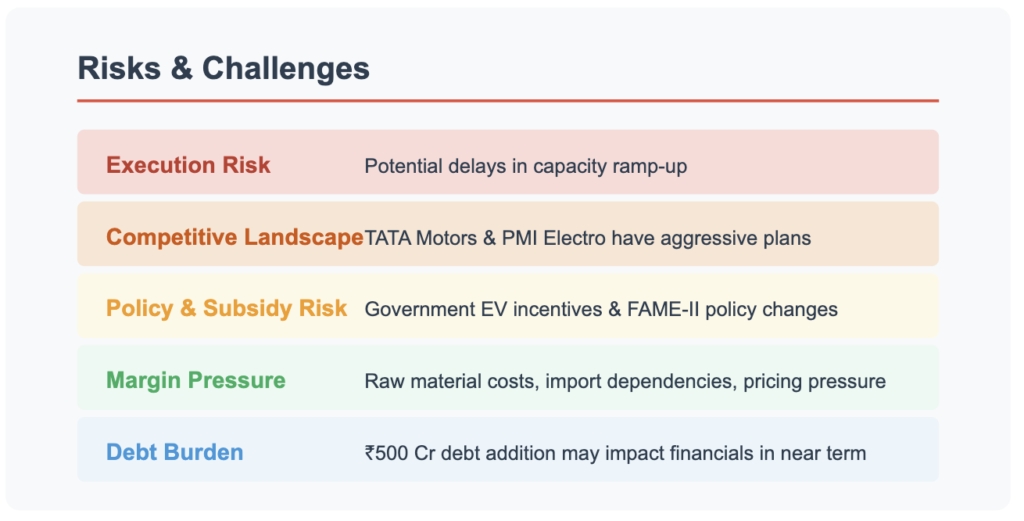
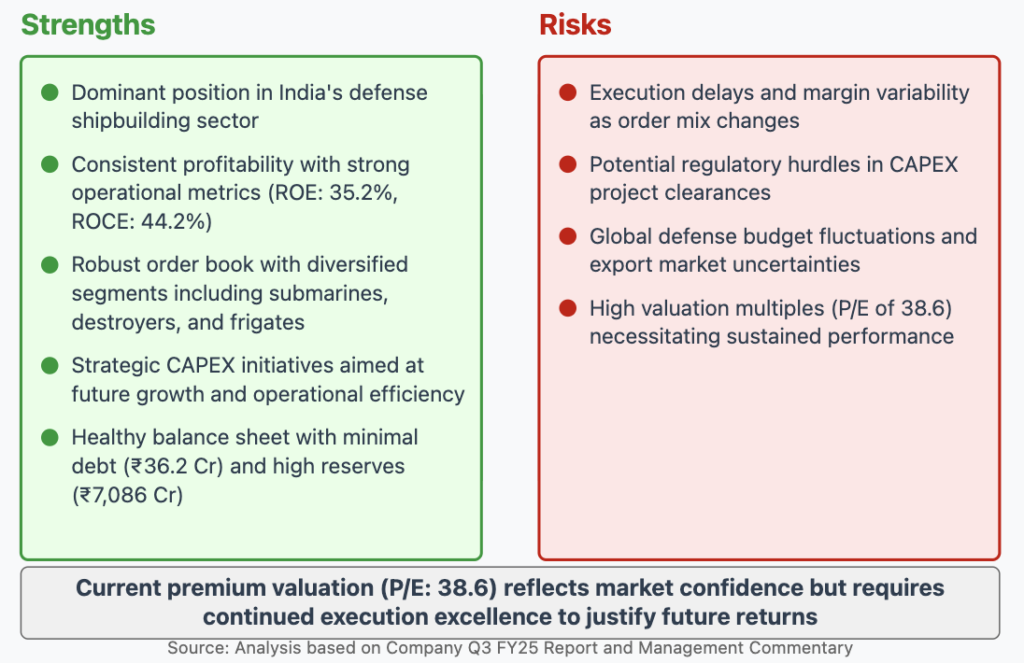
- Risk Factors:
- Global economic uncertainties, potential currency fluctuations (given a significant portion of revenue is in USD), and competitive pressures remain inherent risks.
- Operational challenges, including managing rapid growth, attrition, and geopolitical factors, could impact future performance if not adequately mitigated.
─────────────────────────────
VII. Conclusion & Disclaimer
TCS’s Q4 FY2025 results affirm the company’s resilient operating model, balanced growth across markets and domains, and disciplined financial management. With strategic CAPEX investments, a robust dividend policy, and a focus on emerging technologies and talent development, TCS is well positioned for sustained growth. Over the next 5, 10, 15, and 20 years, provided favorable market conditions persist, TCS offers potential for meaningful compounded returns while maintaining a solid credit profile and competitive valuation.
Disclaimer:
This report is not investment advice. It is a summary of TCS’s Q4 FY2025 performance and strategic outlook based on publicly available information. Investors should conduct their own research and consider their individual financial situation before making any investment decisions.